

Key Insights
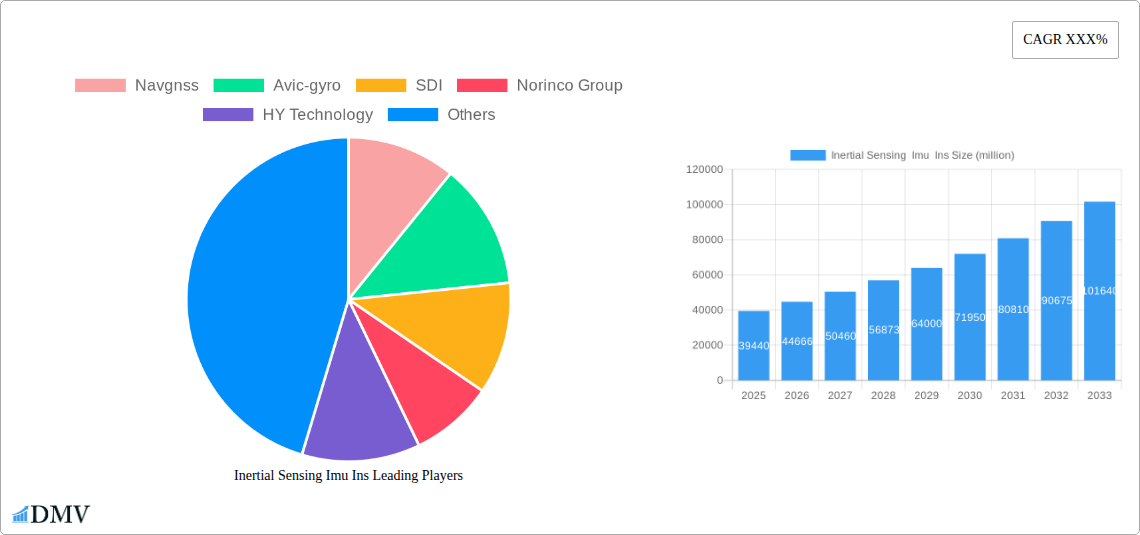
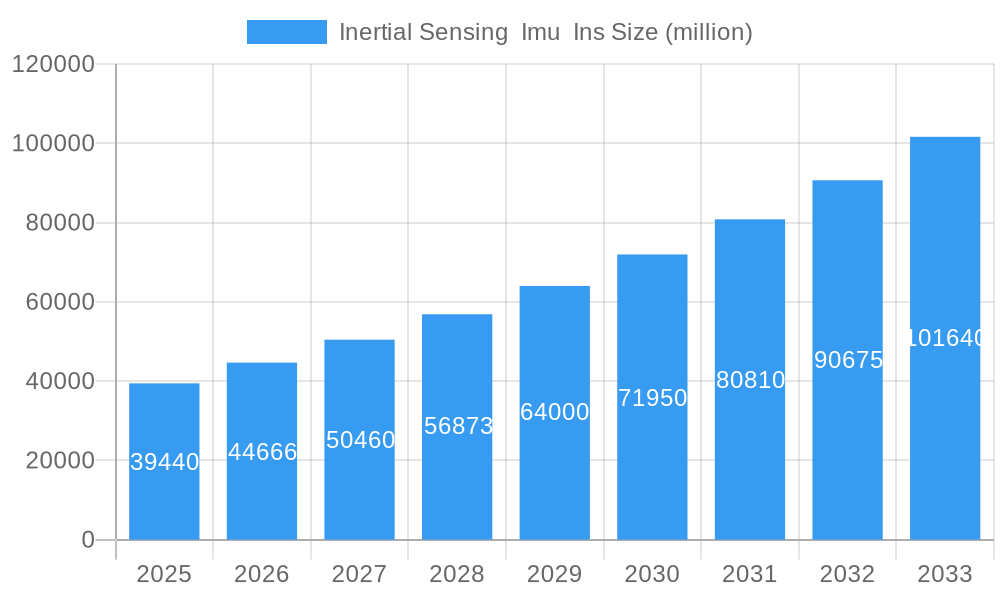
The global Inertial Sensing IMU INS market is poised for significant expansion, projected to reach $39.44 billion by 2025. This robust growth is fueled by a CAGR of 13.2% over the forecast period of 2025-2033. The primary drivers behind this surge include the escalating demand for precise navigation and positioning across a multitude of industries, including aerospace, defense, automotive, and consumer electronics. The increasing adoption of autonomous systems, such as self-driving vehicles and drones, inherently relies on sophisticated inertial sensing technologies for real-time situational awareness and control. Furthermore, advancements in miniaturization and cost reduction of Inertial Measurement Units (IMUs) and Integrated Navigation Systems (INS) are democratizing their application, making them accessible for a broader range of commercial and industrial uses. The market is witnessing a strong trend towards higher accuracy, lower power consumption, and enhanced resilience against external interference, catering to the stringent requirements of critical applications.
Inertial Sensing Imu Ins Market Size (In Billion)
Key segments contributing to this market dynamism include Gyroscopes and Accelerometers, which form the foundational components of IMUs and INS. The Application segment is largely dominated by Integrated Navigation Systems (INS), highlighting their critical role in complex navigation solutions. Geographically, the Asia Pacific region, particularly China, is expected to emerge as a leading market due to substantial investments in defense, aerospace, and smart city initiatives, alongside a burgeoning automotive sector. Emerging markets in North America and Europe are also demonstrating considerable growth, driven by smart infrastructure development and the rapid evolution of the autonomous vehicle landscape. While the market is propelled by strong demand, potential restraints such as high initial investment costs for advanced systems and the need for specialized expertise in development and deployment might present some challenges. However, the overarching trend of technological innovation and increasing integration of inertial sensing into everyday technologies are expected to significantly outweigh these limitations.
Inertial Sensing Imu Ins Company Market Share
Inertial Sensing IMU INS Market: A Comprehensive Analysis (2019–2033)
This in-depth report provides an exhaustive analysis of the global Inertial Sensing IMU INS market, meticulously examining trends, industry evolution, regional dominance, product innovations, growth drivers, obstacles, and future opportunities. Covering the historical period of 2019–2024, base year 2025, and a forecast period extending to 2033, this report is an indispensable resource for stakeholders seeking to understand and capitalize on the dynamic inertial sensing landscape.
Inertial Sensing IMU INS Market Composition & Trends
The Inertial Sensing IMU INS market, valued at an estimated XXX billion in the base year 2025, is characterized by a moderate level of concentration, with key players like Navgnss, Avic-gyro, and SDI holding significant market shares. Innovation remains a primary catalyst, driven by advancements in MEMS technology and the increasing demand for precision in navigation and guidance systems across various applications, including Integrated Navigation Systems (INS) and Inertial Measurement Units (IMU). The regulatory landscape, while evolving, generally supports the adoption of these technologies, particularly in aerospace and defense sectors. Substitute products, such as GPS-only solutions, are continuously being challenged by the superior accuracy and operational independence of INS/IMU systems, especially in GPS-denied environments. End-user profiles are diverse, encompassing defense contractors, automotive manufacturers, drone operators, and industrial automation companies, all seeking enhanced situational awareness and autonomous capabilities. Merger and acquisition (M&A) activities, with an estimated deal value of XXX billion historically, indicate strategic consolidation and efforts to acquire specialized expertise or expand product portfolios.
- Market Share Distribution: Key players like Navgnss, Avic-gyro, and SDI collectively hold approximately XX% of the market share.
- M&A Deal Value (Historical): Estimated at XXX billion between 2019 and 2024.
- Innovation Catalysts: MEMS advancements, miniaturization, and the need for enhanced navigation accuracy.
- Regulatory Landscape: Supportive for defense and critical infrastructure applications.
- Substitute Products: GPS-only solutions, with limitations in challenging environments.
- End-User Segments: Defense, Automotive, Aerospace, Industrial Automation, Robotics.
Inertial Sensing IMU INS Industry Evolution
The Inertial Sensing IMU INS industry has witnessed a transformative evolution, marked by substantial growth and technological breakthroughs over the study period (2019–2033). From 2019 to 2024, the market experienced a compound annual growth rate (CAGR) of approximately XX%, driven by the increasing integration of INS/IMU systems into a widening array of applications. The base year 2025 sees the market valued at XXX billion, with projections indicating a continued upward trajectory. Technological advancements have been central to this evolution, with the miniaturization and cost reduction of MEMS-based gyroscopes and accelerometers enabling their widespread adoption in consumer electronics, drones, and autonomous vehicles. The shift from purely inertial navigation to tightly coupled INS with other sensors, such as GNSS and lidar, has further enhanced performance and reliability, particularly for applications demanding high accuracy and robustness. Consumer demand is increasingly influenced by the desire for enhanced autonomy, precise navigation in challenging environments, and improved safety features. For instance, the automotive sector is experiencing a surge in demand for IMUs for advanced driver-assistance systems (ADAS) and autonomous driving, contributing significantly to market growth. Similarly, the defense sector's continuous need for sophisticated navigation and targeting systems fuels consistent demand. The forecast period (2025–2033) anticipates a sustained CAGR of XX%, underscoring the enduring importance of inertial sensing technologies. By 2033, the market is projected to reach an impressive XXX billion, reflecting the growing indispensability of these sophisticated sensing solutions across industries. This evolution is not merely about incremental improvements but a fundamental shift towards more intelligent, integrated, and ubiquitous inertial sensing capabilities.
Leading Regions, Countries, or Segments in Inertial Sensing IMU INS
The Integrated Navigation Systems (INS) segment stands as the dominant force within the Inertial Sensing IMU INS market, demonstrating significant traction and projected growth. This dominance is primarily fueled by the critical need for robust and reliable navigation solutions in applications where GPS reliance is insufficient or impossible. The defense industry remains a cornerstone of this segment's success, with governments worldwide investing billions in advanced INS for missile guidance, drone operations, and naval navigation. The growing sophistication of unmanned aerial vehicles (UAVs) and autonomous ground vehicles further amplifies the demand for high-performance INS.
Application: Integrated Navigation Systems (INS)
- Key Drivers:
- Defense Sector Investments: Billions invested in advanced military applications, driving demand for sophisticated INS.
- Autonomous Systems Proliferation: Increasing adoption of UAVs, autonomous vehicles, and robotics necessitates reliable INS.
- GPS-Denied Environments: Critical for operations in urban canyons, underwater, or in contested airspace.
- Enhanced Accuracy & Reliability: INS provides superior performance compared to standalone GPS.
- Dominance Factors: The inherent requirement for continuous, accurate positioning and attitude determination in high-stakes environments solidifies INS's leading position. The ability to fuse inertial data with other sensors for an even more precise navigation solution further cements its indispensability.
- Key Drivers:
Application: Inertial Measurement Units (IMU)
- Key Drivers:
- Industrial Automation: Crucial for robotic arm positioning, conveyor systems, and manufacturing process control.
- Consumer Electronics: Growing use in smartphones, VR/AR headsets, and wearable devices.
- Automotive ADAS: Essential for lane keeping, adaptive cruise control, and vehicle dynamics monitoring.
- Dominance Factors: While INS represents the complete navigation solution, IMUs are the foundational component, providing the raw inertial data. Their widespread adoption across a broader spectrum of applications, including those not requiring full INS, contributes significantly to the overall inertial sensing market value.
- Key Drivers:
Type: Gyroscopes
- Key Drivers:
- Attitude Determination: Fundamental for stabilizing platforms, cameras, and vehicles.
- Angular Velocity Measurement: Critical for controlling rotation and orientation.
- Dominance Factors: Gyroscopes are essential for measuring angular rates, a core function in both INS and IMUs. Their technological maturity and diverse applications ensure their continued prominence.
- Key Drivers:
Type: Accelerometers
- Key Drivers:
- Linear Acceleration Measurement: Vital for motion detection, impact sensing, and navigation.
- Position Integration: Used in conjunction with gyroscopes for dead reckoning.
- Dominance Factors: Accelerometers provide the linear motion data, complementing gyroscopic measurements. Their ubiquity in various sensing applications makes them a foundational element of the inertial sensing market.
- Key Drivers:
The geographical landscape sees North America and Asia Pacific leading the market, driven by substantial defense expenditures, a burgeoning aerospace industry, and rapid adoption of autonomous technologies in countries like the United States, China, and South Korea. These regions exhibit strong investment trends and supportive regulatory frameworks for advanced inertial sensing solutions, particularly within the INS segment.
Inertial Sensing IMU INS Product Innovations
Recent product innovations in Inertial Sensing IMU INS focus on enhanced accuracy, reduced size, lower power consumption, and improved resilience to environmental factors. Companies are developing next-generation MEMS gyroscopes and accelerometers with significantly lower bias drift and noise levels, enabling INS/IMU systems to maintain precision for extended periods. Furthermore, advancements in fiber-optic gyroscopes (FOG) and ring laser gyroscopes (RLG) continue to offer unparalleled accuracy for high-end applications, often integrated into hybrid INS solutions. The development of miniaturized, high-performance IMUs suitable for small satellite constellations and advanced drone platforms represents a key technological leap, offering a performance-to-size ratio previously unattainable. These innovations are crucial for expanding the application scope of inertial sensing into new frontiers.
Propelling Factors for Inertial Sensing IMU INS Growth
The Inertial Sensing IMU INS market is propelled by a confluence of powerful factors. The escalating global demand for autonomous systems, including drones, self-driving cars, and robots, necessitates precise and reliable navigation and orientation capabilities, directly driving the adoption of INS and IMUs. Technological advancements, particularly in MEMS technology, have led to smaller, more affordable, and higher-performing inertial sensors, democratizing access to these sophisticated technologies. Furthermore, the defense sector's persistent need for advanced guidance, navigation, and control (GNC) systems for military platforms remains a significant growth catalyst, supported by substantial government investments. The increasing complexity of modern warfare and the rise of unmanned combat systems ensure continued demand. Additionally, the growing emphasis on industrial automation and Industry 4.0 initiatives requires accurate spatial awareness and motion tracking, further boosting the market.
Obstacles in the Inertial Sensing IMU INS Market
Despite robust growth prospects, the Inertial Sensing IMU INS market faces several obstacles. High development costs for cutting-edge inertial sensing technology, particularly for high-precision applications, can be a significant barrier to entry for smaller companies and limit adoption in cost-sensitive markets. Stringent performance requirements and certification processes, especially in the aerospace and defense sectors, can prolong product development cycles and increase market entry timeframes. Geopolitical tensions and supply chain disruptions, as witnessed in recent years, can impact the availability of critical components and raw materials, leading to production delays and increased costs. Moreover, the continuous evolution of competing or complementary navigation technologies, such as advanced GNSS and sensor fusion algorithms, presents an ongoing challenge to maintain market leadership.
Future Opportunities in Inertial Sensing IMU INS
Emerging opportunities in the Inertial Sensing IMU INS market are abundant and diverse. The rapid expansion of the commercial space sector, with its increasing demand for satellite navigation and attitude control, presents a significant growth avenue. The burgeoning market for augmented reality (AR) and virtual reality (VR) devices relies heavily on accurate motion tracking, creating a substantial opportunity for miniaturized IMUs. The continued development and adoption of autonomous logistics and last-mile delivery robots will also drive demand for precise navigation. Furthermore, the growing need for robust indoor navigation solutions in environments like large warehouses, hospitals, and underground infrastructure, where GPS is unavailable, opens up new market segments for INS/IMU technologies. The integration of AI and machine learning with inertial sensor data holds the potential to unlock new predictive maintenance capabilities and enhanced situational awareness applications.
Major Players in the Inertial Sensing IMU INS Ecosystem
- Navgnss
- Avic-gyro
- SDI
- Norinco Group
- HY Technology
- Baocheng
- Right M&C
- Chinastar
- Chenxi
- FACRI
- StarNeto
- Others (including various specialized manufacturers and R&D entities)
Key Developments in Inertial Sensing IMU INS Industry
- 2023: Launch of a new generation of ultra-low-drift MEMS gyroscopes by a leading manufacturer, enhancing INS accuracy for extended missions.
- 2023: Major defense contractor announces successful integration of advanced INS into new unmanned combat aerial vehicle (UCAV) platform.
- 2022: Significant investment in MEMS sensor manufacturing capacity by a key player in Asia Pacific, anticipating increased demand from automotive and consumer electronics.
- 2022: Acquisition of a specialized inertial sensor startup by a large technology conglomerate, bolstering its capabilities in the AR/VR market.
- 2021: Introduction of a highly robust and radiation-hardened IMU for space applications, supporting the growth of the commercial satellite industry.
- 2020: Development of an AI-powered sensor fusion algorithm for IMUs, significantly improving navigation accuracy in challenging urban environments.
- 2019: Release of a miniaturized and cost-effective IMU module, expanding its applicability in mass-market consumer devices.
Strategic Inertial Sensing IMU INS Market Forecast
The strategic forecast for the Inertial Sensing IMU INS market remains exceptionally strong, driven by an unyielding demand for autonomous capabilities across diverse sectors. The continued advancements in MEMS technology, leading to greater accuracy, reduced size, and lower costs, will further democratize access to sophisticated inertial sensing solutions. The defense industry's sustained investment in advanced navigation and guidance systems, coupled with the burgeoning growth of commercial applications such as autonomous vehicles, drones, and robotics, are key pillars of this optimistic outlook. Emerging opportunities in space exploration, AR/VR, and indoor navigation are poised to unlock significant new market segments. By strategically focusing on innovation, addressing cost sensitivities in emerging markets, and navigating potential supply chain challenges, stakeholders can capitalize on the vast growth potential of this critical technology sector.
Inertial Sensing Imu Ins Segmentation
-
1. Application
- 1.1. Integrated Navigations Systems (INS)
- 1.2. Inertial Measurement Units (IMU)
-
2. Type
- 2.1. Gyroscopes
- 2.2. Accelerometers
- 2.3. Others
Inertial Sensing Imu Ins Segmentation By Geography
-
1. North America
- 1.1. United States
- 1.2. Canada
- 1.3. Mexico
-
2. South America
- 2.1. Brazil
- 2.2. Argentina
- 2.3. Rest of South America
-
3. Europe
- 3.1. United Kingdom
- 3.2. Germany
- 3.3. France
- 3.4. Italy
- 3.5. Spain
- 3.6. Russia
- 3.7. Benelux
- 3.8. Nordics
- 3.9. Rest of Europe
-
4. Middle East & Africa
- 4.1. Turkey
- 4.2. Israel
- 4.3. GCC
- 4.4. North Africa
- 4.5. South Africa
- 4.6. Rest of Middle East & Africa
-
5. Asia Pacific
- 5.1. China
- 5.2. India
- 5.3. Japan
- 5.4. South Korea
- 5.5. ASEAN
- 5.6. Oceania
- 5.7. Rest of Asia Pacific
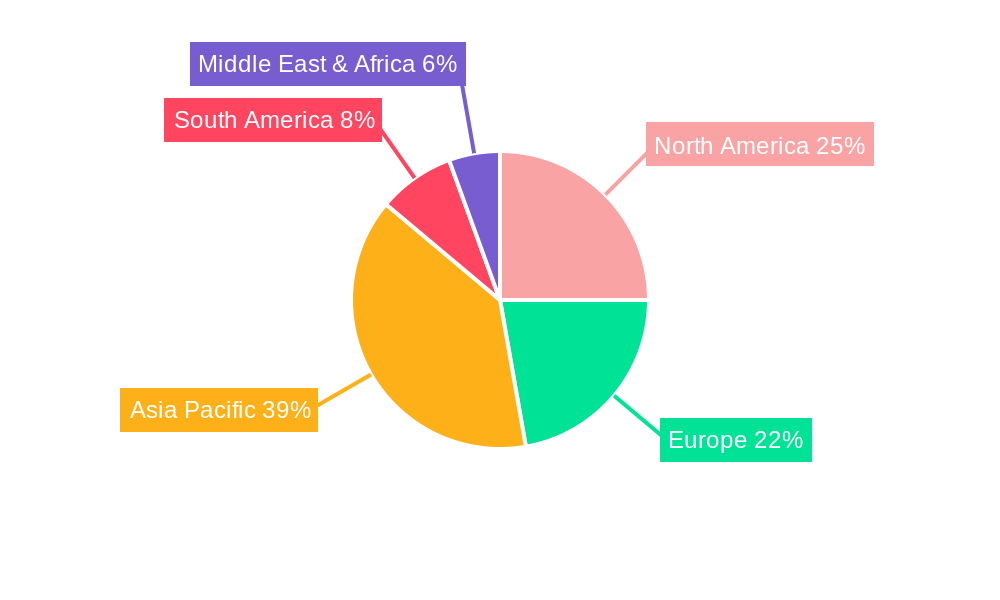
Inertial Sensing Imu Ins Regional Market Share
Geographic Coverage of Inertial Sensing Imu Ins
Inertial Sensing Imu Ins REPORT HIGHLIGHTS
| Aspects | Details |
|---|---|
| Study Period | 2020-2034 |
| Base Year | 2025 |
| Estimated Year | 2026 |
| Forecast Period | 2026-2034 |
| Historical Period | 2020-2025 |
| Growth Rate | CAGR of 13.2% from 2020-2034 |
| Segmentation |
|
Table of Contents
- 1. Introduction
- 1.1. Research Scope
- 1.2. Market Segmentation
- 1.3. Research Objective
- 1.4. Definitions and Assumptions
- 2. Executive Summary
- 2.1. Market Snapshot
- 3. Market Dynamics
- 3.1. Market Drivers
- 3.2. Market Restrains
- 3.3. Market Trends
- 3.4. Market Opportunities
- 4. Market Factor Analysis
- 4.1. Porters Five Forces
- 4.1.1. Bargaining Power of Suppliers
- 4.1.2. Bargaining Power of Buyers
- 4.1.3. Threat of New Entrants
- 4.1.4. Threat of Substitutes
- 4.1.5. Competitive Rivalry
- 4.2. PESTEL analysis
- 4.3. BCG Analysis
- 4.3.1. Stars (High Growth, High Market Share)
- 4.3.2. Cash Cows (Low Growth, High Market Share)
- 4.3.3. Question Mark (High Growth, Low Market Share)
- 4.3.4. Dogs (Low Growth, Low Market Share)
- 4.4. Ansoff Matrix Analysis
- 4.5. Supply Chain Analysis
- 4.6. Regulatory Landscape
- 4.7. Current Market Potential and Opportunity Assessment (TAM–SAM–SOM Framework)
- 4.8. DMV Analyst Note
- 4.1. Porters Five Forces
- 5. Market Analysis, Insights and Forecast 2021-2033
- 5.1. Market Analysis, Insights and Forecast - by Application
- 5.1.1. Integrated Navigations Systems (INS)
- 5.1.2. Inertial Measurement Units (IMU)
- 5.2. Market Analysis, Insights and Forecast - by Type
- 5.2.1. Gyroscopes
- 5.2.2. Accelerometers
- 5.2.3. Others
- 5.3. Market Analysis, Insights and Forecast - by Region
- 5.3.1. North America
- 5.3.2. South America
- 5.3.3. Europe
- 5.3.4. Middle East & Africa
- 5.3.5. Asia Pacific
- 5.1. Market Analysis, Insights and Forecast - by Application
- 6. Global Inertial Sensing Imu Ins Analysis, Insights and Forecast, 2021-2033
- 6.1. Market Analysis, Insights and Forecast - by Application
- 6.1.1. Integrated Navigations Systems (INS)
- 6.1.2. Inertial Measurement Units (IMU)
- 6.2. Market Analysis, Insights and Forecast - by Type
- 6.2.1. Gyroscopes
- 6.2.2. Accelerometers
- 6.2.3. Others
- 6.1. Market Analysis, Insights and Forecast - by Application
- 7. North America Inertial Sensing Imu Ins Analysis, Insights and Forecast, 2020-2032
- 7.1. Market Analysis, Insights and Forecast - by Application
- 7.1.1. Integrated Navigations Systems (INS)
- 7.1.2. Inertial Measurement Units (IMU)
- 7.2. Market Analysis, Insights and Forecast - by Type
- 7.2.1. Gyroscopes
- 7.2.2. Accelerometers
- 7.2.3. Others
- 7.1. Market Analysis, Insights and Forecast - by Application
- 8. South America Inertial Sensing Imu Ins Analysis, Insights and Forecast, 2020-2032
- 8.1. Market Analysis, Insights and Forecast - by Application
- 8.1.1. Integrated Navigations Systems (INS)
- 8.1.2. Inertial Measurement Units (IMU)
- 8.2. Market Analysis, Insights and Forecast - by Type
- 8.2.1. Gyroscopes
- 8.2.2. Accelerometers
- 8.2.3. Others
- 8.1. Market Analysis, Insights and Forecast - by Application
- 9. Europe Inertial Sensing Imu Ins Analysis, Insights and Forecast, 2020-2032
- 9.1. Market Analysis, Insights and Forecast - by Application
- 9.1.1. Integrated Navigations Systems (INS)
- 9.1.2. Inertial Measurement Units (IMU)
- 9.2. Market Analysis, Insights and Forecast - by Type
- 9.2.1. Gyroscopes
- 9.2.2. Accelerometers
- 9.2.3. Others
- 9.1. Market Analysis, Insights and Forecast - by Application
- 10. Middle East & Africa Inertial Sensing Imu Ins Analysis, Insights and Forecast, 2020-2032
- 10.1. Market Analysis, Insights and Forecast - by Application
- 10.1.1. Integrated Navigations Systems (INS)
- 10.1.2. Inertial Measurement Units (IMU)
- 10.2. Market Analysis, Insights and Forecast - by Type
- 10.2.1. Gyroscopes
- 10.2.2. Accelerometers
- 10.2.3. Others
- 10.1. Market Analysis, Insights and Forecast - by Application
- 11. Asia Pacific Inertial Sensing Imu Ins Analysis, Insights and Forecast, 2020-2032
- 11.1. Market Analysis, Insights and Forecast - by Application
- 11.1.1. Integrated Navigations Systems (INS)
- 11.1.2. Inertial Measurement Units (IMU)
- 11.2. Market Analysis, Insights and Forecast - by Type
- 11.2.1. Gyroscopes
- 11.2.2. Accelerometers
- 11.2.3. Others
- 11.1. Market Analysis, Insights and Forecast - by Application
- 12. Competitive Analysis
- 12.1. Company Profiles
- 12.1.1 Navgnss
- 12.1.1.1. Company Overview
- 12.1.1.2. Products
- 12.1.1.3. Company Financials
- 12.1.1.4. SWOT Analysis
- 12.1.2 Avic-gyro
- 12.1.2.1. Company Overview
- 12.1.2.2. Products
- 12.1.2.3. Company Financials
- 12.1.2.4. SWOT Analysis
- 12.1.3 SDI
- 12.1.3.1. Company Overview
- 12.1.3.2. Products
- 12.1.3.3. Company Financials
- 12.1.3.4. SWOT Analysis
- 12.1.4 Norinco Group
- 12.1.4.1. Company Overview
- 12.1.4.2. Products
- 12.1.4.3. Company Financials
- 12.1.4.4. SWOT Analysis
- 12.1.5 HY Technology
- 12.1.5.1. Company Overview
- 12.1.5.2. Products
- 12.1.5.3. Company Financials
- 12.1.5.4. SWOT Analysis
- 12.1.6 Baocheng
- 12.1.6.1. Company Overview
- 12.1.6.2. Products
- 12.1.6.3. Company Financials
- 12.1.6.4. SWOT Analysis
- 12.1.7 Right M&C
- 12.1.7.1. Company Overview
- 12.1.7.2. Products
- 12.1.7.3. Company Financials
- 12.1.7.4. SWOT Analysis
- 12.1.8 Chinastar
- 12.1.8.1. Company Overview
- 12.1.8.2. Products
- 12.1.8.3. Company Financials
- 12.1.8.4. SWOT Analysis
- 12.1.9 Chenxi
- 12.1.9.1. Company Overview
- 12.1.9.2. Products
- 12.1.9.3. Company Financials
- 12.1.9.4. SWOT Analysis
- 12.1.10 FACRI
- 12.1.10.1. Company Overview
- 12.1.10.2. Products
- 12.1.10.3. Company Financials
- 12.1.10.4. SWOT Analysis
- 12.1.11 StarNeto
- 12.1.11.1. Company Overview
- 12.1.11.2. Products
- 12.1.11.3. Company Financials
- 12.1.11.4. SWOT Analysis
- 12.1.1 Navgnss
- 12.2. Market Entropy
- 12.2.1 Company's Key Areas Served
- 12.2.2 Recent Developments
- 12.3. Company Market Share Analysis 2025
- 12.3.1 Top 5 Companies Market Share Analysis
- 12.3.2 Top 3 Companies Market Share Analysis
- 12.4. List of Potential Customers
- 13. Research Methodology
List of Figures
- Figure 1: Global Inertial Sensing Imu Ins Revenue Breakdown (undefined, %) by Region 2025 & 2033
- Figure 2: Global Inertial Sensing Imu Ins Volume Breakdown (K, %) by Region 2025 & 2033
- Figure 3: North America Inertial Sensing Imu Ins Revenue (undefined), by Application 2025 & 2033
- Figure 4: North America Inertial Sensing Imu Ins Volume (K), by Application 2025 & 2033
- Figure 5: North America Inertial Sensing Imu Ins Revenue Share (%), by Application 2025 & 2033
- Figure 6: North America Inertial Sensing Imu Ins Volume Share (%), by Application 2025 & 2033
- Figure 7: North America Inertial Sensing Imu Ins Revenue (undefined), by Type 2025 & 2033
- Figure 8: North America Inertial Sensing Imu Ins Volume (K), by Type 2025 & 2033
- Figure 9: North America Inertial Sensing Imu Ins Revenue Share (%), by Type 2025 & 2033
- Figure 10: North America Inertial Sensing Imu Ins Volume Share (%), by Type 2025 & 2033
- Figure 11: North America Inertial Sensing Imu Ins Revenue (undefined), by Country 2025 & 2033
- Figure 12: North America Inertial Sensing Imu Ins Volume (K), by Country 2025 & 2033
- Figure 13: North America Inertial Sensing Imu Ins Revenue Share (%), by Country 2025 & 2033
- Figure 14: North America Inertial Sensing Imu Ins Volume Share (%), by Country 2025 & 2033
- Figure 15: South America Inertial Sensing Imu Ins Revenue (undefined), by Application 2025 & 2033
- Figure 16: South America Inertial Sensing Imu Ins Volume (K), by Application 2025 & 2033
- Figure 17: South America Inertial Sensing Imu Ins Revenue Share (%), by Application 2025 & 2033
- Figure 18: South America Inertial Sensing Imu Ins Volume Share (%), by Application 2025 & 2033
- Figure 19: South America Inertial Sensing Imu Ins Revenue (undefined), by Type 2025 & 2033
- Figure 20: South America Inertial Sensing Imu Ins Volume (K), by Type 2025 & 2033
- Figure 21: South America Inertial Sensing Imu Ins Revenue Share (%), by Type 2025 & 2033
- Figure 22: South America Inertial Sensing Imu Ins Volume Share (%), by Type 2025 & 2033
- Figure 23: South America Inertial Sensing Imu Ins Revenue (undefined), by Country 2025 & 2033
- Figure 24: South America Inertial Sensing Imu Ins Volume (K), by Country 2025 & 2033
- Figure 25: South America Inertial Sensing Imu Ins Revenue Share (%), by Country 2025 & 2033
- Figure 26: South America Inertial Sensing Imu Ins Volume Share (%), by Country 2025 & 2033
- Figure 27: Europe Inertial Sensing Imu Ins Revenue (undefined), by Application 2025 & 2033
- Figure 28: Europe Inertial Sensing Imu Ins Volume (K), by Application 2025 & 2033
- Figure 29: Europe Inertial Sensing Imu Ins Revenue Share (%), by Application 2025 & 2033
- Figure 30: Europe Inertial Sensing Imu Ins Volume Share (%), by Application 2025 & 2033
- Figure 31: Europe Inertial Sensing Imu Ins Revenue (undefined), by Type 2025 & 2033
- Figure 32: Europe Inertial Sensing Imu Ins Volume (K), by Type 2025 & 2033
- Figure 33: Europe Inertial Sensing Imu Ins Revenue Share (%), by Type 2025 & 2033
- Figure 34: Europe Inertial Sensing Imu Ins Volume Share (%), by Type 2025 & 2033
- Figure 35: Europe Inertial Sensing Imu Ins Revenue (undefined), by Country 2025 & 2033
- Figure 36: Europe Inertial Sensing Imu Ins Volume (K), by Country 2025 & 2033
- Figure 37: Europe Inertial Sensing Imu Ins Revenue Share (%), by Country 2025 & 2033
- Figure 38: Europe Inertial Sensing Imu Ins Volume Share (%), by Country 2025 & 2033
- Figure 39: Middle East & Africa Inertial Sensing Imu Ins Revenue (undefined), by Application 2025 & 2033
- Figure 40: Middle East & Africa Inertial Sensing Imu Ins Volume (K), by Application 2025 & 2033
- Figure 41: Middle East & Africa Inertial Sensing Imu Ins Revenue Share (%), by Application 2025 & 2033
- Figure 42: Middle East & Africa Inertial Sensing Imu Ins Volume Share (%), by Application 2025 & 2033
- Figure 43: Middle East & Africa Inertial Sensing Imu Ins Revenue (undefined), by Type 2025 & 2033
- Figure 44: Middle East & Africa Inertial Sensing Imu Ins Volume (K), by Type 2025 & 2033
- Figure 45: Middle East & Africa Inertial Sensing Imu Ins Revenue Share (%), by Type 2025 & 2033
- Figure 46: Middle East & Africa Inertial Sensing Imu Ins Volume Share (%), by Type 2025 & 2033
- Figure 47: Middle East & Africa Inertial Sensing Imu Ins Revenue (undefined), by Country 2025 & 2033
- Figure 48: Middle East & Africa Inertial Sensing Imu Ins Volume (K), by Country 2025 & 2033
- Figure 49: Middle East & Africa Inertial Sensing Imu Ins Revenue Share (%), by Country 2025 & 2033
- Figure 50: Middle East & Africa Inertial Sensing Imu Ins Volume Share (%), by Country 2025 & 2033
- Figure 51: Asia Pacific Inertial Sensing Imu Ins Revenue (undefined), by Application 2025 & 2033
- Figure 52: Asia Pacific Inertial Sensing Imu Ins Volume (K), by Application 2025 & 2033
- Figure 53: Asia Pacific Inertial Sensing Imu Ins Revenue Share (%), by Application 2025 & 2033
- Figure 54: Asia Pacific Inertial Sensing Imu Ins Volume Share (%), by Application 2025 & 2033
- Figure 55: Asia Pacific Inertial Sensing Imu Ins Revenue (undefined), by Type 2025 & 2033
- Figure 56: Asia Pacific Inertial Sensing Imu Ins Volume (K), by Type 2025 & 2033
- Figure 57: Asia Pacific Inertial Sensing Imu Ins Revenue Share (%), by Type 2025 & 2033
- Figure 58: Asia Pacific Inertial Sensing Imu Ins Volume Share (%), by Type 2025 & 2033
- Figure 59: Asia Pacific Inertial Sensing Imu Ins Revenue (undefined), by Country 2025 & 2033
- Figure 60: Asia Pacific Inertial Sensing Imu Ins Volume (K), by Country 2025 & 2033
- Figure 61: Asia Pacific Inertial Sensing Imu Ins Revenue Share (%), by Country 2025 & 2033
- Figure 62: Asia Pacific Inertial Sensing Imu Ins Volume Share (%), by Country 2025 & 2033
List of Tables
- Table 1: Global Inertial Sensing Imu Ins Revenue undefined Forecast, by Application 2020 & 2033
- Table 2: Global Inertial Sensing Imu Ins Volume K Forecast, by Application 2020 & 2033
- Table 3: Global Inertial Sensing Imu Ins Revenue undefined Forecast, by Type 2020 & 2033
- Table 4: Global Inertial Sensing Imu Ins Volume K Forecast, by Type 2020 & 2033
- Table 5: Global Inertial Sensing Imu Ins Revenue undefined Forecast, by Region 2020 & 2033
- Table 6: Global Inertial Sensing Imu Ins Volume K Forecast, by Region 2020 & 2033
- Table 7: Global Inertial Sensing Imu Ins Revenue undefined Forecast, by Application 2020 & 2033
- Table 8: Global Inertial Sensing Imu Ins Volume K Forecast, by Application 2020 & 2033
- Table 9: Global Inertial Sensing Imu Ins Revenue undefined Forecast, by Type 2020 & 2033
- Table 10: Global Inertial Sensing Imu Ins Volume K Forecast, by Type 2020 & 2033
- Table 11: Global Inertial Sensing Imu Ins Revenue undefined Forecast, by Country 2020 & 2033
- Table 12: Global Inertial Sensing Imu Ins Volume K Forecast, by Country 2020 & 2033
- Table 13: United States Inertial Sensing Imu Ins Revenue (undefined) Forecast, by Application 2020 & 2033
- Table 14: United States Inertial Sensing Imu Ins Volume (K) Forecast, by Application 2020 & 2033
- Table 15: Canada Inertial Sensing Imu Ins Revenue (undefined) Forecast, by Application 2020 & 2033
- Table 16: Canada Inertial Sensing Imu Ins Volume (K) Forecast, by Application 2020 & 2033
- Table 17: Mexico Inertial Sensing Imu Ins Revenue (undefined) Forecast, by Application 2020 & 2033
- Table 18: Mexico Inertial Sensing Imu Ins Volume (K) Forecast, by Application 2020 & 2033
- Table 19: Global Inertial Sensing Imu Ins Revenue undefined Forecast, by Application 2020 & 2033
- Table 20: Global Inertial Sensing Imu Ins Volume K Forecast, by Application 2020 & 2033
- Table 21: Global Inertial Sensing Imu Ins Revenue undefined Forecast, by Type 2020 & 2033
- Table 22: Global Inertial Sensing Imu Ins Volume K Forecast, by Type 2020 & 2033
- Table 23: Global Inertial Sensing Imu Ins Revenue undefined Forecast, by Country 2020 & 2033
- Table 24: Global Inertial Sensing Imu Ins Volume K Forecast, by Country 2020 & 2033
- Table 25: Brazil Inertial Sensing Imu Ins Revenue (undefined) Forecast, by Application 2020 & 2033
- Table 26: Brazil Inertial Sensing Imu Ins Volume (K) Forecast, by Application 2020 & 2033
- Table 27: Argentina Inertial Sensing Imu Ins Revenue (undefined) Forecast, by Application 2020 & 2033
- Table 28: Argentina Inertial Sensing Imu Ins Volume (K) Forecast, by Application 2020 & 2033
- Table 29: Rest of South America Inertial Sensing Imu Ins Revenue (undefined) Forecast, by Application 2020 & 2033
- Table 30: Rest of South America Inertial Sensing Imu Ins Volume (K) Forecast, by Application 2020 & 2033
- Table 31: Global Inertial Sensing Imu Ins Revenue undefined Forecast, by Application 2020 & 2033
- Table 32: Global Inertial Sensing Imu Ins Volume K Forecast, by Application 2020 & 2033
- Table 33: Global Inertial Sensing Imu Ins Revenue undefined Forecast, by Type 2020 & 2033
- Table 34: Global Inertial Sensing Imu Ins Volume K Forecast, by Type 2020 & 2033
- Table 35: Global Inertial Sensing Imu Ins Revenue undefined Forecast, by Country 2020 & 2033
- Table 36: Global Inertial Sensing Imu Ins Volume K Forecast, by Country 2020 & 2033
- Table 37: United Kingdom Inertial Sensing Imu Ins Revenue (undefined) Forecast, by Application 2020 & 2033
- Table 38: United Kingdom Inertial Sensing Imu Ins Volume (K) Forecast, by Application 2020 & 2033
- Table 39: Germany Inertial Sensing Imu Ins Revenue (undefined) Forecast, by Application 2020 & 2033
- Table 40: Germany Inertial Sensing Imu Ins Volume (K) Forecast, by Application 2020 & 2033
- Table 41: France Inertial Sensing Imu Ins Revenue (undefined) Forecast, by Application 2020 & 2033
- Table 42: France Inertial Sensing Imu Ins Volume (K) Forecast, by Application 2020 & 2033
- Table 43: Italy Inertial Sensing Imu Ins Revenue (undefined) Forecast, by Application 2020 & 2033
- Table 44: Italy Inertial Sensing Imu Ins Volume (K) Forecast, by Application 2020 & 2033
- Table 45: Spain Inertial Sensing Imu Ins Revenue (undefined) Forecast, by Application 2020 & 2033
- Table 46: Spain Inertial Sensing Imu Ins Volume (K) Forecast, by Application 2020 & 2033
- Table 47: Russia Inertial Sensing Imu Ins Revenue (undefined) Forecast, by Application 2020 & 2033
- Table 48: Russia Inertial Sensing Imu Ins Volume (K) Forecast, by Application 2020 & 2033
- Table 49: Benelux Inertial Sensing Imu Ins Revenue (undefined) Forecast, by Application 2020 & 2033
- Table 50: Benelux Inertial Sensing Imu Ins Volume (K) Forecast, by Application 2020 & 2033
- Table 51: Nordics Inertial Sensing Imu Ins Revenue (undefined) Forecast, by Application 2020 & 2033
- Table 52: Nordics Inertial Sensing Imu Ins Volume (K) Forecast, by Application 2020 & 2033
- Table 53: Rest of Europe Inertial Sensing Imu Ins Revenue (undefined) Forecast, by Application 2020 & 2033
- Table 54: Rest of Europe Inertial Sensing Imu Ins Volume (K) Forecast, by Application 2020 & 2033
- Table 55: Global Inertial Sensing Imu Ins Revenue undefined Forecast, by Application 2020 & 2033
- Table 56: Global Inertial Sensing Imu Ins Volume K Forecast, by Application 2020 & 2033
- Table 57: Global Inertial Sensing Imu Ins Revenue undefined Forecast, by Type 2020 & 2033
- Table 58: Global Inertial Sensing Imu Ins Volume K Forecast, by Type 2020 & 2033
- Table 59: Global Inertial Sensing Imu Ins Revenue undefined Forecast, by Country 2020 & 2033
- Table 60: Global Inertial Sensing Imu Ins Volume K Forecast, by Country 2020 & 2033
- Table 61: Turkey Inertial Sensing Imu Ins Revenue (undefined) Forecast, by Application 2020 & 2033
- Table 62: Turkey Inertial Sensing Imu Ins Volume (K) Forecast, by Application 2020 & 2033
- Table 63: Israel Inertial Sensing Imu Ins Revenue (undefined) Forecast, by Application 2020 & 2033
- Table 64: Israel Inertial Sensing Imu Ins Volume (K) Forecast, by Application 2020 & 2033
- Table 65: GCC Inertial Sensing Imu Ins Revenue (undefined) Forecast, by Application 2020 & 2033
- Table 66: GCC Inertial Sensing Imu Ins Volume (K) Forecast, by Application 2020 & 2033
- Table 67: North Africa Inertial Sensing Imu Ins Revenue (undefined) Forecast, by Application 2020 & 2033
- Table 68: North Africa Inertial Sensing Imu Ins Volume (K) Forecast, by Application 2020 & 2033
- Table 69: South Africa Inertial Sensing Imu Ins Revenue (undefined) Forecast, by Application 2020 & 2033
- Table 70: South Africa Inertial Sensing Imu Ins Volume (K) Forecast, by Application 2020 & 2033
- Table 71: Rest of Middle East & Africa Inertial Sensing Imu Ins Revenue (undefined) Forecast, by Application 2020 & 2033
- Table 72: Rest of Middle East & Africa Inertial Sensing Imu Ins Volume (K) Forecast, by Application 2020 & 2033
- Table 73: Global Inertial Sensing Imu Ins Revenue undefined Forecast, by Application 2020 & 2033
- Table 74: Global Inertial Sensing Imu Ins Volume K Forecast, by Application 2020 & 2033
- Table 75: Global Inertial Sensing Imu Ins Revenue undefined Forecast, by Type 2020 & 2033
- Table 76: Global Inertial Sensing Imu Ins Volume K Forecast, by Type 2020 & 2033
- Table 77: Global Inertial Sensing Imu Ins Revenue undefined Forecast, by Country 2020 & 2033
- Table 78: Global Inertial Sensing Imu Ins Volume K Forecast, by Country 2020 & 2033
- Table 79: China Inertial Sensing Imu Ins Revenue (undefined) Forecast, by Application 2020 & 2033
- Table 80: China Inertial Sensing Imu Ins Volume (K) Forecast, by Application 2020 & 2033
- Table 81: India Inertial Sensing Imu Ins Revenue (undefined) Forecast, by Application 2020 & 2033
- Table 82: India Inertial Sensing Imu Ins Volume (K) Forecast, by Application 2020 & 2033
- Table 83: Japan Inertial Sensing Imu Ins Revenue (undefined) Forecast, by Application 2020 & 2033
- Table 84: Japan Inertial Sensing Imu Ins Volume (K) Forecast, by Application 2020 & 2033
- Table 85: South Korea Inertial Sensing Imu Ins Revenue (undefined) Forecast, by Application 2020 & 2033
- Table 86: South Korea Inertial Sensing Imu Ins Volume (K) Forecast, by Application 2020 & 2033
- Table 87: ASEAN Inertial Sensing Imu Ins Revenue (undefined) Forecast, by Application 2020 & 2033
- Table 88: ASEAN Inertial Sensing Imu Ins Volume (K) Forecast, by Application 2020 & 2033
- Table 89: Oceania Inertial Sensing Imu Ins Revenue (undefined) Forecast, by Application 2020 & 2033
- Table 90: Oceania Inertial Sensing Imu Ins Volume (K) Forecast, by Application 2020 & 2033
- Table 91: Rest of Asia Pacific Inertial Sensing Imu Ins Revenue (undefined) Forecast, by Application 2020 & 2033
- Table 92: Rest of Asia Pacific Inertial Sensing Imu Ins Volume (K) Forecast, by Application 2020 & 2033
Frequently Asked Questions
1. What is the projected Compound Annual Growth Rate (CAGR) of the Inertial Sensing Imu Ins?
The projected CAGR is approximately 13.2%.
2. Which companies are prominent players in the Inertial Sensing Imu Ins?
Key companies in the market include Navgnss, Avic-gyro, SDI, Norinco Group, HY Technology, Baocheng, Right M&C, Chinastar, Chenxi, FACRI, StarNeto.
3. What are the main segments of the Inertial Sensing Imu Ins?
The market segments include Application, Type.
4. Can you provide details about the market size?
The market size is estimated to be USD XXX N/A as of 2022.
5. What are some drivers contributing to market growth?
N/A
6. What are the notable trends driving market growth?
N/A
7. Are there any restraints impacting market growth?
N/A
8. Can you provide examples of recent developments in the market?
N/A
9. What pricing options are available for accessing the report?
Pricing options include single-user, multi-user, and enterprise licenses priced at USD 3950.00, USD 5925.00, and USD 7900.00 respectively.
10. Is the market size provided in terms of value or volume?
The market size is provided in terms of value, measured in N/A and volume, measured in K.
11. Are there any specific market keywords associated with the report?
Yes, the market keyword associated with the report is "Inertial Sensing Imu Ins," which aids in identifying and referencing the specific market segment covered.
12. How do I determine which pricing option suits my needs best?
The pricing options vary based on user requirements and access needs. Individual users may opt for single-user licenses, while businesses requiring broader access may choose multi-user or enterprise licenses for cost-effective access to the report.
13. Are there any additional resources or data provided in the Inertial Sensing Imu Ins report?
While the report offers comprehensive insights, it's advisable to review the specific contents or supplementary materials provided to ascertain if additional resources or data are available.
14. How can I stay updated on further developments or reports in the Inertial Sensing Imu Ins?
To stay informed about further developments, trends, and reports in the Inertial Sensing Imu Ins, consider subscribing to industry newsletters, following relevant companies and organizations, or regularly checking reputable industry news sources and publications.
Methodology
Step 1 - Identification of Relevant Samples Size from Population Database


Step 2 - Approaches for Defining Global Market Size (Value, Volume* & Price*)

Note*: In applicable scenarios
Step 3 - Data Sources
Primary Research
- Web Analytics
- Survey Reports
- Research Institute
- Latest Research Reports
- Opinion Leaders
Secondary Research
- Annual Reports
- White Paper
- Latest Press Release
- Industry Association
- Paid Database
- Investor Presentations

Step 4 - Data Triangulation
Involves using different sources of information in order to increase the validity of a study
These sources are likely to be stakeholders in a program - participants, other researchers, program staff, other community members, and so on.
Then we put all data in single framework & apply various statistical tools to find out the dynamic on the market.
During the analysis stage, feedback from the stakeholder groups would be compared to determine areas of agreement as well as areas of divergence