

Key Insights
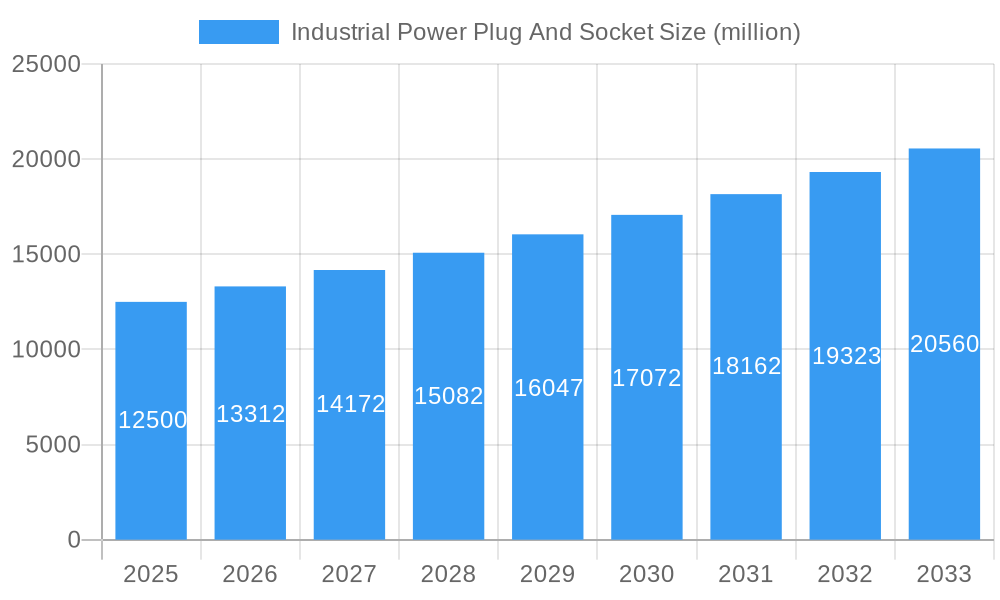
The global Industrial Power Plug and Socket market is poised for robust expansion, projected to reach an estimated market size of approximately USD 12,500 million by 2025. This growth is driven by a significant Compound Annual Growth Rate (CAGR) of around 6.5% throughout the forecast period of 2025-2033, indicating a sustained and healthy upward trajectory. The market's dynamism is fueled by the accelerating adoption of industrial automation across various sectors, including automotive electronics, home appliances, consumer electronics, and the burgeoning new energy industry. Increased investment in upgrading electrical infrastructure and the growing demand for reliable and safe power connectivity solutions in critical applications are also key catalysts. Furthermore, the expansion of manufacturing capabilities and the increasing complexity of industrial machinery necessitate advanced plug and socket solutions that can withstand harsh environments and high power demands.
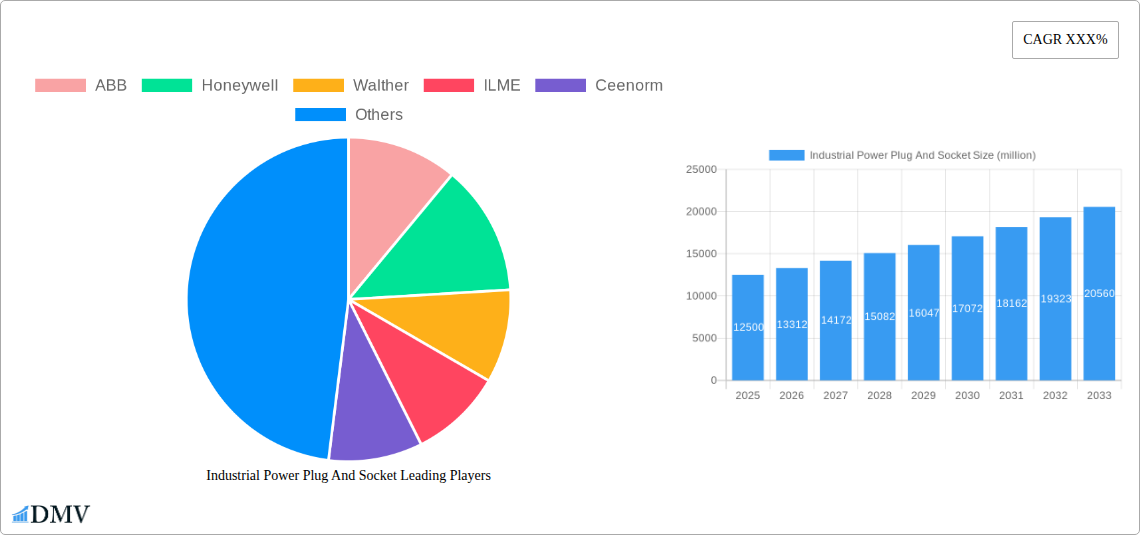
Industrial Power Plug And Socket Market Size (In Billion)
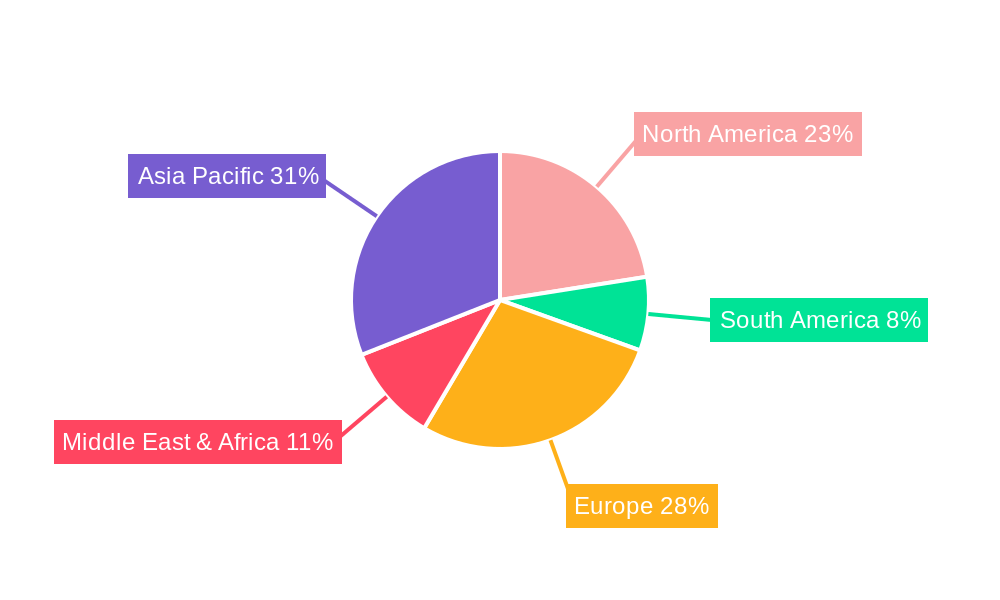
The market segmentation reveals a diverse landscape, with the "Above 500V" category expected to witness substantial growth due to the increasing power requirements of heavy industries and renewable energy installations. Conversely, the "Below 100V" and "100V-500V" segments will continue to cater to a broad range of applications in electronics and automation. Geographically, Asia Pacific, led by China and India, is anticipated to emerge as the dominant region, driven by rapid industrialization, significant manufacturing output, and substantial government initiatives promoting technological advancement. Europe and North America will remain significant markets, characterized by a strong focus on technological innovation, stringent safety standards, and the replacement of aging infrastructure. However, potential supply chain disruptions, volatile raw material prices, and the increasing competition from low-cost manufacturers could pose challenges to market growth. Key players such as ABB, Honeywell, and Phoenix Contact are actively investing in research and development to introduce innovative, high-performance, and sustainable plug and socket solutions, further shaping the competitive landscape.
Industrial Power Plug And Socket Company Market Share
Comprehensive Analysis of the Industrial Power Plug And Socket Market: 2019-2033
Dive deep into the robust and evolving Industrial Power Plug And Socket market with this definitive report. Covering the historical period from 2019 to 2024, a base and estimated year of 2025, and a forward-looking forecast period extending to 2033, this analysis provides unparalleled insights for stakeholders. We meticulously examine market composition, industry evolution, regional dominance, product innovations, growth drivers, obstacles, future opportunities, and the strategic landscape of key players. Essential for anyone navigating the complexities of electrical connectivity solutions, this report leverages high-ranking keywords to ensure maximum visibility and relevance.
Industrial Power Plug And Socket Market Composition & Trends
The global Industrial Power Plug And Socket market exhibits a moderate to high concentration, driven by established players and the necessity of stringent safety and performance standards. Innovation catalysts are primarily focused on enhancing durability, safety features (e.g., IP ratings, explosion-proof designs), and integration with smart grid technologies. The regulatory landscape plays a pivotal role, with organizations like UL, CE, and IEC setting benchmarks that dictate product design and market entry. Substitute products, while present in lower-power or niche applications, are generally outmatched in the industrial sphere by the reliability and robust construction of specialized plugs and sockets. End-user profiles span a wide spectrum, from heavy manufacturing to advanced electronics, each with distinct power and environmental requirements. Mergers and acquisitions (M&A) activity is strategically aimed at expanding product portfolios, gaining market share in high-growth segments, and acquiring innovative technologies. For instance, M&A deal values in the industrial components sector have reached hundreds of millions of dollars, signaling a consolidation trend.
- Market Share Distribution: Leading companies command significant portions of the market, with the top 5-7 players holding an estimated 60-70% of the global market revenue.
- Innovation Focus: Emphasis on high-temperature resistance, corrosion-proof materials, and compact designs for space-constrained applications.
- Regulatory Impact: Compliance with international standards is non-negotiable, driving R&D investments in certifications and safety enhancements.
- End-User Demands: Growing requirement for quick-connect solutions, high-density power delivery, and seamless integration into automated systems.
- M&A Drivers: Strategic acquisitions aimed at vertical integration, market expansion into emerging economies, and diversification of product offerings.
Industrial Power Plug And Socket Industry Evolution
The Industrial Power Plug And Socket industry has witnessed a dynamic evolution, marked by consistent market growth trajectories and significant technological advancements. Over the historical period (2019-2024), the market experienced a compound annual growth rate (CAGR) of approximately 4.5%, fueled by robust industrialization across emerging economies and the increasing demand for electrification in various sectors. The base year of 2025 sees the market valued in the billions of dollars, with a projected steady upward trend. This growth is intrinsically linked to the relentless pace of technological innovation. Early in the historical period, focus was on enhancing basic electrical conductivity and mechanical resilience. However, advancements have rapidly shifted towards incorporating sophisticated features. We are observing a significant increase in the adoption of high-performance materials such as advanced polymers and alloys, leading to enhanced thermal management and improved resistance to harsh environmental conditions, including extreme temperatures and chemical exposure.
Furthermore, the advent of Industry 4.0 and the Internet of Things (IoT) has profoundly impacted the product roadmap. Smart plugs and sockets, equipped with integrated sensors for monitoring power consumption, temperature, and even predictive maintenance capabilities, are gaining traction. These intelligent solutions enable real-time data acquisition, facilitating optimized energy usage and proactive issue resolution within industrial settings. The adoption rate of these smart solutions, while still in its nascent stages for the broader industrial market, is projected to accelerate significantly over the forecast period, driven by their potential to reduce operational costs and improve overall system efficiency.
Shifting consumer demands, particularly in the context of industrial applications, also play a crucial role. There's a discernible trend towards modular and customizable solutions, allowing end-users to configure plug and socket systems tailored to their specific operational needs. This demand for flexibility is pushing manufacturers to develop standardized interfaces and innovative connection mechanisms that simplify installation, maintenance, and future upgrades. The emphasis on safety and reliability remains paramount, leading to continuous improvements in insulation, grounding, and arc suppression technologies, ensuring compliance with increasingly stringent international safety regulations. The overall market growth is not merely about increased unit sales but also about the rising value proposition of these technologically advanced and highly reliable connectivity solutions, reflecting a shift towards more sophisticated and integrated electrical infrastructure. The market is poised for continued expansion as these technological advancements and evolving demands are met.
Leading Regions, Countries, or Segments in Industrial Power Plug And Socket
The Industrial Power Plug And Socket market's dominance is a complex interplay of regional industrial strength, regulatory frameworks, and specific segment demands. Currently, Asia-Pacific stands out as the leading region, driven by its manufacturing prowess and rapid industrialization. Countries like China, India, and South Korea are pivotal, boasting substantial investments in sectors that heavily rely on robust power connectivity, including the Automation Control Industry and the burgeoning New Energy Industry. The sheer scale of manufacturing operations in this region necessitates vast quantities of reliable industrial power plugs and sockets, particularly those falling within the 100V-500V and Above 500V categories to support heavy machinery and complex industrial processes.
Within the application segments, the Automation Control Industry is a significant driver of growth. The increasing adoption of automated systems in factories, warehousing, and logistics requires a constant supply of specialized plugs and sockets that ensure seamless power delivery to robots, programmable logic controllers (PLCs), and other automated equipment. Similarly, the New Energy Industry, encompassing renewable energy infrastructure like solar farms and wind turbines, as well as electric vehicle charging stations, presents a substantial and growing demand for high-voltage, high-current industrial power connectors designed for demanding outdoor and operational environments.
The Automotive Electronics segment is also a notable contributor, with the electrification of vehicles and the sophisticated electronic systems within them requiring specialized, high-reliability connectors. While Home Appliances and Consumer Electronics also utilize power connectors, their requirements are generally less demanding in terms of voltage and environmental resilience compared to core industrial applications.
In terms of voltage types, the 100V-500V range is the most dominant due to its widespread application across diverse industrial machinery and infrastructure. However, the Above 500V segment is experiencing accelerated growth, particularly driven by the expansion of power grids, heavy industrial machinery, and large-scale renewable energy projects. The Below 100V segment caters to lower-power industrial automation and control systems, as well as specific electronics applications.
- Key Drivers in Asia-Pacific:
- Massive manufacturing base and ongoing industrial expansion.
- Significant government initiatives supporting domestic manufacturing and infrastructure development.
- Increasing adoption of automation and smart factory technologies.
- Rapid growth of the new energy sector, including EV charging infrastructure.
- Dominance of Automation Control Industry:
- High demand for reliable and robust connectors for continuous operation.
- Need for specialized connectors with safety features and high mating cycles.
- Integration with advanced control systems and robotic applications.
- Growth in New Energy Industry:
- Requirement for high-voltage and high-current capacity connectors.
- Demand for weather-resistant and corrosion-proof solutions for outdoor installations.
- Expansion of electric vehicle charging networks globally.
- Voltage Type Trends:
- 100V-500V: Broadest application across general industrial machinery and equipment.
- Above 500V: Rapid growth fueled by power infrastructure, heavy industry, and large-scale energy projects.
- Below 100V: Essential for low-voltage control systems, electronics, and specialized instrumentation.
Industrial Power Plug And Socket Product Innovations
Product innovation in the industrial power plug and socket market is heavily geared towards enhancing safety, durability, and operational efficiency. Recent advancements include the development of advanced interlocking mechanisms that prevent accidental disconnection under load, significantly reducing safety hazards and downtime. Furthermore, manufacturers are increasingly employing high-temperature resistant materials and enhanced insulation techniques to withstand extreme operational environments, such as those found in foundries, chemical plants, and heavy machinery operations. The integration of IP-rated enclosures (e.g., IP67, IP68) is now standard for many industrial applications, providing superior protection against dust and water ingress, crucial for outdoor or wash-down environments.
The drive towards Industry 4.0 has also spurred innovations in smart connectivity solutions. These include plugs and sockets with embedded sensors for monitoring power flow, temperature, and connection integrity, enabling predictive maintenance and optimized energy management. Unique selling propositions for manufacturers often lie in their ability to offer highly customized solutions, rapid prototyping, and comprehensive technical support alongside their innovative product lines, addressing the specific, often complex, needs of diverse industrial clients.
Propelling Factors for Industrial Power Plug And Socket Growth
Several key factors are propelling the growth of the industrial power plug and socket market. The relentless pace of industrial automation and digitalization across sectors like manufacturing, logistics, and energy is a primary driver. As factories become smarter and more interconnected, the demand for reliable and robust power connectors to support sophisticated machinery and control systems escalates. Furthermore, the global push towards renewable energy sources and the expansion of electric vehicle (EV) infrastructure are creating substantial new markets for high-voltage and high-current industrial power plugs and sockets. Government initiatives supporting these green transitions and industrial upgrades also provide a strong impetus.
- Industrial Automation: Increased adoption of robots, AI, and automated production lines requires dependable power connections.
- New Energy Sector Growth: Expansion of solar, wind, and EV charging networks demands specialized, high-capacity connectors.
- Infrastructure Development: Global investments in modernizing industrial facilities and power grids.
- Technological Advancements: Innovations in material science and smart connectivity enhancing product performance and safety.
Obstacles in the Industrial Power Plug And Socket Market
Despite robust growth, the industrial power plug and socket market faces certain obstacles. Stringent and evolving regulatory compliance across different regions can be a significant hurdle, requiring substantial investment in testing and certification, which can slow down product development and market entry. Supply chain disruptions, particularly for specialized raw materials and electronic components, can lead to production delays and increased costs. Furthermore, intense price competition among manufacturers, especially in more commoditized segments, can impact profit margins. The initial high cost of advanced, smart connectivity solutions can also be a barrier for smaller enterprises or those in cost-sensitive industries, limiting widespread adoption in certain market segments.
- Regulatory Compliance: Navigating diverse and changing international safety and performance standards.
- Supply Chain Volatility: Dependence on global supply chains for critical materials and components.
- Price Sensitivity: Pressure on margins due to competition in certain market segments.
- High Initial Investment: Cost of advanced and smart connectivity solutions can deter adoption.
Future Opportunities in Industrial Power Plug And Socket
The industrial power plug and socket market is ripe with emerging opportunities. The accelerating adoption of 5G technology and the expansion of smart factories will drive demand for high-speed data transmission capable connectors, often integrated with power. The continued growth of the New Energy Industry, particularly in energy storage solutions and smart grids, will require highly specialized and robust power connectors. Furthermore, the increasing focus on sustainability and energy efficiency is creating opportunities for manufacturers to develop and market eco-friendly solutions with optimized performance. Emerging markets in developing economies undergoing rapid industrialization also present significant untapped potential for market penetration and growth.
- Smart Grids and Energy Storage: Demand for advanced connectors in grid modernization and battery systems.
- 5G Integration: Development of connectors supporting both power and high-speed data in industrial settings.
- Emerging Markets: Untapped potential in developing economies with expanding industrial bases.
- Sustainable Solutions: Focus on eco-friendly materials and energy-efficient connector designs.
Major Players in the Industrial Power Plug And Socket Ecosystem
ABB Honeywell Walther ILME Ceenorm Clifford and Snell Hubbell Wiring Devices Lapp USA Legrand PCE Phoenix Contact
Key Developments in Industrial Power Plug And Socket Industry
- 2023/08: Introduction of enhanced IP69K rated industrial connectors for extreme wash-down applications by a leading manufacturer.
- 2023/04: Launch of a new series of smart industrial plugs with integrated IoT capabilities for real-time monitoring by a prominent player.
- 2022/11: Significant M&A activity with a large component manufacturer acquiring a specialist in high-voltage industrial connectors to expand its portfolio.
- 2022/06: Release of a new range of explosion-proof industrial plugs and sockets designed for hazardous environments.
- 2021/09: Increased focus on modular design and plug-and-play solutions to simplify installation and maintenance across the industry.
- 2020/03: Enhanced safety features, including advanced arc-flash prevention, become a key focus for new product development.
Strategic Industrial Power Plug And Socket Market Forecast
The strategic industrial power plug and socket market forecast indicates a robust and sustained growth trajectory, driven by synergistic forces of technological innovation, increasing industrialization, and the global shift towards sustainable energy. The expanding adoption of Industry 4.0 principles, the relentless growth of the new energy sector, and the electrification of transportation are key pillars supporting this optimistic outlook. Manufacturers who prioritize product innovation, focus on meeting stringent safety and environmental regulations, and strategically target high-growth application segments like automation and new energy are poised to capitalize on this expanding market potential. The forecast suggests a consistent upward trend, with emerging opportunities in smart connectivity and emerging economies further bolstering market expansion throughout the forecast period.
Industrial Power Plug And Socket Segmentation
-
1. Application
- 1.1. Automotive Electronics
- 1.2. Home Appliances
- 1.3. Consumer Electronics
- 1.4. New Energy Industry
- 1.5. Automation Control Industry
-
2. Type
- 2.1. Below 100V
- 2.2. 100V-500V
- 2.3. Above 500V
Industrial Power Plug And Socket Segmentation By Geography
-
1. North America
- 1.1. United States
- 1.2. Canada
- 1.3. Mexico
-
2. South America
- 2.1. Brazil
- 2.2. Argentina
- 2.3. Rest of South America
-
3. Europe
- 3.1. United Kingdom
- 3.2. Germany
- 3.3. France
- 3.4. Italy
- 3.5. Spain
- 3.6. Russia
- 3.7. Benelux
- 3.8. Nordics
- 3.9. Rest of Europe
-
4. Middle East & Africa
- 4.1. Turkey
- 4.2. Israel
- 4.3. GCC
- 4.4. North Africa
- 4.5. South Africa
- 4.6. Rest of Middle East & Africa
-
5. Asia Pacific
- 5.1. China
- 5.2. India
- 5.3. Japan
- 5.4. South Korea
- 5.5. ASEAN
- 5.6. Oceania
- 5.7. Rest of Asia Pacific
Industrial Power Plug And Socket Regional Market Share
Geographic Coverage of Industrial Power Plug And Socket
Industrial Power Plug And Socket REPORT HIGHLIGHTS
| Aspects | Details |
|---|---|
| Study Period | 2020-2034 |
| Base Year | 2025 |
| Estimated Year | 2026 |
| Forecast Period | 2026-2034 |
| Historical Period | 2020-2025 |
| Growth Rate | CAGR of 2.8% from 2020-2034 |
| Segmentation |
|
Table of Contents
- 1. Introduction
- 1.1. Research Scope
- 1.2. Market Segmentation
- 1.3. Research Objective
- 1.4. Definitions and Assumptions
- 2. Executive Summary
- 2.1. Market Snapshot
- 3. Market Dynamics
- 3.1. Market Drivers
- 3.2. Market Restrains
- 3.3. Market Trends
- 3.4. Market Opportunities
- 4. Market Factor Analysis
- 4.1. Porters Five Forces
- 4.1.1. Bargaining Power of Suppliers
- 4.1.2. Bargaining Power of Buyers
- 4.1.3. Threat of New Entrants
- 4.1.4. Threat of Substitutes
- 4.1.5. Competitive Rivalry
- 4.2. PESTEL analysis
- 4.3. BCG Analysis
- 4.3.1. Stars (High Growth, High Market Share)
- 4.3.2. Cash Cows (Low Growth, High Market Share)
- 4.3.3. Question Mark (High Growth, Low Market Share)
- 4.3.4. Dogs (Low Growth, Low Market Share)
- 4.4. Ansoff Matrix Analysis
- 4.5. Supply Chain Analysis
- 4.6. Regulatory Landscape
- 4.7. Current Market Potential and Opportunity Assessment (TAM–SAM–SOM Framework)
- 4.8. DMV Analyst Note
- 4.1. Porters Five Forces
- 5. Market Analysis, Insights and Forecast 2021-2033
- 5.1. Market Analysis, Insights and Forecast - by Application
- 5.1.1. Automotive Electronics
- 5.1.2. Home Appliances
- 5.1.3. Consumer Electronics
- 5.1.4. New Energy Industry
- 5.1.5. Automation Control Industry
- 5.2. Market Analysis, Insights and Forecast - by Type
- 5.2.1. Below 100V
- 5.2.2. 100V-500V
- 5.2.3. Above 500V
- 5.3. Market Analysis, Insights and Forecast - by Region
- 5.3.1. North America
- 5.3.2. South America
- 5.3.3. Europe
- 5.3.4. Middle East & Africa
- 5.3.5. Asia Pacific
- 5.1. Market Analysis, Insights and Forecast - by Application
- 6. Global Industrial Power Plug And Socket Analysis, Insights and Forecast, 2021-2033
- 6.1. Market Analysis, Insights and Forecast - by Application
- 6.1.1. Automotive Electronics
- 6.1.2. Home Appliances
- 6.1.3. Consumer Electronics
- 6.1.4. New Energy Industry
- 6.1.5. Automation Control Industry
- 6.2. Market Analysis, Insights and Forecast - by Type
- 6.2.1. Below 100V
- 6.2.2. 100V-500V
- 6.2.3. Above 500V
- 6.1. Market Analysis, Insights and Forecast - by Application
- 7. North America Industrial Power Plug And Socket Analysis, Insights and Forecast, 2020-2032
- 7.1. Market Analysis, Insights and Forecast - by Application
- 7.1.1. Automotive Electronics
- 7.1.2. Home Appliances
- 7.1.3. Consumer Electronics
- 7.1.4. New Energy Industry
- 7.1.5. Automation Control Industry
- 7.2. Market Analysis, Insights and Forecast - by Type
- 7.2.1. Below 100V
- 7.2.2. 100V-500V
- 7.2.3. Above 500V
- 7.1. Market Analysis, Insights and Forecast - by Application
- 8. South America Industrial Power Plug And Socket Analysis, Insights and Forecast, 2020-2032
- 8.1. Market Analysis, Insights and Forecast - by Application
- 8.1.1. Automotive Electronics
- 8.1.2. Home Appliances
- 8.1.3. Consumer Electronics
- 8.1.4. New Energy Industry
- 8.1.5. Automation Control Industry
- 8.2. Market Analysis, Insights and Forecast - by Type
- 8.2.1. Below 100V
- 8.2.2. 100V-500V
- 8.2.3. Above 500V
- 8.1. Market Analysis, Insights and Forecast - by Application
- 9. Europe Industrial Power Plug And Socket Analysis, Insights and Forecast, 2020-2032
- 9.1. Market Analysis, Insights and Forecast - by Application
- 9.1.1. Automotive Electronics
- 9.1.2. Home Appliances
- 9.1.3. Consumer Electronics
- 9.1.4. New Energy Industry
- 9.1.5. Automation Control Industry
- 9.2. Market Analysis, Insights and Forecast - by Type
- 9.2.1. Below 100V
- 9.2.2. 100V-500V
- 9.2.3. Above 500V
- 9.1. Market Analysis, Insights and Forecast - by Application
- 10. Middle East & Africa Industrial Power Plug And Socket Analysis, Insights and Forecast, 2020-2032
- 10.1. Market Analysis, Insights and Forecast - by Application
- 10.1.1. Automotive Electronics
- 10.1.2. Home Appliances
- 10.1.3. Consumer Electronics
- 10.1.4. New Energy Industry
- 10.1.5. Automation Control Industry
- 10.2. Market Analysis, Insights and Forecast - by Type
- 10.2.1. Below 100V
- 10.2.2. 100V-500V
- 10.2.3. Above 500V
- 10.1. Market Analysis, Insights and Forecast - by Application
- 11. Asia Pacific Industrial Power Plug And Socket Analysis, Insights and Forecast, 2020-2032
- 11.1. Market Analysis, Insights and Forecast - by Application
- 11.1.1. Automotive Electronics
- 11.1.2. Home Appliances
- 11.1.3. Consumer Electronics
- 11.1.4. New Energy Industry
- 11.1.5. Automation Control Industry
- 11.2. Market Analysis, Insights and Forecast - by Type
- 11.2.1. Below 100V
- 11.2.2. 100V-500V
- 11.2.3. Above 500V
- 11.1. Market Analysis, Insights and Forecast - by Application
- 12. Competitive Analysis
- 12.1. Company Profiles
- 12.1.1 ABB
- 12.1.1.1. Company Overview
- 12.1.1.2. Products
- 12.1.1.3. Company Financials
- 12.1.1.4. SWOT Analysis
- 12.1.2 Honeywell
- 12.1.2.1. Company Overview
- 12.1.2.2. Products
- 12.1.2.3. Company Financials
- 12.1.2.4. SWOT Analysis
- 12.1.3 Walther
- 12.1.3.1. Company Overview
- 12.1.3.2. Products
- 12.1.3.3. Company Financials
- 12.1.3.4. SWOT Analysis
- 12.1.4 ILME
- 12.1.4.1. Company Overview
- 12.1.4.2. Products
- 12.1.4.3. Company Financials
- 12.1.4.4. SWOT Analysis
- 12.1.5 Ceenorm
- 12.1.5.1. Company Overview
- 12.1.5.2. Products
- 12.1.5.3. Company Financials
- 12.1.5.4. SWOT Analysis
- 12.1.6 Clifford and Snell
- 12.1.6.1. Company Overview
- 12.1.6.2. Products
- 12.1.6.3. Company Financials
- 12.1.6.4. SWOT Analysis
- 12.1.7 Hubbell Wiring Devices
- 12.1.7.1. Company Overview
- 12.1.7.2. Products
- 12.1.7.3. Company Financials
- 12.1.7.4. SWOT Analysis
- 12.1.8 Lapp USA
- 12.1.8.1. Company Overview
- 12.1.8.2. Products
- 12.1.8.3. Company Financials
- 12.1.8.4. SWOT Analysis
- 12.1.9 Legrand
- 12.1.9.1. Company Overview
- 12.1.9.2. Products
- 12.1.9.3. Company Financials
- 12.1.9.4. SWOT Analysis
- 12.1.10 PCE
- 12.1.10.1. Company Overview
- 12.1.10.2. Products
- 12.1.10.3. Company Financials
- 12.1.10.4. SWOT Analysis
- 12.1.11 Phoenix Contact
- 12.1.11.1. Company Overview
- 12.1.11.2. Products
- 12.1.11.3. Company Financials
- 12.1.11.4. SWOT Analysis
- 12.1.1 ABB
- 12.2. Market Entropy
- 12.2.1 Company's Key Areas Served
- 12.2.2 Recent Developments
- 12.3. Company Market Share Analysis 2025
- 12.3.1 Top 5 Companies Market Share Analysis
- 12.3.2 Top 3 Companies Market Share Analysis
- 12.4. List of Potential Customers
- 13. Research Methodology
List of Figures
- Figure 1: Global Industrial Power Plug And Socket Revenue Breakdown (undefined, %) by Region 2025 & 2033
- Figure 2: Global Industrial Power Plug And Socket Volume Breakdown (K, %) by Region 2025 & 2033
- Figure 3: North America Industrial Power Plug And Socket Revenue (undefined), by Application 2025 & 2033
- Figure 4: North America Industrial Power Plug And Socket Volume (K), by Application 2025 & 2033
- Figure 5: North America Industrial Power Plug And Socket Revenue Share (%), by Application 2025 & 2033
- Figure 6: North America Industrial Power Plug And Socket Volume Share (%), by Application 2025 & 2033
- Figure 7: North America Industrial Power Plug And Socket Revenue (undefined), by Type 2025 & 2033
- Figure 8: North America Industrial Power Plug And Socket Volume (K), by Type 2025 & 2033
- Figure 9: North America Industrial Power Plug And Socket Revenue Share (%), by Type 2025 & 2033
- Figure 10: North America Industrial Power Plug And Socket Volume Share (%), by Type 2025 & 2033
- Figure 11: North America Industrial Power Plug And Socket Revenue (undefined), by Country 2025 & 2033
- Figure 12: North America Industrial Power Plug And Socket Volume (K), by Country 2025 & 2033
- Figure 13: North America Industrial Power Plug And Socket Revenue Share (%), by Country 2025 & 2033
- Figure 14: North America Industrial Power Plug And Socket Volume Share (%), by Country 2025 & 2033
- Figure 15: South America Industrial Power Plug And Socket Revenue (undefined), by Application 2025 & 2033
- Figure 16: South America Industrial Power Plug And Socket Volume (K), by Application 2025 & 2033
- Figure 17: South America Industrial Power Plug And Socket Revenue Share (%), by Application 2025 & 2033
- Figure 18: South America Industrial Power Plug And Socket Volume Share (%), by Application 2025 & 2033
- Figure 19: South America Industrial Power Plug And Socket Revenue (undefined), by Type 2025 & 2033
- Figure 20: South America Industrial Power Plug And Socket Volume (K), by Type 2025 & 2033
- Figure 21: South America Industrial Power Plug And Socket Revenue Share (%), by Type 2025 & 2033
- Figure 22: South America Industrial Power Plug And Socket Volume Share (%), by Type 2025 & 2033
- Figure 23: South America Industrial Power Plug And Socket Revenue (undefined), by Country 2025 & 2033
- Figure 24: South America Industrial Power Plug And Socket Volume (K), by Country 2025 & 2033
- Figure 25: South America Industrial Power Plug And Socket Revenue Share (%), by Country 2025 & 2033
- Figure 26: South America Industrial Power Plug And Socket Volume Share (%), by Country 2025 & 2033
- Figure 27: Europe Industrial Power Plug And Socket Revenue (undefined), by Application 2025 & 2033
- Figure 28: Europe Industrial Power Plug And Socket Volume (K), by Application 2025 & 2033
- Figure 29: Europe Industrial Power Plug And Socket Revenue Share (%), by Application 2025 & 2033
- Figure 30: Europe Industrial Power Plug And Socket Volume Share (%), by Application 2025 & 2033
- Figure 31: Europe Industrial Power Plug And Socket Revenue (undefined), by Type 2025 & 2033
- Figure 32: Europe Industrial Power Plug And Socket Volume (K), by Type 2025 & 2033
- Figure 33: Europe Industrial Power Plug And Socket Revenue Share (%), by Type 2025 & 2033
- Figure 34: Europe Industrial Power Plug And Socket Volume Share (%), by Type 2025 & 2033
- Figure 35: Europe Industrial Power Plug And Socket Revenue (undefined), by Country 2025 & 2033
- Figure 36: Europe Industrial Power Plug And Socket Volume (K), by Country 2025 & 2033
- Figure 37: Europe Industrial Power Plug And Socket Revenue Share (%), by Country 2025 & 2033
- Figure 38: Europe Industrial Power Plug And Socket Volume Share (%), by Country 2025 & 2033
- Figure 39: Middle East & Africa Industrial Power Plug And Socket Revenue (undefined), by Application 2025 & 2033
- Figure 40: Middle East & Africa Industrial Power Plug And Socket Volume (K), by Application 2025 & 2033
- Figure 41: Middle East & Africa Industrial Power Plug And Socket Revenue Share (%), by Application 2025 & 2033
- Figure 42: Middle East & Africa Industrial Power Plug And Socket Volume Share (%), by Application 2025 & 2033
- Figure 43: Middle East & Africa Industrial Power Plug And Socket Revenue (undefined), by Type 2025 & 2033
- Figure 44: Middle East & Africa Industrial Power Plug And Socket Volume (K), by Type 2025 & 2033
- Figure 45: Middle East & Africa Industrial Power Plug And Socket Revenue Share (%), by Type 2025 & 2033
- Figure 46: Middle East & Africa Industrial Power Plug And Socket Volume Share (%), by Type 2025 & 2033
- Figure 47: Middle East & Africa Industrial Power Plug And Socket Revenue (undefined), by Country 2025 & 2033
- Figure 48: Middle East & Africa Industrial Power Plug And Socket Volume (K), by Country 2025 & 2033
- Figure 49: Middle East & Africa Industrial Power Plug And Socket Revenue Share (%), by Country 2025 & 2033
- Figure 50: Middle East & Africa Industrial Power Plug And Socket Volume Share (%), by Country 2025 & 2033
- Figure 51: Asia Pacific Industrial Power Plug And Socket Revenue (undefined), by Application 2025 & 2033
- Figure 52: Asia Pacific Industrial Power Plug And Socket Volume (K), by Application 2025 & 2033
- Figure 53: Asia Pacific Industrial Power Plug And Socket Revenue Share (%), by Application 2025 & 2033
- Figure 54: Asia Pacific Industrial Power Plug And Socket Volume Share (%), by Application 2025 & 2033
- Figure 55: Asia Pacific Industrial Power Plug And Socket Revenue (undefined), by Type 2025 & 2033
- Figure 56: Asia Pacific Industrial Power Plug And Socket Volume (K), by Type 2025 & 2033
- Figure 57: Asia Pacific Industrial Power Plug And Socket Revenue Share (%), by Type 2025 & 2033
- Figure 58: Asia Pacific Industrial Power Plug And Socket Volume Share (%), by Type 2025 & 2033
- Figure 59: Asia Pacific Industrial Power Plug And Socket Revenue (undefined), by Country 2025 & 2033
- Figure 60: Asia Pacific Industrial Power Plug And Socket Volume (K), by Country 2025 & 2033
- Figure 61: Asia Pacific Industrial Power Plug And Socket Revenue Share (%), by Country 2025 & 2033
- Figure 62: Asia Pacific Industrial Power Plug And Socket Volume Share (%), by Country 2025 & 2033
List of Tables
- Table 1: Global Industrial Power Plug And Socket Revenue undefined Forecast, by Application 2020 & 2033
- Table 2: Global Industrial Power Plug And Socket Volume K Forecast, by Application 2020 & 2033
- Table 3: Global Industrial Power Plug And Socket Revenue undefined Forecast, by Type 2020 & 2033
- Table 4: Global Industrial Power Plug And Socket Volume K Forecast, by Type 2020 & 2033
- Table 5: Global Industrial Power Plug And Socket Revenue undefined Forecast, by Region 2020 & 2033
- Table 6: Global Industrial Power Plug And Socket Volume K Forecast, by Region 2020 & 2033
- Table 7: Global Industrial Power Plug And Socket Revenue undefined Forecast, by Application 2020 & 2033
- Table 8: Global Industrial Power Plug And Socket Volume K Forecast, by Application 2020 & 2033
- Table 9: Global Industrial Power Plug And Socket Revenue undefined Forecast, by Type 2020 & 2033
- Table 10: Global Industrial Power Plug And Socket Volume K Forecast, by Type 2020 & 2033
- Table 11: Global Industrial Power Plug And Socket Revenue undefined Forecast, by Country 2020 & 2033
- Table 12: Global Industrial Power Plug And Socket Volume K Forecast, by Country 2020 & 2033
- Table 13: United States Industrial Power Plug And Socket Revenue (undefined) Forecast, by Application 2020 & 2033
- Table 14: United States Industrial Power Plug And Socket Volume (K) Forecast, by Application 2020 & 2033
- Table 15: Canada Industrial Power Plug And Socket Revenue (undefined) Forecast, by Application 2020 & 2033
- Table 16: Canada Industrial Power Plug And Socket Volume (K) Forecast, by Application 2020 & 2033
- Table 17: Mexico Industrial Power Plug And Socket Revenue (undefined) Forecast, by Application 2020 & 2033
- Table 18: Mexico Industrial Power Plug And Socket Volume (K) Forecast, by Application 2020 & 2033
- Table 19: Global Industrial Power Plug And Socket Revenue undefined Forecast, by Application 2020 & 2033
- Table 20: Global Industrial Power Plug And Socket Volume K Forecast, by Application 2020 & 2033
- Table 21: Global Industrial Power Plug And Socket Revenue undefined Forecast, by Type 2020 & 2033
- Table 22: Global Industrial Power Plug And Socket Volume K Forecast, by Type 2020 & 2033
- Table 23: Global Industrial Power Plug And Socket Revenue undefined Forecast, by Country 2020 & 2033
- Table 24: Global Industrial Power Plug And Socket Volume K Forecast, by Country 2020 & 2033
- Table 25: Brazil Industrial Power Plug And Socket Revenue (undefined) Forecast, by Application 2020 & 2033
- Table 26: Brazil Industrial Power Plug And Socket Volume (K) Forecast, by Application 2020 & 2033
- Table 27: Argentina Industrial Power Plug And Socket Revenue (undefined) Forecast, by Application 2020 & 2033
- Table 28: Argentina Industrial Power Plug And Socket Volume (K) Forecast, by Application 2020 & 2033
- Table 29: Rest of South America Industrial Power Plug And Socket Revenue (undefined) Forecast, by Application 2020 & 2033
- Table 30: Rest of South America Industrial Power Plug And Socket Volume (K) Forecast, by Application 2020 & 2033
- Table 31: Global Industrial Power Plug And Socket Revenue undefined Forecast, by Application 2020 & 2033
- Table 32: Global Industrial Power Plug And Socket Volume K Forecast, by Application 2020 & 2033
- Table 33: Global Industrial Power Plug And Socket Revenue undefined Forecast, by Type 2020 & 2033
- Table 34: Global Industrial Power Plug And Socket Volume K Forecast, by Type 2020 & 2033
- Table 35: Global Industrial Power Plug And Socket Revenue undefined Forecast, by Country 2020 & 2033
- Table 36: Global Industrial Power Plug And Socket Volume K Forecast, by Country 2020 & 2033
- Table 37: United Kingdom Industrial Power Plug And Socket Revenue (undefined) Forecast, by Application 2020 & 2033
- Table 38: United Kingdom Industrial Power Plug And Socket Volume (K) Forecast, by Application 2020 & 2033
- Table 39: Germany Industrial Power Plug And Socket Revenue (undefined) Forecast, by Application 2020 & 2033
- Table 40: Germany Industrial Power Plug And Socket Volume (K) Forecast, by Application 2020 & 2033
- Table 41: France Industrial Power Plug And Socket Revenue (undefined) Forecast, by Application 2020 & 2033
- Table 42: France Industrial Power Plug And Socket Volume (K) Forecast, by Application 2020 & 2033
- Table 43: Italy Industrial Power Plug And Socket Revenue (undefined) Forecast, by Application 2020 & 2033
- Table 44: Italy Industrial Power Plug And Socket Volume (K) Forecast, by Application 2020 & 2033
- Table 45: Spain Industrial Power Plug And Socket Revenue (undefined) Forecast, by Application 2020 & 2033
- Table 46: Spain Industrial Power Plug And Socket Volume (K) Forecast, by Application 2020 & 2033
- Table 47: Russia Industrial Power Plug And Socket Revenue (undefined) Forecast, by Application 2020 & 2033
- Table 48: Russia Industrial Power Plug And Socket Volume (K) Forecast, by Application 2020 & 2033
- Table 49: Benelux Industrial Power Plug And Socket Revenue (undefined) Forecast, by Application 2020 & 2033
- Table 50: Benelux Industrial Power Plug And Socket Volume (K) Forecast, by Application 2020 & 2033
- Table 51: Nordics Industrial Power Plug And Socket Revenue (undefined) Forecast, by Application 2020 & 2033
- Table 52: Nordics Industrial Power Plug And Socket Volume (K) Forecast, by Application 2020 & 2033
- Table 53: Rest of Europe Industrial Power Plug And Socket Revenue (undefined) Forecast, by Application 2020 & 2033
- Table 54: Rest of Europe Industrial Power Plug And Socket Volume (K) Forecast, by Application 2020 & 2033
- Table 55: Global Industrial Power Plug And Socket Revenue undefined Forecast, by Application 2020 & 2033
- Table 56: Global Industrial Power Plug And Socket Volume K Forecast, by Application 2020 & 2033
- Table 57: Global Industrial Power Plug And Socket Revenue undefined Forecast, by Type 2020 & 2033
- Table 58: Global Industrial Power Plug And Socket Volume K Forecast, by Type 2020 & 2033
- Table 59: Global Industrial Power Plug And Socket Revenue undefined Forecast, by Country 2020 & 2033
- Table 60: Global Industrial Power Plug And Socket Volume K Forecast, by Country 2020 & 2033
- Table 61: Turkey Industrial Power Plug And Socket Revenue (undefined) Forecast, by Application 2020 & 2033
- Table 62: Turkey Industrial Power Plug And Socket Volume (K) Forecast, by Application 2020 & 2033
- Table 63: Israel Industrial Power Plug And Socket Revenue (undefined) Forecast, by Application 2020 & 2033
- Table 64: Israel Industrial Power Plug And Socket Volume (K) Forecast, by Application 2020 & 2033
- Table 65: GCC Industrial Power Plug And Socket Revenue (undefined) Forecast, by Application 2020 & 2033
- Table 66: GCC Industrial Power Plug And Socket Volume (K) Forecast, by Application 2020 & 2033
- Table 67: North Africa Industrial Power Plug And Socket Revenue (undefined) Forecast, by Application 2020 & 2033
- Table 68: North Africa Industrial Power Plug And Socket Volume (K) Forecast, by Application 2020 & 2033
- Table 69: South Africa Industrial Power Plug And Socket Revenue (undefined) Forecast, by Application 2020 & 2033
- Table 70: South Africa Industrial Power Plug And Socket Volume (K) Forecast, by Application 2020 & 2033
- Table 71: Rest of Middle East & Africa Industrial Power Plug And Socket Revenue (undefined) Forecast, by Application 2020 & 2033
- Table 72: Rest of Middle East & Africa Industrial Power Plug And Socket Volume (K) Forecast, by Application 2020 & 2033
- Table 73: Global Industrial Power Plug And Socket Revenue undefined Forecast, by Application 2020 & 2033
- Table 74: Global Industrial Power Plug And Socket Volume K Forecast, by Application 2020 & 2033
- Table 75: Global Industrial Power Plug And Socket Revenue undefined Forecast, by Type 2020 & 2033
- Table 76: Global Industrial Power Plug And Socket Volume K Forecast, by Type 2020 & 2033
- Table 77: Global Industrial Power Plug And Socket Revenue undefined Forecast, by Country 2020 & 2033
- Table 78: Global Industrial Power Plug And Socket Volume K Forecast, by Country 2020 & 2033
- Table 79: China Industrial Power Plug And Socket Revenue (undefined) Forecast, by Application 2020 & 2033
- Table 80: China Industrial Power Plug And Socket Volume (K) Forecast, by Application 2020 & 2033
- Table 81: India Industrial Power Plug And Socket Revenue (undefined) Forecast, by Application 2020 & 2033
- Table 82: India Industrial Power Plug And Socket Volume (K) Forecast, by Application 2020 & 2033
- Table 83: Japan Industrial Power Plug And Socket Revenue (undefined) Forecast, by Application 2020 & 2033
- Table 84: Japan Industrial Power Plug And Socket Volume (K) Forecast, by Application 2020 & 2033
- Table 85: South Korea Industrial Power Plug And Socket Revenue (undefined) Forecast, by Application 2020 & 2033
- Table 86: South Korea Industrial Power Plug And Socket Volume (K) Forecast, by Application 2020 & 2033
- Table 87: ASEAN Industrial Power Plug And Socket Revenue (undefined) Forecast, by Application 2020 & 2033
- Table 88: ASEAN Industrial Power Plug And Socket Volume (K) Forecast, by Application 2020 & 2033
- Table 89: Oceania Industrial Power Plug And Socket Revenue (undefined) Forecast, by Application 2020 & 2033
- Table 90: Oceania Industrial Power Plug And Socket Volume (K) Forecast, by Application 2020 & 2033
- Table 91: Rest of Asia Pacific Industrial Power Plug And Socket Revenue (undefined) Forecast, by Application 2020 & 2033
- Table 92: Rest of Asia Pacific Industrial Power Plug And Socket Volume (K) Forecast, by Application 2020 & 2033
Frequently Asked Questions
1. What is the projected Compound Annual Growth Rate (CAGR) of the Industrial Power Plug And Socket?
The projected CAGR is approximately 2.8%.
2. Which companies are prominent players in the Industrial Power Plug And Socket?
Key companies in the market include ABB, Honeywell, Walther, ILME, Ceenorm, Clifford and Snell, Hubbell Wiring Devices, Lapp USA, Legrand, PCE, Phoenix Contact.
3. What are the main segments of the Industrial Power Plug And Socket?
The market segments include Application, Type.
4. Can you provide details about the market size?
The market size is estimated to be USD XXX N/A as of 2022.
5. What are some drivers contributing to market growth?
N/A
6. What are the notable trends driving market growth?
N/A
7. Are there any restraints impacting market growth?
N/A
8. Can you provide examples of recent developments in the market?
N/A
9. What pricing options are available for accessing the report?
Pricing options include single-user, multi-user, and enterprise licenses priced at USD 3950.00, USD 5925.00, and USD 7900.00 respectively.
10. Is the market size provided in terms of value or volume?
The market size is provided in terms of value, measured in N/A and volume, measured in K.
11. Are there any specific market keywords associated with the report?
Yes, the market keyword associated with the report is "Industrial Power Plug And Socket," which aids in identifying and referencing the specific market segment covered.
12. How do I determine which pricing option suits my needs best?
The pricing options vary based on user requirements and access needs. Individual users may opt for single-user licenses, while businesses requiring broader access may choose multi-user or enterprise licenses for cost-effective access to the report.
13. Are there any additional resources or data provided in the Industrial Power Plug And Socket report?
While the report offers comprehensive insights, it's advisable to review the specific contents or supplementary materials provided to ascertain if additional resources or data are available.
14. How can I stay updated on further developments or reports in the Industrial Power Plug And Socket?
To stay informed about further developments, trends, and reports in the Industrial Power Plug And Socket, consider subscribing to industry newsletters, following relevant companies and organizations, or regularly checking reputable industry news sources and publications.
Methodology
Step 1 - Identification of Relevant Samples Size from Population Database


Step 2 - Approaches for Defining Global Market Size (Value, Volume* & Price*)

Note*: In applicable scenarios
Step 3 - Data Sources
Primary Research
- Web Analytics
- Survey Reports
- Research Institute
- Latest Research Reports
- Opinion Leaders
Secondary Research
- Annual Reports
- White Paper
- Latest Press Release
- Industry Association
- Paid Database
- Investor Presentations

Step 4 - Data Triangulation
Involves using different sources of information in order to increase the validity of a study
These sources are likely to be stakeholders in a program - participants, other researchers, program staff, other community members, and so on.
Then we put all data in single framework & apply various statistical tools to find out the dynamic on the market.
During the analysis stage, feedback from the stakeholder groups would be compared to determine areas of agreement as well as areas of divergence