

Key Insights
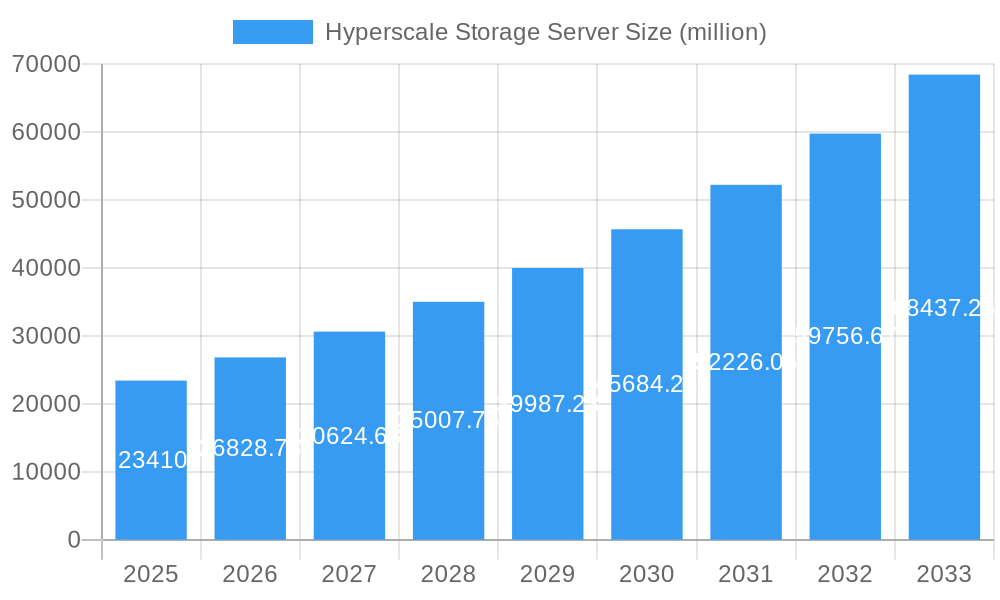
The hyperscale storage server market, valued at $23.41 billion in 2025, is experiencing robust growth, projected to maintain a Compound Annual Growth Rate (CAGR) of 14.8% from 2025 to 2033. This expansion is fueled by the increasing demand for cloud computing services, big data analytics, and the Internet of Things (IoT). Organizations are increasingly adopting hyperscale architectures to manage massive data volumes and ensure high availability and scalability. Key drivers include the need for improved data management efficiency, reduced operational costs, and enhanced disaster recovery capabilities. The market is witnessing significant technological advancements, such as the adoption of NVMe (Non-Volatile Memory Express) technology, which offers significantly faster data transfer speeds than traditional storage solutions. Furthermore, the growing adoption of artificial intelligence (AI) and machine learning (ML) is driving demand for advanced storage solutions capable of handling the substantial data generated by these technologies. Competition is fierce, with established players like Dell Technologies, Hewlett Packard Enterprise, and NetApp alongside emerging players like Nutanix and others vying for market share.
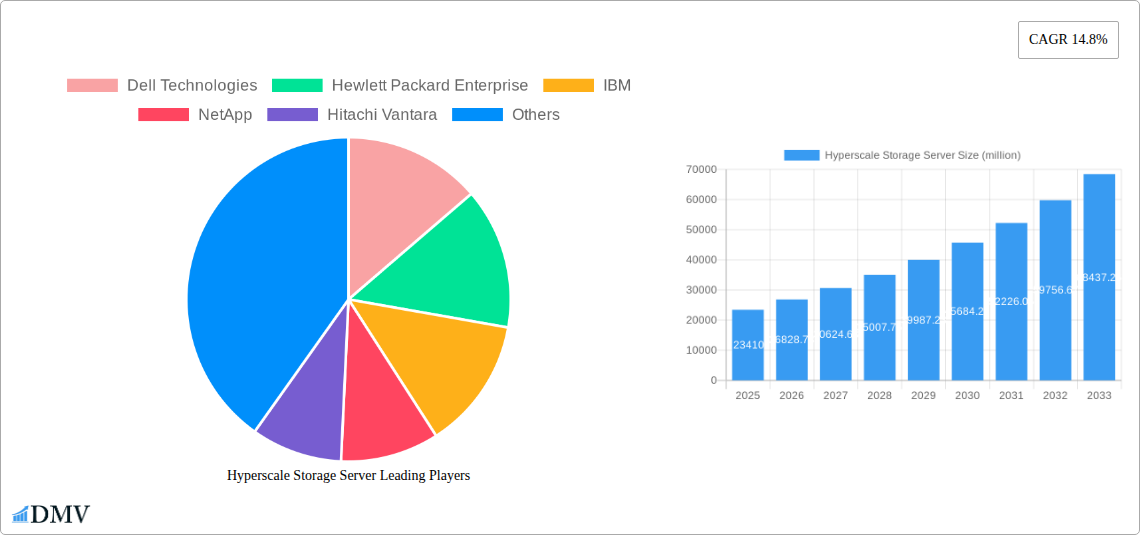
Hyperscale Storage Server Market Size (In Billion)
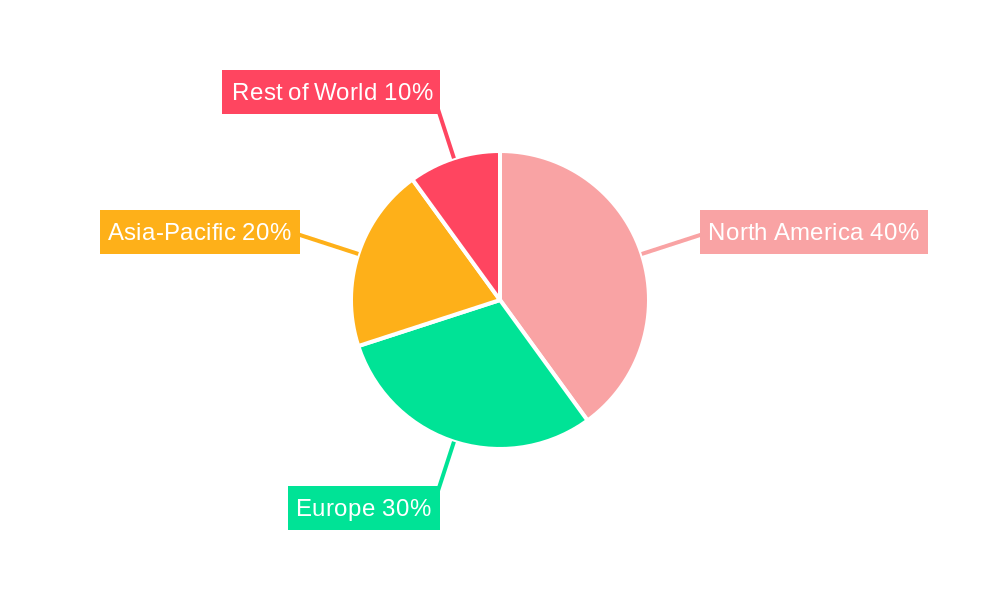
The forecast period from 2025 to 2033 will likely see continued market consolidation as larger vendors acquire smaller companies to expand their product portfolios and market reach. Growth will be influenced by factors like global economic conditions, technological innovations, and the evolving cybersecurity landscape. Regional variations in adoption rates are expected, with North America and Europe likely leading the market due to greater technological maturity and higher cloud adoption rates. However, regions like Asia-Pacific are poised for significant growth, driven by the rapid expansion of data centers and the increasing adoption of cloud services in emerging economies. The market will continue to evolve toward software-defined storage and other innovative solutions that optimize storage resource utilization and simplify management.
Hyperscale Storage Server Company Market Share
Hyperscale Storage Server Market Report: 2019-2033
This comprehensive report provides an in-depth analysis of the global hyperscale storage server market, projecting a multi-million dollar valuation by 2033. The study covers the historical period (2019-2024), base year (2025), and forecast period (2025-2033), offering critical insights for stakeholders across the industry. Key players like Dell Technologies, Hewlett Packard Enterprise, IBM, and NetApp are thoroughly examined alongside emerging competitors. This report is crucial for strategic decision-making, investment analysis, and understanding the future trajectory of this rapidly evolving market.
Hyperscale Storage Server Market Composition & Trends
The global hyperscale storage server market, valued at $XX million in 2024, is experiencing significant growth fueled by the increasing demand for data storage and processing capabilities across various industries. Market concentration is moderately high, with key players like Dell Technologies and Hewlett Packard Enterprise holding significant shares. Innovation is driven by advancements in technologies such as NVMe, SSDs, and AI-powered data management. Regulatory landscapes, particularly concerning data privacy and security, significantly impact market dynamics. Substitute products, such as cloud storage solutions, pose competitive pressure, while M&A activities are reshaping the competitive landscape.
Market Share Distribution (2024 Estimated):
- Dell Technologies: XX%
- Hewlett Packard Enterprise: XX%
- IBM: XX%
- NetApp: XX%
- Others: XX%
Notable M&A Activities (2019-2024):
- Acquisition of [Company A] by [Company B] for $XX million (Year).
- Merger between [Company C] and Company D. These deals highlight the increasing consolidation within the sector.
Hyperscale Storage Server Industry Evolution
The hyperscale storage server market has demonstrated robust growth, expanding at a CAGR of XX% during the historical period (2019-2024). This growth trajectory is projected to continue throughout the forecast period, with a CAGR of XX% expected from 2025 to 2033, reaching a market value of $XX million by 2033. This expansion is propelled by several factors, including the exponential growth in data generation across various sectors like cloud computing, big data analytics, and the Internet of Things (IoT). Technological advancements, such as the adoption of NVMe-based storage and the increasing capacity and performance of SSDs, are driving down costs and improving efficiency. Simultaneously, consumer demand for faster, more reliable, and scalable storage solutions is bolstering market growth.
Leading Regions, Countries, or Segments in Hyperscale Storage Server
North America currently dominates the hyperscale storage server market, driven by robust technological advancements and high adoption rates among large enterprises and cloud providers.
- Key Drivers in North America:
- High levels of venture capital investment in data center infrastructure.
- Strong government support for digital transformation initiatives.
- Presence of major hyperscale cloud providers like Amazon Web Services, Microsoft Azure, and Google Cloud.
The dominance of North America is primarily due to the high concentration of hyperscale data centers, robust IT infrastructure, and early adoption of advanced technologies. However, Asia-Pacific is witnessing rapid growth, fueled by increasing digitization and substantial investments in data infrastructure. Europe is also a significant market, primarily driven by strong regulatory frameworks and growing awareness of data security.
Hyperscale Storage Server Product Innovations
Recent innovations in hyperscale storage servers focus on improving performance, scalability, and efficiency. The introduction of NVMe-based storage solutions has significantly boosted read/write speeds, while advancements in data compression and deduplication technologies optimize storage capacity and reduce operational costs. Moreover, advancements in AI-powered data management enhance data accessibility, security, and overall system performance. These innovations deliver greater efficiency and cost-effectiveness, creating unique selling propositions for vendors.
Propelling Factors for Hyperscale Storage Server Growth
Several factors are driving the growth of the hyperscale storage server market. Technological advancements, particularly in storage density and performance, are paramount. The increasing adoption of cloud computing and big data analytics is also a significant driver, demanding greater storage capacity and processing power. Government initiatives aimed at promoting digital transformation and data infrastructure development further fuel market expansion. Finally, the declining cost of storage hardware makes hyperscale solutions more accessible to a broader range of organizations.
Obstacles in the Hyperscale Storage Server Market
Despite significant growth potential, the hyperscale storage server market faces several challenges. Supply chain disruptions, particularly related to semiconductor components, can impact production and lead to increased costs. Intense competition among established and emerging vendors creates downward pressure on pricing. Furthermore, stringent data privacy and security regulations impose additional costs and complexities for vendors and users. These factors collectively impact market expansion.
Future Opportunities in Hyperscale Storage Server
Future opportunities lie in emerging technologies like edge computing and the Internet of Things (IoT). These applications require distributed storage solutions that can handle real-time data processing. Moreover, growth is expected in areas like AI-powered data management, which can optimize storage utilization and improve operational efficiency. Expanding into new geographical markets, especially in developing economies, presents further opportunities.
Major Players in the Hyperscale Storage Server Ecosystem
- Dell Technologies
- Hewlett Packard Enterprise
- IBM
- NetApp
- Hitachi Vantara
- Huawei
- Inspur
- H3C
- Infore Storage
- Nutanix
- EMC Corporation
- Citrix Systems
- Datacore
- Scale Computing
- Simplivity
- Stormagic
- Nexenta
Key Developments in Hyperscale Storage Server Industry
- January 2023: Dell Technologies launches a new line of NVMe-based hyperscale storage servers.
- March 2022: Hewlett Packard Enterprise announces a strategic partnership with [Partner Company] to expand its hyperscale storage solutions portfolio.
- June 2021: IBM acquires [Acquired Company], expanding its capabilities in AI-powered data management.
Strategic Hyperscale Storage Server Market Forecast
The hyperscale storage server market is poised for continued robust growth, driven by technological advancements, increasing data volumes, and the growing adoption of cloud computing and big data analytics. The market is expected to experience significant expansion in the coming years, creating substantial opportunities for both established and emerging players. Focusing on innovation, strategic partnerships, and meeting evolving customer demands will be key to achieving success in this dynamic market.
Hyperscale Storage Server Segmentation
-
1. Application
- 1.1. Enterprise Data Management
- 1.2. Cloud Computing and Virtualization
- 1.3. Big Data and AI Analysis
- 1.4. Financial And Government Applications
- 1.5. Other
-
2. Type
- 2.1. SAN (Storage Area Network) Storage
- 2.2. SAN (Storage Area Network) Storage
- 2.3. DAS (Direct Attached Storage) Storage
- 2.4. Software Defined Storage (SDS)
Hyperscale Storage Server Segmentation By Geography
-
1. North America
- 1.1. United States
- 1.2. Canada
- 1.3. Mexico
-
2. South America
- 2.1. Brazil
- 2.2. Argentina
- 2.3. Rest of South America
-
3. Europe
- 3.1. United Kingdom
- 3.2. Germany
- 3.3. France
- 3.4. Italy
- 3.5. Spain
- 3.6. Russia
- 3.7. Benelux
- 3.8. Nordics
- 3.9. Rest of Europe
-
4. Middle East & Africa
- 4.1. Turkey
- 4.2. Israel
- 4.3. GCC
- 4.4. North Africa
- 4.5. South Africa
- 4.6. Rest of Middle East & Africa
-
5. Asia Pacific
- 5.1. China
- 5.2. India
- 5.3. Japan
- 5.4. South Korea
- 5.5. ASEAN
- 5.6. Oceania
- 5.7. Rest of Asia Pacific
Hyperscale Storage Server Regional Market Share
Geographic Coverage of Hyperscale Storage Server
Hyperscale Storage Server REPORT HIGHLIGHTS
| Aspects | Details |
|---|---|
| Study Period | 2020-2034 |
| Base Year | 2025 |
| Estimated Year | 2026 |
| Forecast Period | 2026-2034 |
| Historical Period | 2020-2025 |
| Growth Rate | CAGR of 14.8% from 2020-2034 |
| Segmentation |
|
Table of Contents
- 1. Introduction
- 1.1. Research Scope
- 1.2. Market Segmentation
- 1.3. Research Objective
- 1.4. Definitions and Assumptions
- 2. Executive Summary
- 2.1. Market Snapshot
- 3. Market Dynamics
- 3.1. Market Drivers
- 3.2. Market Restrains
- 3.3. Market Trends
- 3.4. Market Opportunities
- 4. Market Factor Analysis
- 4.1. Porters Five Forces
- 4.1.1. Bargaining Power of Suppliers
- 4.1.2. Bargaining Power of Buyers
- 4.1.3. Threat of New Entrants
- 4.1.4. Threat of Substitutes
- 4.1.5. Competitive Rivalry
- 4.2. PESTEL analysis
- 4.3. BCG Analysis
- 4.3.1. Stars (High Growth, High Market Share)
- 4.3.2. Cash Cows (Low Growth, High Market Share)
- 4.3.3. Question Mark (High Growth, Low Market Share)
- 4.3.4. Dogs (Low Growth, Low Market Share)
- 4.4. Ansoff Matrix Analysis
- 4.5. Supply Chain Analysis
- 4.6. Regulatory Landscape
- 4.7. Current Market Potential and Opportunity Assessment (TAM–SAM–SOM Framework)
- 4.8. DMV Analyst Note
- 4.1. Porters Five Forces
- 5. Market Analysis, Insights and Forecast 2021-2033
- 5.1. Market Analysis, Insights and Forecast - by Application
- 5.1.1. Enterprise Data Management
- 5.1.2. Cloud Computing and Virtualization
- 5.1.3. Big Data and AI Analysis
- 5.1.4. Financial And Government Applications
- 5.1.5. Other
- 5.2. Market Analysis, Insights and Forecast - by Type
- 5.2.1. SAN (Storage Area Network) Storage
- 5.2.2. SAN (Storage Area Network) Storage
- 5.2.3. DAS (Direct Attached Storage) Storage
- 5.2.4. Software Defined Storage (SDS)
- 5.3. Market Analysis, Insights and Forecast - by Region
- 5.3.1. North America
- 5.3.2. South America
- 5.3.3. Europe
- 5.3.4. Middle East & Africa
- 5.3.5. Asia Pacific
- 5.1. Market Analysis, Insights and Forecast - by Application
- 6. Global Hyperscale Storage Server Analysis, Insights and Forecast, 2021-2033
- 6.1. Market Analysis, Insights and Forecast - by Application
- 6.1.1. Enterprise Data Management
- 6.1.2. Cloud Computing and Virtualization
- 6.1.3. Big Data and AI Analysis
- 6.1.4. Financial And Government Applications
- 6.1.5. Other
- 6.2. Market Analysis, Insights and Forecast - by Type
- 6.2.1. SAN (Storage Area Network) Storage
- 6.2.2. SAN (Storage Area Network) Storage
- 6.2.3. DAS (Direct Attached Storage) Storage
- 6.2.4. Software Defined Storage (SDS)
- 6.1. Market Analysis, Insights and Forecast - by Application
- 7. North America Hyperscale Storage Server Analysis, Insights and Forecast, 2020-2032
- 7.1. Market Analysis, Insights and Forecast - by Application
- 7.1.1. Enterprise Data Management
- 7.1.2. Cloud Computing and Virtualization
- 7.1.3. Big Data and AI Analysis
- 7.1.4. Financial And Government Applications
- 7.1.5. Other
- 7.2. Market Analysis, Insights and Forecast - by Type
- 7.2.1. SAN (Storage Area Network) Storage
- 7.2.2. SAN (Storage Area Network) Storage
- 7.2.3. DAS (Direct Attached Storage) Storage
- 7.2.4. Software Defined Storage (SDS)
- 7.1. Market Analysis, Insights and Forecast - by Application
- 8. South America Hyperscale Storage Server Analysis, Insights and Forecast, 2020-2032
- 8.1. Market Analysis, Insights and Forecast - by Application
- 8.1.1. Enterprise Data Management
- 8.1.2. Cloud Computing and Virtualization
- 8.1.3. Big Data and AI Analysis
- 8.1.4. Financial And Government Applications
- 8.1.5. Other
- 8.2. Market Analysis, Insights and Forecast - by Type
- 8.2.1. SAN (Storage Area Network) Storage
- 8.2.2. SAN (Storage Area Network) Storage
- 8.2.3. DAS (Direct Attached Storage) Storage
- 8.2.4. Software Defined Storage (SDS)
- 8.1. Market Analysis, Insights and Forecast - by Application
- 9. Europe Hyperscale Storage Server Analysis, Insights and Forecast, 2020-2032
- 9.1. Market Analysis, Insights and Forecast - by Application
- 9.1.1. Enterprise Data Management
- 9.1.2. Cloud Computing and Virtualization
- 9.1.3. Big Data and AI Analysis
- 9.1.4. Financial And Government Applications
- 9.1.5. Other
- 9.2. Market Analysis, Insights and Forecast - by Type
- 9.2.1. SAN (Storage Area Network) Storage
- 9.2.2. SAN (Storage Area Network) Storage
- 9.2.3. DAS (Direct Attached Storage) Storage
- 9.2.4. Software Defined Storage (SDS)
- 9.1. Market Analysis, Insights and Forecast - by Application
- 10. Middle East & Africa Hyperscale Storage Server Analysis, Insights and Forecast, 2020-2032
- 10.1. Market Analysis, Insights and Forecast - by Application
- 10.1.1. Enterprise Data Management
- 10.1.2. Cloud Computing and Virtualization
- 10.1.3. Big Data and AI Analysis
- 10.1.4. Financial And Government Applications
- 10.1.5. Other
- 10.2. Market Analysis, Insights and Forecast - by Type
- 10.2.1. SAN (Storage Area Network) Storage
- 10.2.2. SAN (Storage Area Network) Storage
- 10.2.3. DAS (Direct Attached Storage) Storage
- 10.2.4. Software Defined Storage (SDS)
- 10.1. Market Analysis, Insights and Forecast - by Application
- 11. Asia Pacific Hyperscale Storage Server Analysis, Insights and Forecast, 2020-2032
- 11.1. Market Analysis, Insights and Forecast - by Application
- 11.1.1. Enterprise Data Management
- 11.1.2. Cloud Computing and Virtualization
- 11.1.3. Big Data and AI Analysis
- 11.1.4. Financial And Government Applications
- 11.1.5. Other
- 11.2. Market Analysis, Insights and Forecast - by Type
- 11.2.1. SAN (Storage Area Network) Storage
- 11.2.2. SAN (Storage Area Network) Storage
- 11.2.3. DAS (Direct Attached Storage) Storage
- 11.2.4. Software Defined Storage (SDS)
- 11.1. Market Analysis, Insights and Forecast - by Application
- 12. Competitive Analysis
- 12.1. Company Profiles
- 12.1.1 Dell Technologies
- 12.1.1.1. Company Overview
- 12.1.1.2. Products
- 12.1.1.3. Company Financials
- 12.1.1.4. SWOT Analysis
- 12.1.2 Hewlett Packard Enterprise
- 12.1.2.1. Company Overview
- 12.1.2.2. Products
- 12.1.2.3. Company Financials
- 12.1.2.4. SWOT Analysis
- 12.1.3 IBM
- 12.1.3.1. Company Overview
- 12.1.3.2. Products
- 12.1.3.3. Company Financials
- 12.1.3.4. SWOT Analysis
- 12.1.4 NetApp
- 12.1.4.1. Company Overview
- 12.1.4.2. Products
- 12.1.4.3. Company Financials
- 12.1.4.4. SWOT Analysis
- 12.1.5 Hitachi Vantara
- 12.1.5.1. Company Overview
- 12.1.5.2. Products
- 12.1.5.3. Company Financials
- 12.1.5.4. SWOT Analysis
- 12.1.6 Huawei
- 12.1.6.1. Company Overview
- 12.1.6.2. Products
- 12.1.6.3. Company Financials
- 12.1.6.4. SWOT Analysis
- 12.1.7 Inspur
- 12.1.7.1. Company Overview
- 12.1.7.2. Products
- 12.1.7.3. Company Financials
- 12.1.7.4. SWOT Analysis
- 12.1.8 H3C
- 12.1.8.1. Company Overview
- 12.1.8.2. Products
- 12.1.8.3. Company Financials
- 12.1.8.4. SWOT Analysis
- 12.1.9 Infore Storage
- 12.1.9.1. Company Overview
- 12.1.9.2. Products
- 12.1.9.3. Company Financials
- 12.1.9.4. SWOT Analysis
- 12.1.10 Nutanix
- 12.1.10.1. Company Overview
- 12.1.10.2. Products
- 12.1.10.3. Company Financials
- 12.1.10.4. SWOT Analysis
- 12.1.11 EMC Corporation
- 12.1.11.1. Company Overview
- 12.1.11.2. Products
- 12.1.11.3. Company Financials
- 12.1.11.4. SWOT Analysis
- 12.1.12 Citrix Systems
- 12.1.12.1. Company Overview
- 12.1.12.2. Products
- 12.1.12.3. Company Financials
- 12.1.12.4. SWOT Analysis
- 12.1.13 Datacore
- 12.1.13.1. Company Overview
- 12.1.13.2. Products
- 12.1.13.3. Company Financials
- 12.1.13.4. SWOT Analysis
- 12.1.14 Scale Computing
- 12.1.14.1. Company Overview
- 12.1.14.2. Products
- 12.1.14.3. Company Financials
- 12.1.14.4. SWOT Analysis
- 12.1.15 Simplivity
- 12.1.15.1. Company Overview
- 12.1.15.2. Products
- 12.1.15.3. Company Financials
- 12.1.15.4. SWOT Analysis
- 12.1.16 Stormagic
- 12.1.16.1. Company Overview
- 12.1.16.2. Products
- 12.1.16.3. Company Financials
- 12.1.16.4. SWOT Analysis
- 12.1.17 Nexenta
- 12.1.17.1. Company Overview
- 12.1.17.2. Products
- 12.1.17.3. Company Financials
- 12.1.17.4. SWOT Analysis
- 12.1.1 Dell Technologies
- 12.2. Market Entropy
- 12.2.1 Company's Key Areas Served
- 12.2.2 Recent Developments
- 12.3. Company Market Share Analysis 2025
- 12.3.1 Top 5 Companies Market Share Analysis
- 12.3.2 Top 3 Companies Market Share Analysis
- 12.4. List of Potential Customers
- 13. Research Methodology
List of Figures
- Figure 1: Global Hyperscale Storage Server Revenue Breakdown (million, %) by Region 2025 & 2033
- Figure 2: North America Hyperscale Storage Server Revenue (million), by Application 2025 & 2033
- Figure 3: North America Hyperscale Storage Server Revenue Share (%), by Application 2025 & 2033
- Figure 4: North America Hyperscale Storage Server Revenue (million), by Type 2025 & 2033
- Figure 5: North America Hyperscale Storage Server Revenue Share (%), by Type 2025 & 2033
- Figure 6: North America Hyperscale Storage Server Revenue (million), by Country 2025 & 2033
- Figure 7: North America Hyperscale Storage Server Revenue Share (%), by Country 2025 & 2033
- Figure 8: South America Hyperscale Storage Server Revenue (million), by Application 2025 & 2033
- Figure 9: South America Hyperscale Storage Server Revenue Share (%), by Application 2025 & 2033
- Figure 10: South America Hyperscale Storage Server Revenue (million), by Type 2025 & 2033
- Figure 11: South America Hyperscale Storage Server Revenue Share (%), by Type 2025 & 2033
- Figure 12: South America Hyperscale Storage Server Revenue (million), by Country 2025 & 2033
- Figure 13: South America Hyperscale Storage Server Revenue Share (%), by Country 2025 & 2033
- Figure 14: Europe Hyperscale Storage Server Revenue (million), by Application 2025 & 2033
- Figure 15: Europe Hyperscale Storage Server Revenue Share (%), by Application 2025 & 2033
- Figure 16: Europe Hyperscale Storage Server Revenue (million), by Type 2025 & 2033
- Figure 17: Europe Hyperscale Storage Server Revenue Share (%), by Type 2025 & 2033
- Figure 18: Europe Hyperscale Storage Server Revenue (million), by Country 2025 & 2033
- Figure 19: Europe Hyperscale Storage Server Revenue Share (%), by Country 2025 & 2033
- Figure 20: Middle East & Africa Hyperscale Storage Server Revenue (million), by Application 2025 & 2033
- Figure 21: Middle East & Africa Hyperscale Storage Server Revenue Share (%), by Application 2025 & 2033
- Figure 22: Middle East & Africa Hyperscale Storage Server Revenue (million), by Type 2025 & 2033
- Figure 23: Middle East & Africa Hyperscale Storage Server Revenue Share (%), by Type 2025 & 2033
- Figure 24: Middle East & Africa Hyperscale Storage Server Revenue (million), by Country 2025 & 2033
- Figure 25: Middle East & Africa Hyperscale Storage Server Revenue Share (%), by Country 2025 & 2033
- Figure 26: Asia Pacific Hyperscale Storage Server Revenue (million), by Application 2025 & 2033
- Figure 27: Asia Pacific Hyperscale Storage Server Revenue Share (%), by Application 2025 & 2033
- Figure 28: Asia Pacific Hyperscale Storage Server Revenue (million), by Type 2025 & 2033
- Figure 29: Asia Pacific Hyperscale Storage Server Revenue Share (%), by Type 2025 & 2033
- Figure 30: Asia Pacific Hyperscale Storage Server Revenue (million), by Country 2025 & 2033
- Figure 31: Asia Pacific Hyperscale Storage Server Revenue Share (%), by Country 2025 & 2033
List of Tables
- Table 1: Global Hyperscale Storage Server Revenue million Forecast, by Application 2020 & 2033
- Table 2: Global Hyperscale Storage Server Revenue million Forecast, by Type 2020 & 2033
- Table 3: Global Hyperscale Storage Server Revenue million Forecast, by Region 2020 & 2033
- Table 4: Global Hyperscale Storage Server Revenue million Forecast, by Application 2020 & 2033
- Table 5: Global Hyperscale Storage Server Revenue million Forecast, by Type 2020 & 2033
- Table 6: Global Hyperscale Storage Server Revenue million Forecast, by Country 2020 & 2033
- Table 7: United States Hyperscale Storage Server Revenue (million) Forecast, by Application 2020 & 2033
- Table 8: Canada Hyperscale Storage Server Revenue (million) Forecast, by Application 2020 & 2033
- Table 9: Mexico Hyperscale Storage Server Revenue (million) Forecast, by Application 2020 & 2033
- Table 10: Global Hyperscale Storage Server Revenue million Forecast, by Application 2020 & 2033
- Table 11: Global Hyperscale Storage Server Revenue million Forecast, by Type 2020 & 2033
- Table 12: Global Hyperscale Storage Server Revenue million Forecast, by Country 2020 & 2033
- Table 13: Brazil Hyperscale Storage Server Revenue (million) Forecast, by Application 2020 & 2033
- Table 14: Argentina Hyperscale Storage Server Revenue (million) Forecast, by Application 2020 & 2033
- Table 15: Rest of South America Hyperscale Storage Server Revenue (million) Forecast, by Application 2020 & 2033
- Table 16: Global Hyperscale Storage Server Revenue million Forecast, by Application 2020 & 2033
- Table 17: Global Hyperscale Storage Server Revenue million Forecast, by Type 2020 & 2033
- Table 18: Global Hyperscale Storage Server Revenue million Forecast, by Country 2020 & 2033
- Table 19: United Kingdom Hyperscale Storage Server Revenue (million) Forecast, by Application 2020 & 2033
- Table 20: Germany Hyperscale Storage Server Revenue (million) Forecast, by Application 2020 & 2033
- Table 21: France Hyperscale Storage Server Revenue (million) Forecast, by Application 2020 & 2033
- Table 22: Italy Hyperscale Storage Server Revenue (million) Forecast, by Application 2020 & 2033
- Table 23: Spain Hyperscale Storage Server Revenue (million) Forecast, by Application 2020 & 2033
- Table 24: Russia Hyperscale Storage Server Revenue (million) Forecast, by Application 2020 & 2033
- Table 25: Benelux Hyperscale Storage Server Revenue (million) Forecast, by Application 2020 & 2033
- Table 26: Nordics Hyperscale Storage Server Revenue (million) Forecast, by Application 2020 & 2033
- Table 27: Rest of Europe Hyperscale Storage Server Revenue (million) Forecast, by Application 2020 & 2033
- Table 28: Global Hyperscale Storage Server Revenue million Forecast, by Application 2020 & 2033
- Table 29: Global Hyperscale Storage Server Revenue million Forecast, by Type 2020 & 2033
- Table 30: Global Hyperscale Storage Server Revenue million Forecast, by Country 2020 & 2033
- Table 31: Turkey Hyperscale Storage Server Revenue (million) Forecast, by Application 2020 & 2033
- Table 32: Israel Hyperscale Storage Server Revenue (million) Forecast, by Application 2020 & 2033
- Table 33: GCC Hyperscale Storage Server Revenue (million) Forecast, by Application 2020 & 2033
- Table 34: North Africa Hyperscale Storage Server Revenue (million) Forecast, by Application 2020 & 2033
- Table 35: South Africa Hyperscale Storage Server Revenue (million) Forecast, by Application 2020 & 2033
- Table 36: Rest of Middle East & Africa Hyperscale Storage Server Revenue (million) Forecast, by Application 2020 & 2033
- Table 37: Global Hyperscale Storage Server Revenue million Forecast, by Application 2020 & 2033
- Table 38: Global Hyperscale Storage Server Revenue million Forecast, by Type 2020 & 2033
- Table 39: Global Hyperscale Storage Server Revenue million Forecast, by Country 2020 & 2033
- Table 40: China Hyperscale Storage Server Revenue (million) Forecast, by Application 2020 & 2033
- Table 41: India Hyperscale Storage Server Revenue (million) Forecast, by Application 2020 & 2033
- Table 42: Japan Hyperscale Storage Server Revenue (million) Forecast, by Application 2020 & 2033
- Table 43: South Korea Hyperscale Storage Server Revenue (million) Forecast, by Application 2020 & 2033
- Table 44: ASEAN Hyperscale Storage Server Revenue (million) Forecast, by Application 2020 & 2033
- Table 45: Oceania Hyperscale Storage Server Revenue (million) Forecast, by Application 2020 & 2033
- Table 46: Rest of Asia Pacific Hyperscale Storage Server Revenue (million) Forecast, by Application 2020 & 2033
Frequently Asked Questions
1. What is the projected Compound Annual Growth Rate (CAGR) of the Hyperscale Storage Server?
The projected CAGR is approximately 14.8%.
2. Which companies are prominent players in the Hyperscale Storage Server?
Key companies in the market include Dell Technologies, Hewlett Packard Enterprise, IBM, NetApp, Hitachi Vantara, Huawei, Inspur, H3C, Infore Storage, Nutanix, EMC Corporation, Citrix Systems, Datacore, Scale Computing, Simplivity, Stormagic, Nexenta.
3. What are the main segments of the Hyperscale Storage Server?
The market segments include Application, Type.
4. Can you provide details about the market size?
The market size is estimated to be USD 23410 million as of 2022.
5. What are some drivers contributing to market growth?
N/A
6. What are the notable trends driving market growth?
N/A
7. Are there any restraints impacting market growth?
N/A
8. Can you provide examples of recent developments in the market?
N/A
9. What pricing options are available for accessing the report?
Pricing options include single-user, multi-user, and enterprise licenses priced at USD 4250.00, USD 6375.00, and USD 8500.00 respectively.
10. Is the market size provided in terms of value or volume?
The market size is provided in terms of value, measured in million.
11. Are there any specific market keywords associated with the report?
Yes, the market keyword associated with the report is "Hyperscale Storage Server," which aids in identifying and referencing the specific market segment covered.
12. How do I determine which pricing option suits my needs best?
The pricing options vary based on user requirements and access needs. Individual users may opt for single-user licenses, while businesses requiring broader access may choose multi-user or enterprise licenses for cost-effective access to the report.
13. Are there any additional resources or data provided in the Hyperscale Storage Server report?
While the report offers comprehensive insights, it's advisable to review the specific contents or supplementary materials provided to ascertain if additional resources or data are available.
14. How can I stay updated on further developments or reports in the Hyperscale Storage Server?
To stay informed about further developments, trends, and reports in the Hyperscale Storage Server, consider subscribing to industry newsletters, following relevant companies and organizations, or regularly checking reputable industry news sources and publications.
Methodology
Step 1 - Identification of Relevant Samples Size from Population Database


Step 2 - Approaches for Defining Global Market Size (Value, Volume* & Price*)

Note*: In applicable scenarios
Step 3 - Data Sources
Primary Research
- Web Analytics
- Survey Reports
- Research Institute
- Latest Research Reports
- Opinion Leaders
Secondary Research
- Annual Reports
- White Paper
- Latest Press Release
- Industry Association
- Paid Database
- Investor Presentations

Step 4 - Data Triangulation
Involves using different sources of information in order to increase the validity of a study
These sources are likely to be stakeholders in a program - participants, other researchers, program staff, other community members, and so on.
Then we put all data in single framework & apply various statistical tools to find out the dynamic on the market.
During the analysis stage, feedback from the stakeholder groups would be compared to determine areas of agreement as well as areas of divergence