

Key Insights
The global Hydrostatic Pressure Testing Service market is poised for significant expansion, projected to reach an estimated $850 million by 2025, with a compound annual growth rate (CAGR) of 6% during the forecast period of 2025-2033. This robust growth is underpinned by a confluence of escalating industrial activities and stringent safety regulations across vital sectors such as oil and gas, chemical, and construction. The increasing demand for the safe and reliable operation of pipelines, pressure vessels, and other critical infrastructure necessitates frequent and thorough hydrostatic pressure testing. This fundamental service ensures the integrity of these assets, preventing catastrophic failures and minimizing operational risks, thereby directly contributing to the market's upward trajectory. Furthermore, ongoing infrastructure development projects worldwide, particularly in emerging economies, are creating a substantial demand for these specialized testing services.
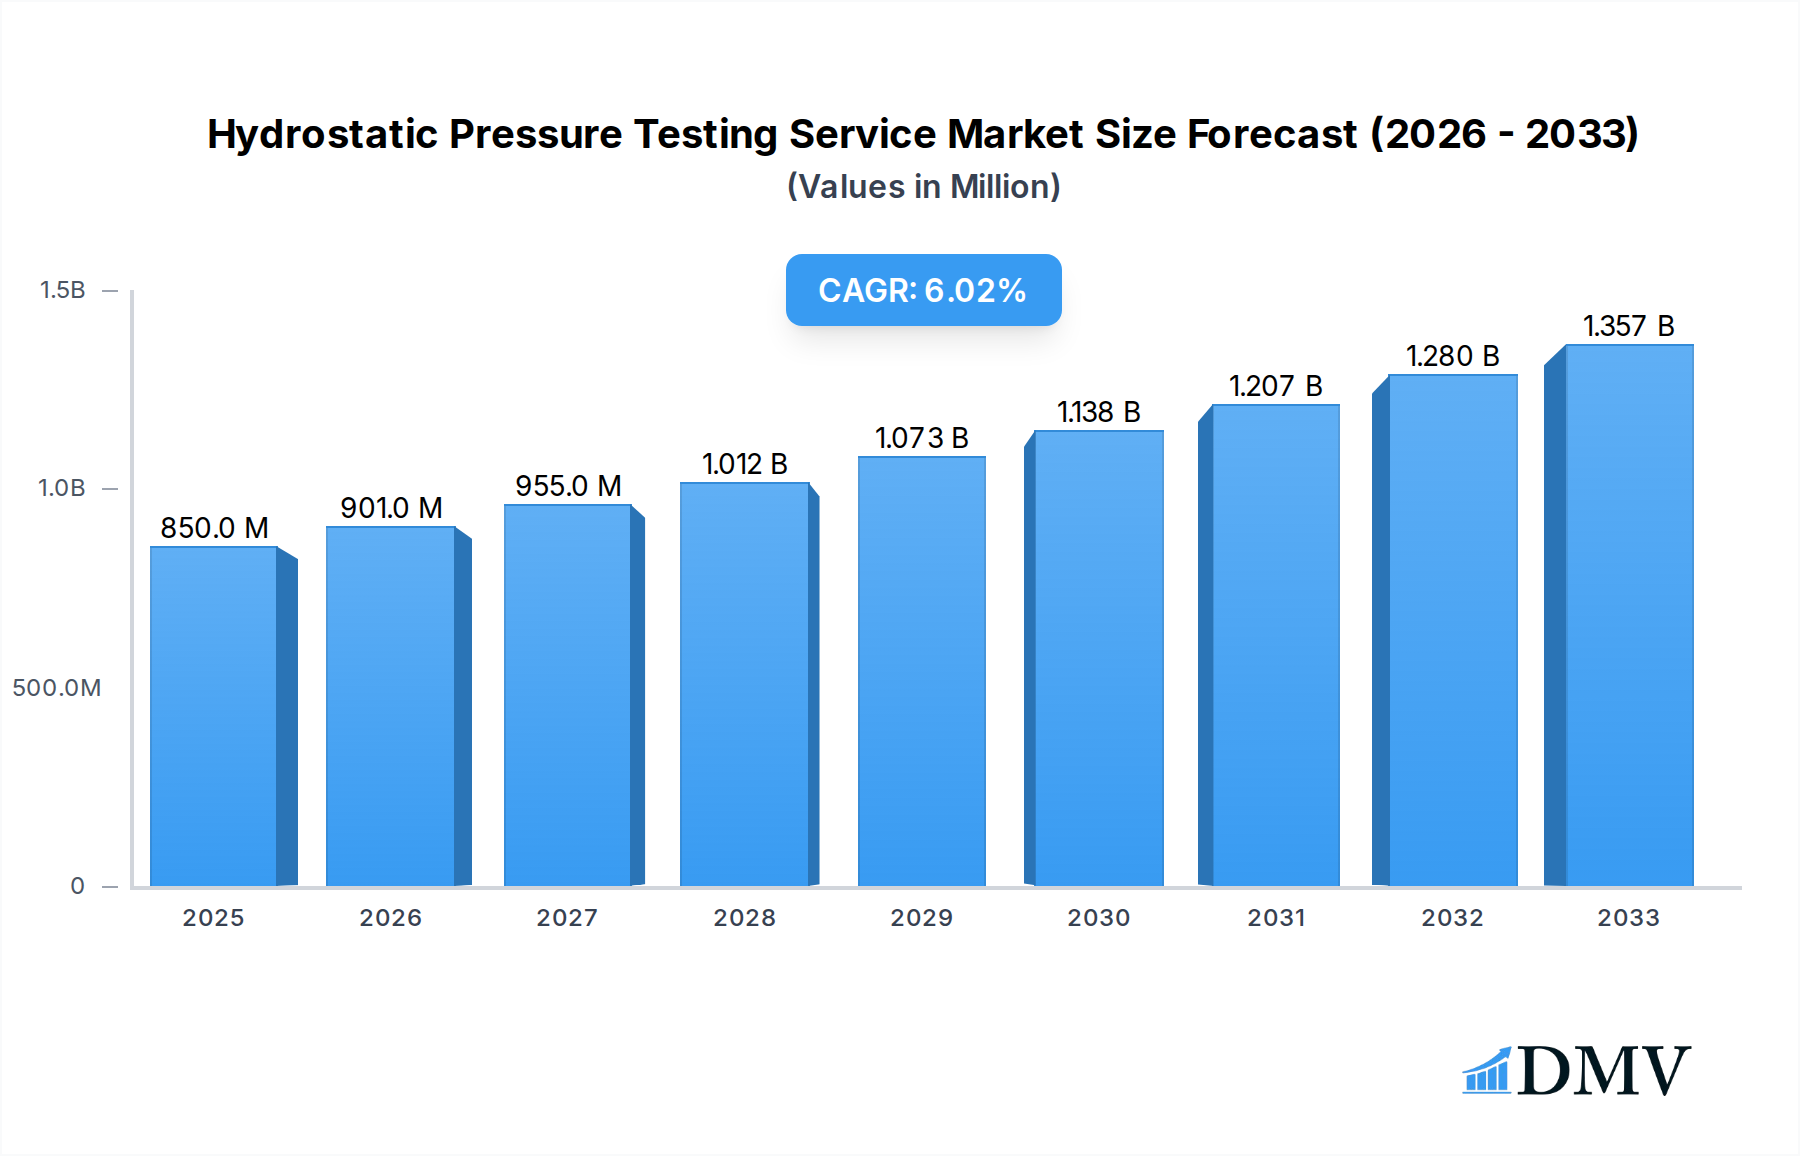
Hydrostatic Pressure Testing Service Market Size (In Million)
Key drivers fueling this market include the growing emphasis on asset integrity management and the proactive adoption of preventative maintenance strategies by industries. The rising complexity of industrial processes and the inherent risks associated with high-pressure systems further amplify the need for certified hydrostatic pressure testing to comply with international safety standards. Emerging trends such as the integration of digital technologies for enhanced data analysis and reporting, along with the development of more efficient and portable testing equipment, are expected to streamline operations and improve cost-effectiveness for service providers. While the market demonstrates strong growth potential, potential restraints such as the high initial investment in specialized equipment and the need for skilled personnel could present challenges. However, the imperative of safety and operational efficiency is expected to outweigh these concerns, ensuring a sustained and healthy expansion of the hydrostatic pressure testing service market.

Hydrostatic Pressure Testing Service Company Market Share
The global hydrostatic pressure testing service market exhibits a moderate to high degree of fragmentation, with key players including Applied Technical Services, Well Services Group, NiGen, Laboratory Testing, Meyer Tool & Mfg, Hennigan Engineering, NCS Fluid Handling Systems, ROC Service Company, Astro Pak, Energy Services International, Haskel, Littlestown Foundry, and Turner Hydraulic Group. Innovation is a significant catalyst, driven by the continuous need for enhanced safety, regulatory compliance, and operational efficiency across various industries. The regulatory landscape is stringent, particularly in the oil and gas and chemical sectors, mandating rigorous testing protocols to prevent failures and environmental hazards. Substitute products are limited, as hydrostatic testing remains the most effective method for verifying the integrity of pressure vessels, pipelines, and other critical components. End-user profiles are diverse, encompassing major corporations in the oil and gas industry (responsible for an estimated 55% of market share), the chemical sector (estimated 25% market share), construction (estimated 15% market share), and various other industrial applications (estimated 5% market share). Merger and acquisition (M&A) activities are observed, with deal values ranging from an estimated $20 million to $50 million, as larger entities seek to consolidate market presence and expand service offerings. Technological advancements in data acquisition and real-time monitoring are also shaping the market dynamics, enabling more precise and efficient testing procedures.
Hydrostatic Pressure Testing Service Industry Evolution
The hydrostatic pressure testing service industry has witnessed substantial evolution driven by an interplay of technological advancements, stringent safety regulations, and the ever-increasing demands of critical infrastructure maintenance. The study period, from 2019 to 2033, encapsulates a significant transformation in how pressure integrity is assessed. During the historical period (2019-2024), the market experienced a steady growth trajectory, averaging an annual growth rate of approximately 4.5%. This was primarily fueled by the aging infrastructure in the oil and gas sector, necessitating frequent integrity checks and repairs. The base year, 2025, marks a point of continued expansion, with initial projections for the estimated year of 2025 showing a growth rate of 5.2%.
Technological advancements have been a cornerstone of this evolution. Early methods relied on manual monitoring and data recording. However, the forecast period (2025-2033) is set to witness the widespread adoption of advanced digital solutions. These include the integration of sensor technologies for real-time pressure and temperature monitoring, sophisticated data analytics platforms for predictive maintenance, and the utilization of remote monitoring capabilities, reducing the need for on-site personnel in certain scenarios. The adoption rate of these digital solutions is projected to increase from an estimated 30% in 2025 to over 70% by 2033.
Shifting consumer demands are also playing a crucial role. Clients are increasingly seeking cost-effective, efficient, and safer testing solutions. This has pushed service providers to invest in innovative equipment and methodologies that minimize downtime for operational facilities and reduce the risk of catastrophic failures. The emphasis has moved from merely performing tests to providing comprehensive integrity management solutions. The demand for specialized testing services for new and complex materials and applications, particularly in renewable energy infrastructure and advanced manufacturing, is also on the rise. The market's growth trajectory is further influenced by global economic conditions and the capital expenditure cycles within key end-user industries.
Leading Regions, Countries, or Segments in Hydrostatic Pressure Testing Service
The Oil and Gas application segment is demonstrably the dominant force within the hydrostatic pressure testing service market, driven by a confluence of critical factors that underscore its indispensable role in this high-stakes industry. This segment alone accounts for an estimated 55% of the total market share.
- Key Drivers for Oil and Gas Dominance:
- Vast Infrastructure & Aging Assets: The global network of oil and gas exploration, extraction, transportation, and refining infrastructure is immense. A significant portion of this infrastructure is aging, necessitating continuous and rigorous hydrostatic pressure testing to ensure operational safety, prevent costly leaks, and avoid environmental disasters.
- Stringent Regulatory Mandates: Regulatory bodies worldwide impose stringent safety standards for oil and gas operations. Hydrostatic testing is a fundamental requirement for validating the integrity of pipelines, storage tanks, pressure vessels, and wellheads, directly impacting the operational licenses and profitability of companies.
- High Investment Cycles: The oil and gas industry is characterized by substantial capital investments in exploration, production, and maintenance. A considerable portion of these investments is allocated towards ensuring the safety and reliability of assets through regular testing services.
- Risk Aversion: The potential consequences of equipment failure in the oil and gas sector are catastrophic, involving significant financial losses, environmental damage, and human casualties. This inherent risk profile makes robust hydrostatic pressure testing a non-negotiable aspect of operations.
The Types of hydrostatic testing services most prevalent within this dominant segment are Leak Testing and Proof Testing. Leak testing, crucial for identifying minute breaches in pipelines and vessels, is performed with high frequency. Proof testing, which verifies that a component can withstand a specified pressure without permanent deformation or failure, is also a cornerstone of safety protocols.
The regions demonstrating the most significant demand and activity are North America and the Middle East. North America's dominance is fueled by its extensive oil and gas reserves, advanced technological adoption, and robust regulatory framework. The Middle East, with its vast production capacity and ongoing infrastructure development, also presents a substantial market. Investment trends in these regions are consistently high, with a focus on maintaining and upgrading existing facilities alongside new project development.
Hydrostatic Pressure Testing Service Product Innovations
Recent product innovations in hydrostatic pressure testing services are revolutionizing efficiency and safety. Companies are developing advanced portable testing units equipped with integrated digital displays for real-time data logging and analysis, significantly reducing manual intervention and human error. The integration of wireless sensor technology allows for remote monitoring of pressure and temperature, enhancing safety by minimizing personnel exposure to hazardous environments. Furthermore, the development of specialized testing fluids and sealing compounds has improved the effectiveness of leak detection, especially in challenging applications. These innovations contribute to faster turnaround times and more comprehensive integrity assessments for critical infrastructure.
Propelling Factors for Hydrostatic Pressure Testing Service Growth
The growth of the hydrostatic pressure testing service market is propelled by several key factors. A primary driver is the increasing emphasis on asset integrity management and operational safety across industries like oil and gas and chemical manufacturing, where the consequences of failure are severe. Stringent regulatory compliance mandates for pressure equipment necessitate regular and thorough testing. Furthermore, the aging infrastructure in many developed nations requires ongoing maintenance and integrity verification, boosting demand. Technological advancements, such as the development of more precise and portable testing equipment and the integration of digital data acquisition systems, enhance efficiency and reduce downtime, making these services more attractive.
Obstacles in the Hydrostatic Pressure Testing Service Market
Despite robust growth, the hydrostatic pressure testing service market faces several obstacles. High initial investment costs for advanced testing equipment can be a barrier for smaller service providers. Strict regulatory compliance can also be a double-edged sword; while it drives demand, it also imposes significant costs and complexities on service providers to meet evolving standards. Fluctuations in the oil and gas industry, a major end-user segment, can lead to project delays and reduced capital expenditure, impacting demand. Additionally, shortage of skilled technicians capable of operating sophisticated testing equipment and interpreting complex data poses a challenge to service delivery. Supply chain disruptions for specialized testing components can also lead to project delays.
Future Opportunities in Hydrostatic Pressure Testing Service
Emerging opportunities in the hydrostatic pressure testing service market are diverse and promising. The growing focus on renewable energy infrastructure, such as offshore wind farms and hydrogen pipelines, presents a new frontier for pressure testing services. The increasing adoption of smart manufacturing and Industry 4.0 principles opens avenues for integrating advanced data analytics and IoT solutions into testing processes, offering predictive maintenance capabilities. Expansion into emerging economies with developing industrial sectors and infrastructure projects offers significant untapped market potential. Furthermore, the development of non-destructive testing (NDT) techniques that complement hydrostatic testing can create bundled service offerings, enhancing market reach and value proposition.
Major Players in the Hydrostatic Pressure Testing Service Ecosystem
- Applied Technical Services
- Well Services Group
- NiGen
- Laboratory Testing
- Meyer Tool & Mfg
- Hennigan Engineering
- NCS Fluid Handling Systems
- ROC Service Company
- Astro Pak
- Energy Services International
- Haskel
- Littlestown Foundry
- Turner Hydraulic Group
Key Developments in Hydrostatic Pressure Testing Service Industry
- 2024: Introduction of advanced wireless sensors for real-time pressure monitoring in remote offshore operations.
- 2023 (Q4): Launch of a new generation of portable hydrostatic testing units with enhanced data logging capabilities.
- 2023 (Q2): A major acquisition in the North American market, consolidating service offerings and expanding regional coverage.
- 2022: Development of specialized testing protocols for high-pressure hydrogen pipelines in response to the growing hydrogen economy.
- 2021: Increased adoption of cloud-based platforms for managing and analyzing hydrostatic test data.
- 2020: Focus on developing eco-friendly testing fluids to minimize environmental impact.
- 2019: Enhanced integration of AI and machine learning for predictive failure analysis in pressure vessel testing.
Strategic Hydrostatic Pressure Testing Service Market Forecast
The strategic forecast for the hydrostatic pressure testing service market indicates continued robust growth, driven by an unwavering commitment to safety and regulatory compliance. The escalating demand for asset integrity verification in the aging oil and gas infrastructure, coupled with the expansion of chemical processing and construction projects globally, will sustain market momentum. Future growth will be significantly shaped by the integration of digital technologies, including IoT sensors and data analytics, enabling more proactive maintenance and predictive capabilities. The burgeoning renewable energy sector and the increasing need for specialized testing in emerging economies present substantial untapped opportunities. Strategic players will focus on offering comprehensive integrity management solutions, leveraging technological innovation to enhance efficiency and provide greater value to clients.
Hydrostatic Pressure Testing Service Segmentation
-
1. Application
- 1.1. Oil and Gas
- 1.2. Chemical
- 1.3. Construction
- 1.4. Others
-
2. Types
- 2.1. Proof Testing
- 2.2. Burst Testing
- 2.3. Leak Testing
- 2.4. Water Jacket Testing
- 2.5. Others
Hydrostatic Pressure Testing Service Segmentation By Geography
-
1. North America
- 1.1. United States
- 1.2. Canada
- 1.3. Mexico
-
2. South America
- 2.1. Brazil
- 2.2. Argentina
- 2.3. Rest of South America
-
3. Europe
- 3.1. United Kingdom
- 3.2. Germany
- 3.3. France
- 3.4. Italy
- 3.5. Spain
- 3.6. Russia
- 3.7. Benelux
- 3.8. Nordics
- 3.9. Rest of Europe
-
4. Middle East & Africa
- 4.1. Turkey
- 4.2. Israel
- 4.3. GCC
- 4.4. North Africa
- 4.5. South Africa
- 4.6. Rest of Middle East & Africa
-
5. Asia Pacific
- 5.1. China
- 5.2. India
- 5.3. Japan
- 5.4. South Korea
- 5.5. ASEAN
- 5.6. Oceania
- 5.7. Rest of Asia Pacific
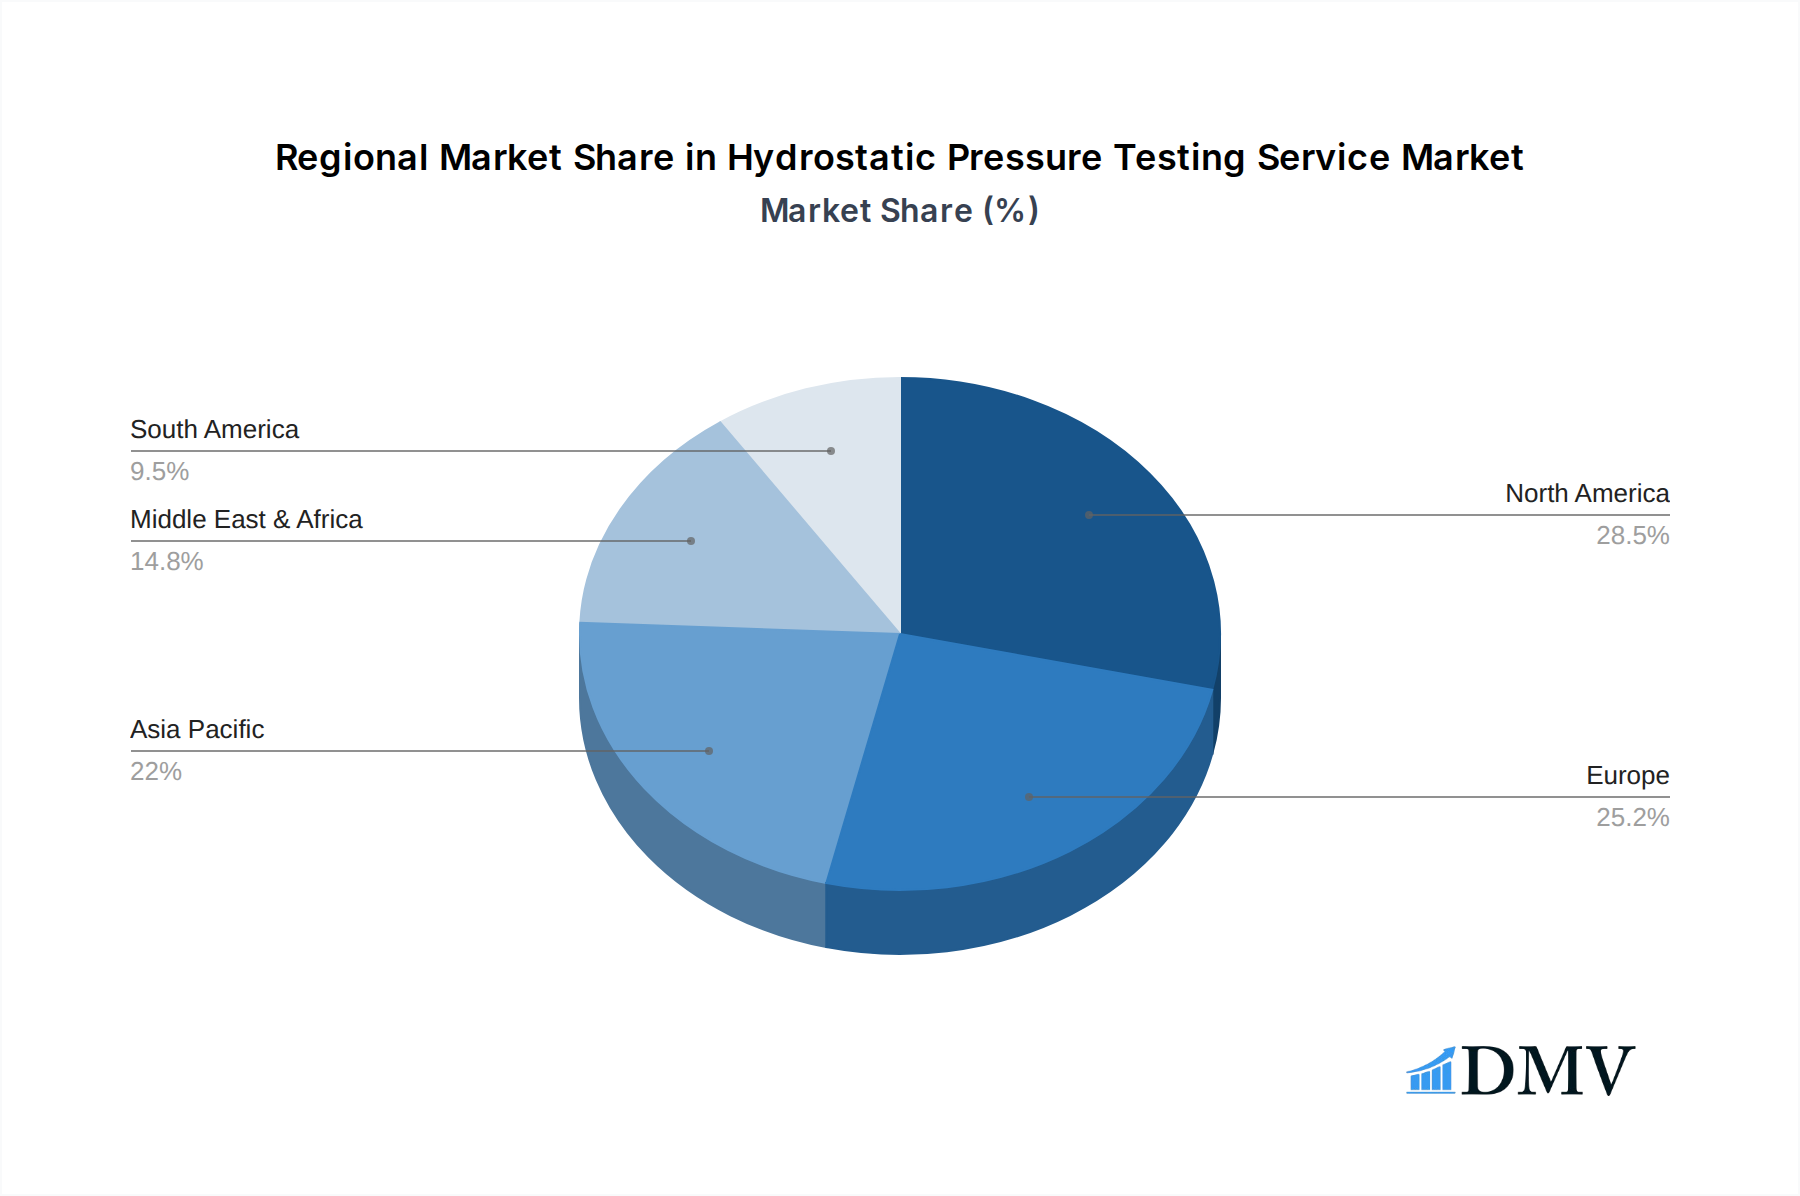
Hydrostatic Pressure Testing Service Regional Market Share
Geographic Coverage of Hydrostatic Pressure Testing Service
Hydrostatic Pressure Testing Service REPORT HIGHLIGHTS
| Aspects | Details |
|---|---|
| Study Period | 2020-2034 |
| Base Year | 2025 |
| Estimated Year | 2026 |
| Forecast Period | 2026-2034 |
| Historical Period | 2020-2025 |
| Growth Rate | CAGR of 6% from 2020-2034 |
| Segmentation |
|
Table of Contents
- 1. Introduction
- 1.1. Research Scope
- 1.2. Market Segmentation
- 1.3. Research Objective
- 1.4. Definitions and Assumptions
- 2. Executive Summary
- 2.1. Market Snapshot
- 3. Market Dynamics
- 3.1. Market Drivers
- 3.2. Market Restrains
- 3.3. Market Trends
- 3.4. Market Opportunities
- 4. Market Factor Analysis
- 4.1. Porters Five Forces
- 4.1.1. Bargaining Power of Suppliers
- 4.1.2. Bargaining Power of Buyers
- 4.1.3. Threat of New Entrants
- 4.1.4. Threat of Substitutes
- 4.1.5. Competitive Rivalry
- 4.2. PESTEL analysis
- 4.3. BCG Analysis
- 4.3.1. Stars (High Growth, High Market Share)
- 4.3.2. Cash Cows (Low Growth, High Market Share)
- 4.3.3. Question Mark (High Growth, Low Market Share)
- 4.3.4. Dogs (Low Growth, Low Market Share)
- 4.4. Ansoff Matrix Analysis
- 4.5. Supply Chain Analysis
- 4.6. Regulatory Landscape
- 4.7. Current Market Potential and Opportunity Assessment (TAM–SAM–SOM Framework)
- 4.8. DMV Analyst Note
- 4.1. Porters Five Forces
- 5. Market Analysis, Insights and Forecast 2021-2033
- 5.1. Market Analysis, Insights and Forecast - by Application
- 5.1.1. Oil and Gas
- 5.1.2. Chemical
- 5.1.3. Construction
- 5.1.4. Others
- 5.2. Market Analysis, Insights and Forecast - by Types
- 5.2.1. Proof Testing
- 5.2.2. Burst Testing
- 5.2.3. Leak Testing
- 5.2.4. Water Jacket Testing
- 5.2.5. Others
- 5.3. Market Analysis, Insights and Forecast - by Region
- 5.3.1. North America
- 5.3.2. South America
- 5.3.3. Europe
- 5.3.4. Middle East & Africa
- 5.3.5. Asia Pacific
- 5.1. Market Analysis, Insights and Forecast - by Application
- 6. Global Hydrostatic Pressure Testing Service Analysis, Insights and Forecast, 2021-2033
- 6.1. Market Analysis, Insights and Forecast - by Application
- 6.1.1. Oil and Gas
- 6.1.2. Chemical
- 6.1.3. Construction
- 6.1.4. Others
- 6.2. Market Analysis, Insights and Forecast - by Types
- 6.2.1. Proof Testing
- 6.2.2. Burst Testing
- 6.2.3. Leak Testing
- 6.2.4. Water Jacket Testing
- 6.2.5. Others
- 6.1. Market Analysis, Insights and Forecast - by Application
- 7. North America Hydrostatic Pressure Testing Service Analysis, Insights and Forecast, 2020-2032
- 7.1. Market Analysis, Insights and Forecast - by Application
- 7.1.1. Oil and Gas
- 7.1.2. Chemical
- 7.1.3. Construction
- 7.1.4. Others
- 7.2. Market Analysis, Insights and Forecast - by Types
- 7.2.1. Proof Testing
- 7.2.2. Burst Testing
- 7.2.3. Leak Testing
- 7.2.4. Water Jacket Testing
- 7.2.5. Others
- 7.1. Market Analysis, Insights and Forecast - by Application
- 8. South America Hydrostatic Pressure Testing Service Analysis, Insights and Forecast, 2020-2032
- 8.1. Market Analysis, Insights and Forecast - by Application
- 8.1.1. Oil and Gas
- 8.1.2. Chemical
- 8.1.3. Construction
- 8.1.4. Others
- 8.2. Market Analysis, Insights and Forecast - by Types
- 8.2.1. Proof Testing
- 8.2.2. Burst Testing
- 8.2.3. Leak Testing
- 8.2.4. Water Jacket Testing
- 8.2.5. Others
- 8.1. Market Analysis, Insights and Forecast - by Application
- 9. Europe Hydrostatic Pressure Testing Service Analysis, Insights and Forecast, 2020-2032
- 9.1. Market Analysis, Insights and Forecast - by Application
- 9.1.1. Oil and Gas
- 9.1.2. Chemical
- 9.1.3. Construction
- 9.1.4. Others
- 9.2. Market Analysis, Insights and Forecast - by Types
- 9.2.1. Proof Testing
- 9.2.2. Burst Testing
- 9.2.3. Leak Testing
- 9.2.4. Water Jacket Testing
- 9.2.5. Others
- 9.1. Market Analysis, Insights and Forecast - by Application
- 10. Middle East & Africa Hydrostatic Pressure Testing Service Analysis, Insights and Forecast, 2020-2032
- 10.1. Market Analysis, Insights and Forecast - by Application
- 10.1.1. Oil and Gas
- 10.1.2. Chemical
- 10.1.3. Construction
- 10.1.4. Others
- 10.2. Market Analysis, Insights and Forecast - by Types
- 10.2.1. Proof Testing
- 10.2.2. Burst Testing
- 10.2.3. Leak Testing
- 10.2.4. Water Jacket Testing
- 10.2.5. Others
- 10.1. Market Analysis, Insights and Forecast - by Application
- 11. Asia Pacific Hydrostatic Pressure Testing Service Analysis, Insights and Forecast, 2020-2032
- 11.1. Market Analysis, Insights and Forecast - by Application
- 11.1.1. Oil and Gas
- 11.1.2. Chemical
- 11.1.3. Construction
- 11.1.4. Others
- 11.2. Market Analysis, Insights and Forecast - by Types
- 11.2.1. Proof Testing
- 11.2.2. Burst Testing
- 11.2.3. Leak Testing
- 11.2.4. Water Jacket Testing
- 11.2.5. Others
- 11.1. Market Analysis, Insights and Forecast - by Application
- 12. Competitive Analysis
- 12.1. Company Profiles
- 12.1.1 Applied Technical Services
- 12.1.1.1. Company Overview
- 12.1.1.2. Products
- 12.1.1.3. Company Financials
- 12.1.1.4. SWOT Analysis
- 12.1.2 Well Services Group
- 12.1.2.1. Company Overview
- 12.1.2.2. Products
- 12.1.2.3. Company Financials
- 12.1.2.4. SWOT Analysis
- 12.1.3 NiGen
- 12.1.3.1. Company Overview
- 12.1.3.2. Products
- 12.1.3.3. Company Financials
- 12.1.3.4. SWOT Analysis
- 12.1.4 Laboratory Testing
- 12.1.4.1. Company Overview
- 12.1.4.2. Products
- 12.1.4.3. Company Financials
- 12.1.4.4. SWOT Analysis
- 12.1.5 Meyer Tool & Mfg
- 12.1.5.1. Company Overview
- 12.1.5.2. Products
- 12.1.5.3. Company Financials
- 12.1.5.4. SWOT Analysis
- 12.1.6 Hennigan Engineering
- 12.1.6.1. Company Overview
- 12.1.6.2. Products
- 12.1.6.3. Company Financials
- 12.1.6.4. SWOT Analysis
- 12.1.7 NCS Fluid Handling Systems
- 12.1.7.1. Company Overview
- 12.1.7.2. Products
- 12.1.7.3. Company Financials
- 12.1.7.4. SWOT Analysis
- 12.1.8 ROC Service Company
- 12.1.8.1. Company Overview
- 12.1.8.2. Products
- 12.1.8.3. Company Financials
- 12.1.8.4. SWOT Analysis
- 12.1.9 Astro Pak
- 12.1.9.1. Company Overview
- 12.1.9.2. Products
- 12.1.9.3. Company Financials
- 12.1.9.4. SWOT Analysis
- 12.1.10 Energy Services International
- 12.1.10.1. Company Overview
- 12.1.10.2. Products
- 12.1.10.3. Company Financials
- 12.1.10.4. SWOT Analysis
- 12.1.11 Haskel
- 12.1.11.1. Company Overview
- 12.1.11.2. Products
- 12.1.11.3. Company Financials
- 12.1.11.4. SWOT Analysis
- 12.1.12 Littlestown Foundry
- 12.1.12.1. Company Overview
- 12.1.12.2. Products
- 12.1.12.3. Company Financials
- 12.1.12.4. SWOT Analysis
- 12.1.13 Turner Hydraulic Group
- 12.1.13.1. Company Overview
- 12.1.13.2. Products
- 12.1.13.3. Company Financials
- 12.1.13.4. SWOT Analysis
- 12.1.1 Applied Technical Services
- 12.2. Market Entropy
- 12.2.1 Company's Key Areas Served
- 12.2.2 Recent Developments
- 12.3. Company Market Share Analysis 2025
- 12.3.1 Top 5 Companies Market Share Analysis
- 12.3.2 Top 3 Companies Market Share Analysis
- 12.4. List of Potential Customers
- 13. Research Methodology
List of Figures
- Figure 1: Global Hydrostatic Pressure Testing Service Revenue Breakdown (million, %) by Region 2025 & 2033
- Figure 2: North America Hydrostatic Pressure Testing Service Revenue (million), by Application 2025 & 2033
- Figure 3: North America Hydrostatic Pressure Testing Service Revenue Share (%), by Application 2025 & 2033
- Figure 4: North America Hydrostatic Pressure Testing Service Revenue (million), by Types 2025 & 2033
- Figure 5: North America Hydrostatic Pressure Testing Service Revenue Share (%), by Types 2025 & 2033
- Figure 6: North America Hydrostatic Pressure Testing Service Revenue (million), by Country 2025 & 2033
- Figure 7: North America Hydrostatic Pressure Testing Service Revenue Share (%), by Country 2025 & 2033
- Figure 8: South America Hydrostatic Pressure Testing Service Revenue (million), by Application 2025 & 2033
- Figure 9: South America Hydrostatic Pressure Testing Service Revenue Share (%), by Application 2025 & 2033
- Figure 10: South America Hydrostatic Pressure Testing Service Revenue (million), by Types 2025 & 2033
- Figure 11: South America Hydrostatic Pressure Testing Service Revenue Share (%), by Types 2025 & 2033
- Figure 12: South America Hydrostatic Pressure Testing Service Revenue (million), by Country 2025 & 2033
- Figure 13: South America Hydrostatic Pressure Testing Service Revenue Share (%), by Country 2025 & 2033
- Figure 14: Europe Hydrostatic Pressure Testing Service Revenue (million), by Application 2025 & 2033
- Figure 15: Europe Hydrostatic Pressure Testing Service Revenue Share (%), by Application 2025 & 2033
- Figure 16: Europe Hydrostatic Pressure Testing Service Revenue (million), by Types 2025 & 2033
- Figure 17: Europe Hydrostatic Pressure Testing Service Revenue Share (%), by Types 2025 & 2033
- Figure 18: Europe Hydrostatic Pressure Testing Service Revenue (million), by Country 2025 & 2033
- Figure 19: Europe Hydrostatic Pressure Testing Service Revenue Share (%), by Country 2025 & 2033
- Figure 20: Middle East & Africa Hydrostatic Pressure Testing Service Revenue (million), by Application 2025 & 2033
- Figure 21: Middle East & Africa Hydrostatic Pressure Testing Service Revenue Share (%), by Application 2025 & 2033
- Figure 22: Middle East & Africa Hydrostatic Pressure Testing Service Revenue (million), by Types 2025 & 2033
- Figure 23: Middle East & Africa Hydrostatic Pressure Testing Service Revenue Share (%), by Types 2025 & 2033
- Figure 24: Middle East & Africa Hydrostatic Pressure Testing Service Revenue (million), by Country 2025 & 2033
- Figure 25: Middle East & Africa Hydrostatic Pressure Testing Service Revenue Share (%), by Country 2025 & 2033
- Figure 26: Asia Pacific Hydrostatic Pressure Testing Service Revenue (million), by Application 2025 & 2033
- Figure 27: Asia Pacific Hydrostatic Pressure Testing Service Revenue Share (%), by Application 2025 & 2033
- Figure 28: Asia Pacific Hydrostatic Pressure Testing Service Revenue (million), by Types 2025 & 2033
- Figure 29: Asia Pacific Hydrostatic Pressure Testing Service Revenue Share (%), by Types 2025 & 2033
- Figure 30: Asia Pacific Hydrostatic Pressure Testing Service Revenue (million), by Country 2025 & 2033
- Figure 31: Asia Pacific Hydrostatic Pressure Testing Service Revenue Share (%), by Country 2025 & 2033
List of Tables
- Table 1: Global Hydrostatic Pressure Testing Service Revenue million Forecast, by Application 2020 & 2033
- Table 2: Global Hydrostatic Pressure Testing Service Revenue million Forecast, by Types 2020 & 2033
- Table 3: Global Hydrostatic Pressure Testing Service Revenue million Forecast, by Region 2020 & 2033
- Table 4: Global Hydrostatic Pressure Testing Service Revenue million Forecast, by Application 2020 & 2033
- Table 5: Global Hydrostatic Pressure Testing Service Revenue million Forecast, by Types 2020 & 2033
- Table 6: Global Hydrostatic Pressure Testing Service Revenue million Forecast, by Country 2020 & 2033
- Table 7: United States Hydrostatic Pressure Testing Service Revenue (million) Forecast, by Application 2020 & 2033
- Table 8: Canada Hydrostatic Pressure Testing Service Revenue (million) Forecast, by Application 2020 & 2033
- Table 9: Mexico Hydrostatic Pressure Testing Service Revenue (million) Forecast, by Application 2020 & 2033
- Table 10: Global Hydrostatic Pressure Testing Service Revenue million Forecast, by Application 2020 & 2033
- Table 11: Global Hydrostatic Pressure Testing Service Revenue million Forecast, by Types 2020 & 2033
- Table 12: Global Hydrostatic Pressure Testing Service Revenue million Forecast, by Country 2020 & 2033
- Table 13: Brazil Hydrostatic Pressure Testing Service Revenue (million) Forecast, by Application 2020 & 2033
- Table 14: Argentina Hydrostatic Pressure Testing Service Revenue (million) Forecast, by Application 2020 & 2033
- Table 15: Rest of South America Hydrostatic Pressure Testing Service Revenue (million) Forecast, by Application 2020 & 2033
- Table 16: Global Hydrostatic Pressure Testing Service Revenue million Forecast, by Application 2020 & 2033
- Table 17: Global Hydrostatic Pressure Testing Service Revenue million Forecast, by Types 2020 & 2033
- Table 18: Global Hydrostatic Pressure Testing Service Revenue million Forecast, by Country 2020 & 2033
- Table 19: United Kingdom Hydrostatic Pressure Testing Service Revenue (million) Forecast, by Application 2020 & 2033
- Table 20: Germany Hydrostatic Pressure Testing Service Revenue (million) Forecast, by Application 2020 & 2033
- Table 21: France Hydrostatic Pressure Testing Service Revenue (million) Forecast, by Application 2020 & 2033
- Table 22: Italy Hydrostatic Pressure Testing Service Revenue (million) Forecast, by Application 2020 & 2033
- Table 23: Spain Hydrostatic Pressure Testing Service Revenue (million) Forecast, by Application 2020 & 2033
- Table 24: Russia Hydrostatic Pressure Testing Service Revenue (million) Forecast, by Application 2020 & 2033
- Table 25: Benelux Hydrostatic Pressure Testing Service Revenue (million) Forecast, by Application 2020 & 2033
- Table 26: Nordics Hydrostatic Pressure Testing Service Revenue (million) Forecast, by Application 2020 & 2033
- Table 27: Rest of Europe Hydrostatic Pressure Testing Service Revenue (million) Forecast, by Application 2020 & 2033
- Table 28: Global Hydrostatic Pressure Testing Service Revenue million Forecast, by Application 2020 & 2033
- Table 29: Global Hydrostatic Pressure Testing Service Revenue million Forecast, by Types 2020 & 2033
- Table 30: Global Hydrostatic Pressure Testing Service Revenue million Forecast, by Country 2020 & 2033
- Table 31: Turkey Hydrostatic Pressure Testing Service Revenue (million) Forecast, by Application 2020 & 2033
- Table 32: Israel Hydrostatic Pressure Testing Service Revenue (million) Forecast, by Application 2020 & 2033
- Table 33: GCC Hydrostatic Pressure Testing Service Revenue (million) Forecast, by Application 2020 & 2033
- Table 34: North Africa Hydrostatic Pressure Testing Service Revenue (million) Forecast, by Application 2020 & 2033
- Table 35: South Africa Hydrostatic Pressure Testing Service Revenue (million) Forecast, by Application 2020 & 2033
- Table 36: Rest of Middle East & Africa Hydrostatic Pressure Testing Service Revenue (million) Forecast, by Application 2020 & 2033
- Table 37: Global Hydrostatic Pressure Testing Service Revenue million Forecast, by Application 2020 & 2033
- Table 38: Global Hydrostatic Pressure Testing Service Revenue million Forecast, by Types 2020 & 2033
- Table 39: Global Hydrostatic Pressure Testing Service Revenue million Forecast, by Country 2020 & 2033
- Table 40: China Hydrostatic Pressure Testing Service Revenue (million) Forecast, by Application 2020 & 2033
- Table 41: India Hydrostatic Pressure Testing Service Revenue (million) Forecast, by Application 2020 & 2033
- Table 42: Japan Hydrostatic Pressure Testing Service Revenue (million) Forecast, by Application 2020 & 2033
- Table 43: South Korea Hydrostatic Pressure Testing Service Revenue (million) Forecast, by Application 2020 & 2033
- Table 44: ASEAN Hydrostatic Pressure Testing Service Revenue (million) Forecast, by Application 2020 & 2033
- Table 45: Oceania Hydrostatic Pressure Testing Service Revenue (million) Forecast, by Application 2020 & 2033
- Table 46: Rest of Asia Pacific Hydrostatic Pressure Testing Service Revenue (million) Forecast, by Application 2020 & 2033
Frequently Asked Questions
1. What is the projected Compound Annual Growth Rate (CAGR) of the Hydrostatic Pressure Testing Service?
The projected CAGR is approximately 6%.
2. Which companies are prominent players in the Hydrostatic Pressure Testing Service?
Key companies in the market include Applied Technical Services, Well Services Group, NiGen, Laboratory Testing, Meyer Tool & Mfg, Hennigan Engineering, NCS Fluid Handling Systems, ROC Service Company, Astro Pak, Energy Services International, Haskel, Littlestown Foundry, Turner Hydraulic Group.
3. What are the main segments of the Hydrostatic Pressure Testing Service?
The market segments include Application, Types.
4. Can you provide details about the market size?
The market size is estimated to be USD 850 million as of 2022.
5. What are some drivers contributing to market growth?
N/A
6. What are the notable trends driving market growth?
N/A
7. Are there any restraints impacting market growth?
N/A
8. Can you provide examples of recent developments in the market?
N/A
9. What pricing options are available for accessing the report?
Pricing options include single-user, multi-user, and enterprise licenses priced at USD 3950.00, USD 5925.00, and USD 7900.00 respectively.
10. Is the market size provided in terms of value or volume?
The market size is provided in terms of value, measured in million.
11. Are there any specific market keywords associated with the report?
Yes, the market keyword associated with the report is "Hydrostatic Pressure Testing Service," which aids in identifying and referencing the specific market segment covered.
12. How do I determine which pricing option suits my needs best?
The pricing options vary based on user requirements and access needs. Individual users may opt for single-user licenses, while businesses requiring broader access may choose multi-user or enterprise licenses for cost-effective access to the report.
13. Are there any additional resources or data provided in the Hydrostatic Pressure Testing Service report?
While the report offers comprehensive insights, it's advisable to review the specific contents or supplementary materials provided to ascertain if additional resources or data are available.
14. How can I stay updated on further developments or reports in the Hydrostatic Pressure Testing Service?
To stay informed about further developments, trends, and reports in the Hydrostatic Pressure Testing Service, consider subscribing to industry newsletters, following relevant companies and organizations, or regularly checking reputable industry news sources and publications.
Methodology
Step 1 - Identification of Relevant Samples Size from Population Database


Step 2 - Approaches for Defining Global Market Size (Value, Volume* & Price*)

Note*: In applicable scenarios
Step 3 - Data Sources
Primary Research
- Web Analytics
- Survey Reports
- Research Institute
- Latest Research Reports
- Opinion Leaders
Secondary Research
- Annual Reports
- White Paper
- Latest Press Release
- Industry Association
- Paid Database
- Investor Presentations

Step 4 - Data Triangulation
Involves using different sources of information in order to increase the validity of a study
These sources are likely to be stakeholders in a program - participants, other researchers, program staff, other community members, and so on.
Then we put all data in single framework & apply various statistical tools to find out the dynamic on the market.
During the analysis stage, feedback from the stakeholder groups would be compared to determine areas of agreement as well as areas of divergence