

Key Insights
The global High Voltage Connector market is projected for substantial growth, anticipated to reach $9.3 billion by 2025. This expansion is driven by a robust Compound Annual Growth Rate (CAGR) of 13.31% between 2025 and 2033. Key growth catalysts include the burgeoning electric vehicle (EV) sector, which necessitates advanced, high-voltage connectors for enhanced safety and performance. Innovations in battery technology and charging infrastructure further amplify this demand.
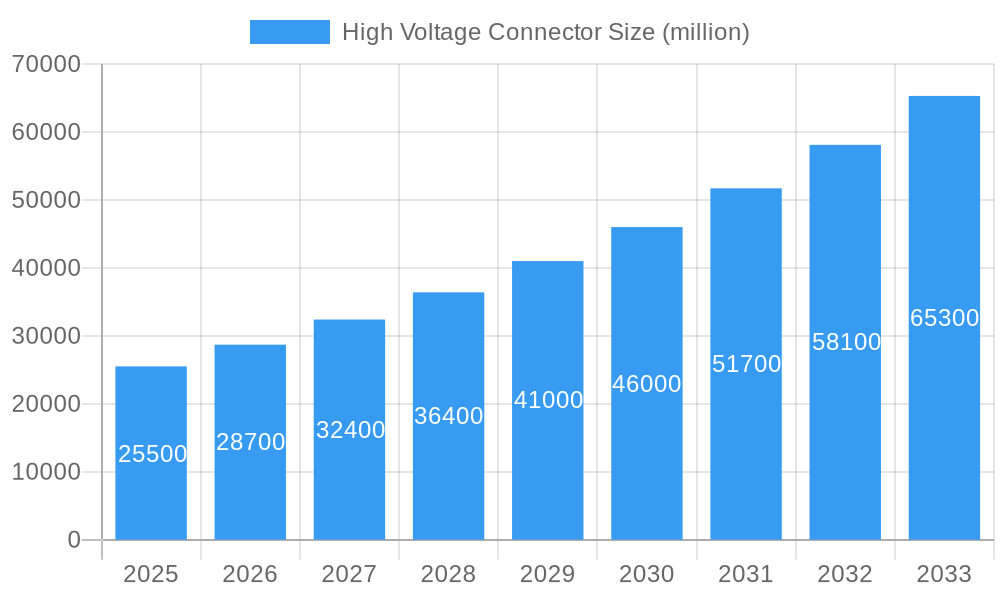
High Voltage Connector Market Size (In Billion)
The communication sector, with the ongoing rollout of 5G and expansion of data centers, also presents significant growth opportunities. The increasing power demands of network infrastructure require reliable high-voltage connectors. Additionally, the renewable energy sector, encompassing wind and solar power, depends on these connectors for efficient power transmission and grid integration. Potential market challenges include the cost of specialized materials and stringent regulatory requirements. However, continuous technological advancements and expanding applications across diverse industries suggest sustained demand.
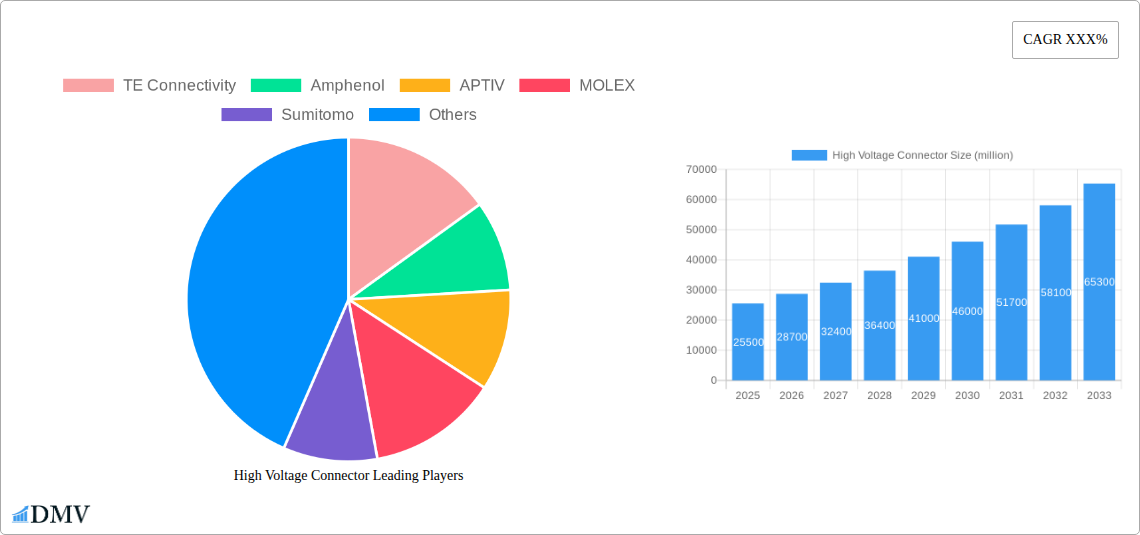
High Voltage Connector Company Market Share
The market is segmented by application into Automotive, Communication, Electronics, Military, Industrial, and Others. Product types include Electrical, Microwave, and Optical Connectors. Geographically, the Asia Pacific region is expected to dominate, fueled by strong manufacturing capabilities and rapid industrialization in countries like China and India. North America and Europe will remain crucial markets, supported by advanced infrastructure and significant investments in EVs and renewable energy. Key market players include TE Connectivity, Amphenol, APTIV, MOLEX, and Sumitomo, alongside emerging competitors, all focused on product innovation and strategic alliances to address global demand.
High Voltage Connector Market Analysis: Comprehensive Report (2019-2033)
This in-depth report provides a granular analysis of the global High Voltage Connector market, a critical component powering advancements across numerous sectors. From the burgeoning electric vehicle (EV) revolution to sophisticated aerospace applications, high voltage connectors are indispensable for reliable and efficient power transmission. Our comprehensive study spans from 2019 to 2033, with a base year of 2025 and a forecast period of 2025-2033, offering unparalleled insights for stakeholders. We meticulously dissect market dynamics, technological innovations, regional dominance, and future growth trajectories, ensuring you are equipped with the strategic intelligence needed to navigate this dynamic landscape. The report examines key segments including Automobile, Communication, Electronic, Military, Industrial, and Other applications, with a focus on Electrical Connector, Microwave Connector, and Optical Connector types.
High Voltage Connector Market Composition & Trends
The global High Voltage Connector market exhibits a dynamic composition, driven by continuous innovation and an expanding application base. Market concentration is influenced by a mix of established global players and emerging regional specialists, with key companies like TE Connectivity, Amphenol, and MOLEX holding significant market share. Innovation catalysts are primarily fueled by the demand for higher power densities, enhanced safety features, and miniaturization. For instance, advancements in material science are leading to connectors with improved thermal management and dielectric strength, crucial for high-voltage applications. The regulatory landscape, particularly concerning safety standards and environmental compliance, plays a pivotal role in shaping market entry and product development. Substitute products, though limited in high-voltage scenarios, may emerge from advancements in integrated power systems or novel connection methods. End-user profiles are diverse, ranging from automotive OEMs seeking robust EV charging solutions to telecommunication providers demanding reliable infrastructure. Mergers and acquisitions (M&A) are active, with significant deal values observed as companies aim to consolidate market position and expand technological portfolios. For example, a recent M&A transaction involved a value of approximately $500 million, indicating strong strategic consolidation. Market share distribution shows leading players commanding a combined XX% share.
High Voltage Connector Industry Evolution
The High Voltage Connector industry has undergone significant evolution, marked by sustained growth and transformative technological leaps. Over the historical period (2019-2024), the market experienced a compound annual growth rate (CAGR) of approximately 7.5%, driven by the increasing electrification of vehicles and the expansion of 5G infrastructure. The base year (2025) sets the stage for robust expansion, with projected growth rates for the forecast period (2025-2033) averaging around 8.2%. This upward trajectory is underpinned by continuous technological advancements in areas such as high-performance insulation materials, miniaturization for space-constrained applications, and integrated sensing capabilities. Consumer demands are increasingly focused on safety, reliability, and cost-effectiveness, pushing manufacturers to develop more advanced and durable connector solutions. For instance, the adoption of advanced polymers and ceramic materials has enabled connectors to withstand higher operating temperatures and pressures, improving performance in demanding industrial and automotive environments. The development of modular and scalable connector systems also caters to evolving application needs, allowing for easier integration and future upgrades. This evolution is further accelerated by increasing investments in research and development by major players, aiming to stay ahead of the curve in a competitive global market. The market size in 2025 is estimated at $10 billion, with a projected reach of $18 billion by 2033.
Leading Regions, Countries, or Segments in High Voltage Connector
The Automobile application segment, specifically within the Electrical Connector type, stands as a dominant force in the High Voltage Connector market. This ascendancy is primarily driven by the global surge in electric vehicle (EV) adoption, demanding robust and high-performance connectors for battery systems, charging infrastructure, and power management. North America and Europe are at the forefront of this trend, spurred by stringent government mandates for emission reduction and substantial incentives for EV purchases. For example, governmental subsidies in the United States and the European Union have incentivized manufacturers and consumers alike, directly impacting the demand for high-voltage automotive connectors.
Key drivers within this dominance include:
- Investment Trends: Significant investments from automotive OEMs and battery manufacturers in EV production facilities and R&D for next-generation vehicles. This has led to an estimated investment of $50 billion in the automotive electrification sector in 2025 alone.
- Regulatory Support: Favorable government policies, including emission standards and charging infrastructure development targets, creating a conducive environment for EV market growth. Many countries have set targets to phase out internal combustion engine vehicles by 2035.
- Technological Advancements: Continuous innovation in battery technology, necessitating connectors capable of handling higher voltages and currents with enhanced safety features like arc suppression and thermal runaway protection.
- Consumer Demand: Growing consumer awareness and acceptance of EVs, coupled with decreasing battery costs, are further fueling market penetration. The global EV market is projected to grow at a CAGR of 15% from 2025 to 2033.
In-depth analysis reveals that the meticulous design and manufacturing of high-voltage connectors for automotive applications are critical for ensuring the safety and performance of EVs. These connectors must withstand extreme temperature fluctuations, vibrations, and potential impacts, all while maintaining reliable electrical conductivity. The demand for fast-charging capabilities also necessitates connectors that can safely handle high current flows, driving innovation in material science and contact designs. Countries like China, Germany, and the United States are leading in both production and consumption of these specialized connectors, reflecting their positions as global automotive manufacturing hubs and early adopters of EV technology. The total market size for automotive high voltage connectors is estimated to be $7 billion in 2025, projected to reach $13 billion by 2033.
High Voltage Connector Product Innovations
Recent product innovations in High Voltage Connectors are revolutionizing performance and application scope. Manufacturers are developing compact, lightweight connectors utilizing advanced composite materials and superior insulation techniques to enhance power density and safety. Innovations like integrated EMI shielding and robust sealing mechanisms are critical for applications in harsh environments, such as industrial machinery and military equipment. For instance, new connector series are offering improved current ratings up to 1,000 Amperes and voltage capacities exceeding 1,500 Volts, with enhanced thermal management capabilities that maintain operating temperatures below XX°C under full load. These advancements are crucial for applications such as high-power EV charging stations and advanced telecommunication base stations.
Propelling Factors for High Voltage Connector Growth
Several key factors are propelling the growth of the High Voltage Connector market. The accelerating adoption of electric vehicles (EVs) is a primary driver, creating immense demand for reliable and safe high-voltage power connections within battery packs and charging systems. The ongoing expansion of 5G infrastructure and data centers also necessitates high-capacity connectors for robust power delivery. Furthermore, increasing government investments in renewable energy projects, such as wind and solar farms, requires specialized connectors for efficient power transmission. Technological advancements, including miniaturization and improved material science, are enabling connectors to meet evolving performance requirements and operate in more demanding environments. The global market is projected to witness a CAGR of approximately 8.2% from 2025 to 2033.
Obstacles in the High Voltage Connector Market
Despite robust growth, the High Voltage Connector market faces several obstacles. Stringent and evolving safety regulations across different regions can lead to increased development costs and extended product qualification timelines. Supply chain disruptions, as evidenced by recent global events, can impact the availability of raw materials and components, leading to price volatility and delivery delays, potentially affecting an estimated XX% of production schedules. Intense competition among numerous players, including established giants and agile newcomers, also puts pressure on profit margins. Furthermore, the high cost associated with advanced materials and manufacturing processes for high-performance connectors can be a barrier for smaller market segments or price-sensitive applications.
Future Opportunities in High Voltage Connector
Emerging opportunities in the High Voltage Connector market are abundant. The continued global push towards decarbonization and electrification, particularly in heavy-duty vehicles, marine, and aviation sectors, presents significant untapped potential. Advancements in solid-state battery technology and next-generation power electronics will create demand for novel connector designs with higher reliability and enhanced performance characteristics. The increasing deployment of smart grids and the burgeoning IoT ecosystem will also require sophisticated high-voltage interconnectivity solutions. Furthermore, the growing demand for high-power density connectors in industrial automation and advanced robotics offers substantial growth avenues. The market is projected to reach $18 billion by 2033.
Major Players in the High Voltage Connector Ecosystem
- TE Connectivity
- Amphenol
- APTIV
- MOLEX
- Sumitomo
- Hirose Electric Group (HRS)
- Yazaki
- JONHON
- YONGGUI
- Luxshare Precision
- Recodeal
- Ebusbar
- Guizhou Space Appliance
- Sichuan Huafeng Enterprise Group
- Shenglan Technology
- Zhangjiagang Uchen New Energy Technology
- Shenzhen Wore New Energy Electrical Techbology
- JST
Key Developments in High Voltage Connector Industry
- January 2024: TE Connectivity launched a new series of high-voltage connectors for commercial electric vehicles, offering improved safety and higher current ratings, impacting the automotive segment significantly.
- November 2023: Amphenol announced a strategic partnership with a leading battery manufacturer, focusing on developing integrated power solutions for industrial energy storage systems, highlighting an M&A potential of $300 million.
- August 2023: APTIV showcased its latest advancements in high-voltage connectors for autonomous driving systems, emphasizing miniaturization and enhanced thermal management, influencing the electronic and automobile sectors.
- May 2023: MOLEX introduced innovative connector solutions for 5G infrastructure, addressing the growing demand for high-speed data transmission and reliable power delivery in communication networks.
- February 2023: Sumitomo Electric Industries expanded its production capacity for high-voltage cables and connectors, responding to increased demand from the renewable energy sector.
- October 2022: JONHON acquired a specialized connector manufacturer, enhancing its portfolio in the military and aerospace applications.
Strategic High Voltage Connector Market Forecast
The strategic forecast for the High Voltage Connector market is exceptionally promising, driven by the relentless global push for electrification across all major industries. The automotive sector's unwavering commitment to EVs, coupled with the expansion of renewable energy infrastructure and the growing demand for advanced communication systems, will continue to be primary growth catalysts. Innovations in material science and connector design will enable higher power densities, improved safety, and greater reliability, opening doors to previously inaccessible markets. Emerging economies are expected to play an increasingly significant role as they accelerate their electrification initiatives. The market is poised for substantial growth, with an estimated market size of $18 billion by 2033, reflecting robust CAGR of approximately 8.2%.
High Voltage Connector Segmentation
-
1. Application
- 1.1. Automobile
- 1.2. Communication
- 1.3. Electronic
- 1.4. Military
- 1.5. Industrial
- 1.6. Other
-
2. Type
- 2.1. Electrical Connector
- 2.2. Microwave Connector
- 2.3. Optical Connector
High Voltage Connector Segmentation By Geography
-
1. North America
- 1.1. United States
- 1.2. Canada
- 1.3. Mexico
-
2. South America
- 2.1. Brazil
- 2.2. Argentina
- 2.3. Rest of South America
-
3. Europe
- 3.1. United Kingdom
- 3.2. Germany
- 3.3. France
- 3.4. Italy
- 3.5. Spain
- 3.6. Russia
- 3.7. Benelux
- 3.8. Nordics
- 3.9. Rest of Europe
-
4. Middle East & Africa
- 4.1. Turkey
- 4.2. Israel
- 4.3. GCC
- 4.4. North Africa
- 4.5. South Africa
- 4.6. Rest of Middle East & Africa
-
5. Asia Pacific
- 5.1. China
- 5.2. India
- 5.3. Japan
- 5.4. South Korea
- 5.5. ASEAN
- 5.6. Oceania
- 5.7. Rest of Asia Pacific
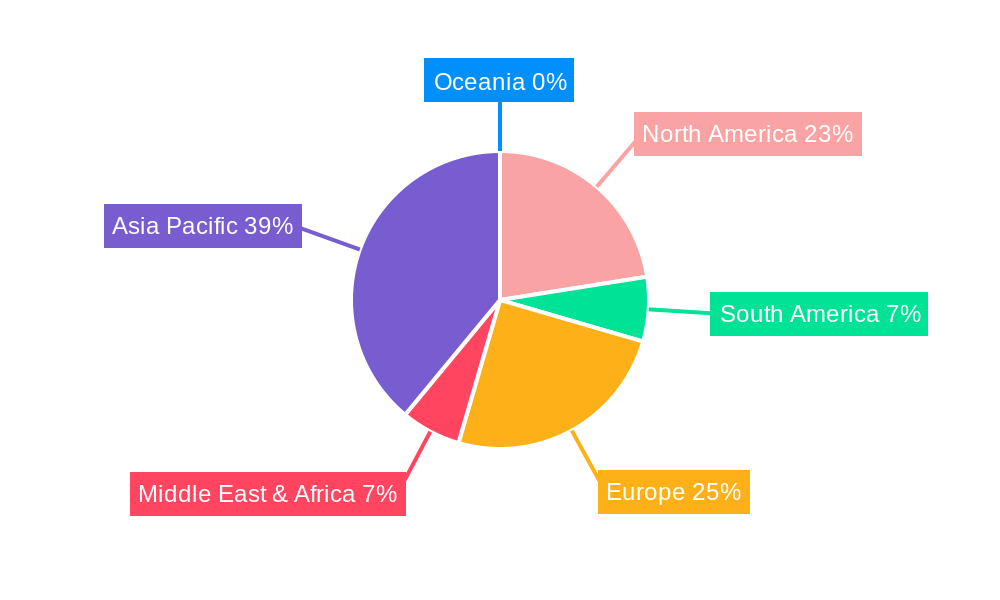
High Voltage Connector Regional Market Share
Geographic Coverage of High Voltage Connector
High Voltage Connector REPORT HIGHLIGHTS
| Aspects | Details |
|---|---|
| Study Period | 2020-2034 |
| Base Year | 2025 |
| Estimated Year | 2026 |
| Forecast Period | 2026-2034 |
| Historical Period | 2020-2025 |
| Growth Rate | CAGR of 13.31% from 2020-2034 |
| Segmentation |
|
Table of Contents
- 1. Introduction
- 1.1. Research Scope
- 1.2. Market Segmentation
- 1.3. Research Objective
- 1.4. Definitions and Assumptions
- 2. Executive Summary
- 2.1. Market Snapshot
- 3. Market Dynamics
- 3.1. Market Drivers
- 3.2. Market Restrains
- 3.3. Market Trends
- 3.4. Market Opportunities
- 4. Market Factor Analysis
- 4.1. Porters Five Forces
- 4.1.1. Bargaining Power of Suppliers
- 4.1.2. Bargaining Power of Buyers
- 4.1.3. Threat of New Entrants
- 4.1.4. Threat of Substitutes
- 4.1.5. Competitive Rivalry
- 4.2. PESTEL analysis
- 4.3. BCG Analysis
- 4.3.1. Stars (High Growth, High Market Share)
- 4.3.2. Cash Cows (Low Growth, High Market Share)
- 4.3.3. Question Mark (High Growth, Low Market Share)
- 4.3.4. Dogs (Low Growth, Low Market Share)
- 4.4. Ansoff Matrix Analysis
- 4.5. Supply Chain Analysis
- 4.6. Regulatory Landscape
- 4.7. Current Market Potential and Opportunity Assessment (TAM–SAM–SOM Framework)
- 4.8. DMV Analyst Note
- 4.1. Porters Five Forces
- 5. Market Analysis, Insights and Forecast 2021-2033
- 5.1. Market Analysis, Insights and Forecast - by Application
- 5.1.1. Automobile
- 5.1.2. Communication
- 5.1.3. Electronic
- 5.1.4. Military
- 5.1.5. Industrial
- 5.1.6. Other
- 5.2. Market Analysis, Insights and Forecast - by Type
- 5.2.1. Electrical Connector
- 5.2.2. Microwave Connector
- 5.2.3. Optical Connector
- 5.3. Market Analysis, Insights and Forecast - by Region
- 5.3.1. North America
- 5.3.2. South America
- 5.3.3. Europe
- 5.3.4. Middle East & Africa
- 5.3.5. Asia Pacific
- 5.1. Market Analysis, Insights and Forecast - by Application
- 6. Global High Voltage Connector Analysis, Insights and Forecast, 2021-2033
- 6.1. Market Analysis, Insights and Forecast - by Application
- 6.1.1. Automobile
- 6.1.2. Communication
- 6.1.3. Electronic
- 6.1.4. Military
- 6.1.5. Industrial
- 6.1.6. Other
- 6.2. Market Analysis, Insights and Forecast - by Type
- 6.2.1. Electrical Connector
- 6.2.2. Microwave Connector
- 6.2.3. Optical Connector
- 6.1. Market Analysis, Insights and Forecast - by Application
- 7. North America High Voltage Connector Analysis, Insights and Forecast, 2020-2032
- 7.1. Market Analysis, Insights and Forecast - by Application
- 7.1.1. Automobile
- 7.1.2. Communication
- 7.1.3. Electronic
- 7.1.4. Military
- 7.1.5. Industrial
- 7.1.6. Other
- 7.2. Market Analysis, Insights and Forecast - by Type
- 7.2.1. Electrical Connector
- 7.2.2. Microwave Connector
- 7.2.3. Optical Connector
- 7.1. Market Analysis, Insights and Forecast - by Application
- 8. South America High Voltage Connector Analysis, Insights and Forecast, 2020-2032
- 8.1. Market Analysis, Insights and Forecast - by Application
- 8.1.1. Automobile
- 8.1.2. Communication
- 8.1.3. Electronic
- 8.1.4. Military
- 8.1.5. Industrial
- 8.1.6. Other
- 8.2. Market Analysis, Insights and Forecast - by Type
- 8.2.1. Electrical Connector
- 8.2.2. Microwave Connector
- 8.2.3. Optical Connector
- 8.1. Market Analysis, Insights and Forecast - by Application
- 9. Europe High Voltage Connector Analysis, Insights and Forecast, 2020-2032
- 9.1. Market Analysis, Insights and Forecast - by Application
- 9.1.1. Automobile
- 9.1.2. Communication
- 9.1.3. Electronic
- 9.1.4. Military
- 9.1.5. Industrial
- 9.1.6. Other
- 9.2. Market Analysis, Insights and Forecast - by Type
- 9.2.1. Electrical Connector
- 9.2.2. Microwave Connector
- 9.2.3. Optical Connector
- 9.1. Market Analysis, Insights and Forecast - by Application
- 10. Middle East & Africa High Voltage Connector Analysis, Insights and Forecast, 2020-2032
- 10.1. Market Analysis, Insights and Forecast - by Application
- 10.1.1. Automobile
- 10.1.2. Communication
- 10.1.3. Electronic
- 10.1.4. Military
- 10.1.5. Industrial
- 10.1.6. Other
- 10.2. Market Analysis, Insights and Forecast - by Type
- 10.2.1. Electrical Connector
- 10.2.2. Microwave Connector
- 10.2.3. Optical Connector
- 10.1. Market Analysis, Insights and Forecast - by Application
- 11. Asia Pacific High Voltage Connector Analysis, Insights and Forecast, 2020-2032
- 11.1. Market Analysis, Insights and Forecast - by Application
- 11.1.1. Automobile
- 11.1.2. Communication
- 11.1.3. Electronic
- 11.1.4. Military
- 11.1.5. Industrial
- 11.1.6. Other
- 11.2. Market Analysis, Insights and Forecast - by Type
- 11.2.1. Electrical Connector
- 11.2.2. Microwave Connector
- 11.2.3. Optical Connector
- 11.1. Market Analysis, Insights and Forecast - by Application
- 12. Competitive Analysis
- 12.1. Company Profiles
- 12.1.1 TE Connectivity
- 12.1.1.1. Company Overview
- 12.1.1.2. Products
- 12.1.1.3. Company Financials
- 12.1.1.4. SWOT Analysis
- 12.1.2 Amphenol
- 12.1.2.1. Company Overview
- 12.1.2.2. Products
- 12.1.2.3. Company Financials
- 12.1.2.4. SWOT Analysis
- 12.1.3 APTIV
- 12.1.3.1. Company Overview
- 12.1.3.2. Products
- 12.1.3.3. Company Financials
- 12.1.3.4. SWOT Analysis
- 12.1.4 MOLEX
- 12.1.4.1. Company Overview
- 12.1.4.2. Products
- 12.1.4.3. Company Financials
- 12.1.4.4. SWOT Analysis
- 12.1.5 Sumitomo
- 12.1.5.1. Company Overview
- 12.1.5.2. Products
- 12.1.5.3. Company Financials
- 12.1.5.4. SWOT Analysis
- 12.1.6 Hirose Electric Group (HRS)
- 12.1.6.1. Company Overview
- 12.1.6.2. Products
- 12.1.6.3. Company Financials
- 12.1.6.4. SWOT Analysis
- 12.1.7 Yazaki
- 12.1.7.1. Company Overview
- 12.1.7.2. Products
- 12.1.7.3. Company Financials
- 12.1.7.4. SWOT Analysis
- 12.1.8 JONHON
- 12.1.8.1. Company Overview
- 12.1.8.2. Products
- 12.1.8.3. Company Financials
- 12.1.8.4. SWOT Analysis
- 12.1.9 YONGGUI
- 12.1.9.1. Company Overview
- 12.1.9.2. Products
- 12.1.9.3. Company Financials
- 12.1.9.4. SWOT Analysis
- 12.1.10 Luxshare Precision
- 12.1.10.1. Company Overview
- 12.1.10.2. Products
- 12.1.10.3. Company Financials
- 12.1.10.4. SWOT Analysis
- 12.1.11 Recodeal
- 12.1.11.1. Company Overview
- 12.1.11.2. Products
- 12.1.11.3. Company Financials
- 12.1.11.4. SWOT Analysis
- 12.1.12 Ebusbar
- 12.1.12.1. Company Overview
- 12.1.12.2. Products
- 12.1.12.3. Company Financials
- 12.1.12.4. SWOT Analysis
- 12.1.13 Guizhou Space Appliance
- 12.1.13.1. Company Overview
- 12.1.13.2. Products
- 12.1.13.3. Company Financials
- 12.1.13.4. SWOT Analysis
- 12.1.14 Sichuan Huafeng Enterprise Group
- 12.1.14.1. Company Overview
- 12.1.14.2. Products
- 12.1.14.3. Company Financials
- 12.1.14.4. SWOT Analysis
- 12.1.15 Shenglan Technology
- 12.1.15.1. Company Overview
- 12.1.15.2. Products
- 12.1.15.3. Company Financials
- 12.1.15.4. SWOT Analysis
- 12.1.16 Zhangjiagang Uchen New Energy Technology
- 12.1.16.1. Company Overview
- 12.1.16.2. Products
- 12.1.16.3. Company Financials
- 12.1.16.4. SWOT Analysis
- 12.1.17 Shenzhen Wore New Energy Electrical Techbology
- 12.1.17.1. Company Overview
- 12.1.17.2. Products
- 12.1.17.3. Company Financials
- 12.1.17.4. SWOT Analysis
- 12.1.18 JST
- 12.1.18.1. Company Overview
- 12.1.18.2. Products
- 12.1.18.3. Company Financials
- 12.1.18.4. SWOT Analysis
- 12.1.1 TE Connectivity
- 12.2. Market Entropy
- 12.2.1 Company's Key Areas Served
- 12.2.2 Recent Developments
- 12.3. Company Market Share Analysis 2025
- 12.3.1 Top 5 Companies Market Share Analysis
- 12.3.2 Top 3 Companies Market Share Analysis
- 12.4. List of Potential Customers
- 13. Research Methodology
List of Figures
- Figure 1: Global High Voltage Connector Revenue Breakdown (billion, %) by Region 2025 & 2033
- Figure 2: Global High Voltage Connector Volume Breakdown (K, %) by Region 2025 & 2033
- Figure 3: North America High Voltage Connector Revenue (billion), by Application 2025 & 2033
- Figure 4: North America High Voltage Connector Volume (K), by Application 2025 & 2033
- Figure 5: North America High Voltage Connector Revenue Share (%), by Application 2025 & 2033
- Figure 6: North America High Voltage Connector Volume Share (%), by Application 2025 & 2033
- Figure 7: North America High Voltage Connector Revenue (billion), by Type 2025 & 2033
- Figure 8: North America High Voltage Connector Volume (K), by Type 2025 & 2033
- Figure 9: North America High Voltage Connector Revenue Share (%), by Type 2025 & 2033
- Figure 10: North America High Voltage Connector Volume Share (%), by Type 2025 & 2033
- Figure 11: North America High Voltage Connector Revenue (billion), by Country 2025 & 2033
- Figure 12: North America High Voltage Connector Volume (K), by Country 2025 & 2033
- Figure 13: North America High Voltage Connector Revenue Share (%), by Country 2025 & 2033
- Figure 14: North America High Voltage Connector Volume Share (%), by Country 2025 & 2033
- Figure 15: South America High Voltage Connector Revenue (billion), by Application 2025 & 2033
- Figure 16: South America High Voltage Connector Volume (K), by Application 2025 & 2033
- Figure 17: South America High Voltage Connector Revenue Share (%), by Application 2025 & 2033
- Figure 18: South America High Voltage Connector Volume Share (%), by Application 2025 & 2033
- Figure 19: South America High Voltage Connector Revenue (billion), by Type 2025 & 2033
- Figure 20: South America High Voltage Connector Volume (K), by Type 2025 & 2033
- Figure 21: South America High Voltage Connector Revenue Share (%), by Type 2025 & 2033
- Figure 22: South America High Voltage Connector Volume Share (%), by Type 2025 & 2033
- Figure 23: South America High Voltage Connector Revenue (billion), by Country 2025 & 2033
- Figure 24: South America High Voltage Connector Volume (K), by Country 2025 & 2033
- Figure 25: South America High Voltage Connector Revenue Share (%), by Country 2025 & 2033
- Figure 26: South America High Voltage Connector Volume Share (%), by Country 2025 & 2033
- Figure 27: Europe High Voltage Connector Revenue (billion), by Application 2025 & 2033
- Figure 28: Europe High Voltage Connector Volume (K), by Application 2025 & 2033
- Figure 29: Europe High Voltage Connector Revenue Share (%), by Application 2025 & 2033
- Figure 30: Europe High Voltage Connector Volume Share (%), by Application 2025 & 2033
- Figure 31: Europe High Voltage Connector Revenue (billion), by Type 2025 & 2033
- Figure 32: Europe High Voltage Connector Volume (K), by Type 2025 & 2033
- Figure 33: Europe High Voltage Connector Revenue Share (%), by Type 2025 & 2033
- Figure 34: Europe High Voltage Connector Volume Share (%), by Type 2025 & 2033
- Figure 35: Europe High Voltage Connector Revenue (billion), by Country 2025 & 2033
- Figure 36: Europe High Voltage Connector Volume (K), by Country 2025 & 2033
- Figure 37: Europe High Voltage Connector Revenue Share (%), by Country 2025 & 2033
- Figure 38: Europe High Voltage Connector Volume Share (%), by Country 2025 & 2033
- Figure 39: Middle East & Africa High Voltage Connector Revenue (billion), by Application 2025 & 2033
- Figure 40: Middle East & Africa High Voltage Connector Volume (K), by Application 2025 & 2033
- Figure 41: Middle East & Africa High Voltage Connector Revenue Share (%), by Application 2025 & 2033
- Figure 42: Middle East & Africa High Voltage Connector Volume Share (%), by Application 2025 & 2033
- Figure 43: Middle East & Africa High Voltage Connector Revenue (billion), by Type 2025 & 2033
- Figure 44: Middle East & Africa High Voltage Connector Volume (K), by Type 2025 & 2033
- Figure 45: Middle East & Africa High Voltage Connector Revenue Share (%), by Type 2025 & 2033
- Figure 46: Middle East & Africa High Voltage Connector Volume Share (%), by Type 2025 & 2033
- Figure 47: Middle East & Africa High Voltage Connector Revenue (billion), by Country 2025 & 2033
- Figure 48: Middle East & Africa High Voltage Connector Volume (K), by Country 2025 & 2033
- Figure 49: Middle East & Africa High Voltage Connector Revenue Share (%), by Country 2025 & 2033
- Figure 50: Middle East & Africa High Voltage Connector Volume Share (%), by Country 2025 & 2033
- Figure 51: Asia Pacific High Voltage Connector Revenue (billion), by Application 2025 & 2033
- Figure 52: Asia Pacific High Voltage Connector Volume (K), by Application 2025 & 2033
- Figure 53: Asia Pacific High Voltage Connector Revenue Share (%), by Application 2025 & 2033
- Figure 54: Asia Pacific High Voltage Connector Volume Share (%), by Application 2025 & 2033
- Figure 55: Asia Pacific High Voltage Connector Revenue (billion), by Type 2025 & 2033
- Figure 56: Asia Pacific High Voltage Connector Volume (K), by Type 2025 & 2033
- Figure 57: Asia Pacific High Voltage Connector Revenue Share (%), by Type 2025 & 2033
- Figure 58: Asia Pacific High Voltage Connector Volume Share (%), by Type 2025 & 2033
- Figure 59: Asia Pacific High Voltage Connector Revenue (billion), by Country 2025 & 2033
- Figure 60: Asia Pacific High Voltage Connector Volume (K), by Country 2025 & 2033
- Figure 61: Asia Pacific High Voltage Connector Revenue Share (%), by Country 2025 & 2033
- Figure 62: Asia Pacific High Voltage Connector Volume Share (%), by Country 2025 & 2033
List of Tables
- Table 1: Global High Voltage Connector Revenue billion Forecast, by Application 2020 & 2033
- Table 2: Global High Voltage Connector Volume K Forecast, by Application 2020 & 2033
- Table 3: Global High Voltage Connector Revenue billion Forecast, by Type 2020 & 2033
- Table 4: Global High Voltage Connector Volume K Forecast, by Type 2020 & 2033
- Table 5: Global High Voltage Connector Revenue billion Forecast, by Region 2020 & 2033
- Table 6: Global High Voltage Connector Volume K Forecast, by Region 2020 & 2033
- Table 7: Global High Voltage Connector Revenue billion Forecast, by Application 2020 & 2033
- Table 8: Global High Voltage Connector Volume K Forecast, by Application 2020 & 2033
- Table 9: Global High Voltage Connector Revenue billion Forecast, by Type 2020 & 2033
- Table 10: Global High Voltage Connector Volume K Forecast, by Type 2020 & 2033
- Table 11: Global High Voltage Connector Revenue billion Forecast, by Country 2020 & 2033
- Table 12: Global High Voltage Connector Volume K Forecast, by Country 2020 & 2033
- Table 13: United States High Voltage Connector Revenue (billion) Forecast, by Application 2020 & 2033
- Table 14: United States High Voltage Connector Volume (K) Forecast, by Application 2020 & 2033
- Table 15: Canada High Voltage Connector Revenue (billion) Forecast, by Application 2020 & 2033
- Table 16: Canada High Voltage Connector Volume (K) Forecast, by Application 2020 & 2033
- Table 17: Mexico High Voltage Connector Revenue (billion) Forecast, by Application 2020 & 2033
- Table 18: Mexico High Voltage Connector Volume (K) Forecast, by Application 2020 & 2033
- Table 19: Global High Voltage Connector Revenue billion Forecast, by Application 2020 & 2033
- Table 20: Global High Voltage Connector Volume K Forecast, by Application 2020 & 2033
- Table 21: Global High Voltage Connector Revenue billion Forecast, by Type 2020 & 2033
- Table 22: Global High Voltage Connector Volume K Forecast, by Type 2020 & 2033
- Table 23: Global High Voltage Connector Revenue billion Forecast, by Country 2020 & 2033
- Table 24: Global High Voltage Connector Volume K Forecast, by Country 2020 & 2033
- Table 25: Brazil High Voltage Connector Revenue (billion) Forecast, by Application 2020 & 2033
- Table 26: Brazil High Voltage Connector Volume (K) Forecast, by Application 2020 & 2033
- Table 27: Argentina High Voltage Connector Revenue (billion) Forecast, by Application 2020 & 2033
- Table 28: Argentina High Voltage Connector Volume (K) Forecast, by Application 2020 & 2033
- Table 29: Rest of South America High Voltage Connector Revenue (billion) Forecast, by Application 2020 & 2033
- Table 30: Rest of South America High Voltage Connector Volume (K) Forecast, by Application 2020 & 2033
- Table 31: Global High Voltage Connector Revenue billion Forecast, by Application 2020 & 2033
- Table 32: Global High Voltage Connector Volume K Forecast, by Application 2020 & 2033
- Table 33: Global High Voltage Connector Revenue billion Forecast, by Type 2020 & 2033
- Table 34: Global High Voltage Connector Volume K Forecast, by Type 2020 & 2033
- Table 35: Global High Voltage Connector Revenue billion Forecast, by Country 2020 & 2033
- Table 36: Global High Voltage Connector Volume K Forecast, by Country 2020 & 2033
- Table 37: United Kingdom High Voltage Connector Revenue (billion) Forecast, by Application 2020 & 2033
- Table 38: United Kingdom High Voltage Connector Volume (K) Forecast, by Application 2020 & 2033
- Table 39: Germany High Voltage Connector Revenue (billion) Forecast, by Application 2020 & 2033
- Table 40: Germany High Voltage Connector Volume (K) Forecast, by Application 2020 & 2033
- Table 41: France High Voltage Connector Revenue (billion) Forecast, by Application 2020 & 2033
- Table 42: France High Voltage Connector Volume (K) Forecast, by Application 2020 & 2033
- Table 43: Italy High Voltage Connector Revenue (billion) Forecast, by Application 2020 & 2033
- Table 44: Italy High Voltage Connector Volume (K) Forecast, by Application 2020 & 2033
- Table 45: Spain High Voltage Connector Revenue (billion) Forecast, by Application 2020 & 2033
- Table 46: Spain High Voltage Connector Volume (K) Forecast, by Application 2020 & 2033
- Table 47: Russia High Voltage Connector Revenue (billion) Forecast, by Application 2020 & 2033
- Table 48: Russia High Voltage Connector Volume (K) Forecast, by Application 2020 & 2033
- Table 49: Benelux High Voltage Connector Revenue (billion) Forecast, by Application 2020 & 2033
- Table 50: Benelux High Voltage Connector Volume (K) Forecast, by Application 2020 & 2033
- Table 51: Nordics High Voltage Connector Revenue (billion) Forecast, by Application 2020 & 2033
- Table 52: Nordics High Voltage Connector Volume (K) Forecast, by Application 2020 & 2033
- Table 53: Rest of Europe High Voltage Connector Revenue (billion) Forecast, by Application 2020 & 2033
- Table 54: Rest of Europe High Voltage Connector Volume (K) Forecast, by Application 2020 & 2033
- Table 55: Global High Voltage Connector Revenue billion Forecast, by Application 2020 & 2033
- Table 56: Global High Voltage Connector Volume K Forecast, by Application 2020 & 2033
- Table 57: Global High Voltage Connector Revenue billion Forecast, by Type 2020 & 2033
- Table 58: Global High Voltage Connector Volume K Forecast, by Type 2020 & 2033
- Table 59: Global High Voltage Connector Revenue billion Forecast, by Country 2020 & 2033
- Table 60: Global High Voltage Connector Volume K Forecast, by Country 2020 & 2033
- Table 61: Turkey High Voltage Connector Revenue (billion) Forecast, by Application 2020 & 2033
- Table 62: Turkey High Voltage Connector Volume (K) Forecast, by Application 2020 & 2033
- Table 63: Israel High Voltage Connector Revenue (billion) Forecast, by Application 2020 & 2033
- Table 64: Israel High Voltage Connector Volume (K) Forecast, by Application 2020 & 2033
- Table 65: GCC High Voltage Connector Revenue (billion) Forecast, by Application 2020 & 2033
- Table 66: GCC High Voltage Connector Volume (K) Forecast, by Application 2020 & 2033
- Table 67: North Africa High Voltage Connector Revenue (billion) Forecast, by Application 2020 & 2033
- Table 68: North Africa High Voltage Connector Volume (K) Forecast, by Application 2020 & 2033
- Table 69: South Africa High Voltage Connector Revenue (billion) Forecast, by Application 2020 & 2033
- Table 70: South Africa High Voltage Connector Volume (K) Forecast, by Application 2020 & 2033
- Table 71: Rest of Middle East & Africa High Voltage Connector Revenue (billion) Forecast, by Application 2020 & 2033
- Table 72: Rest of Middle East & Africa High Voltage Connector Volume (K) Forecast, by Application 2020 & 2033
- Table 73: Global High Voltage Connector Revenue billion Forecast, by Application 2020 & 2033
- Table 74: Global High Voltage Connector Volume K Forecast, by Application 2020 & 2033
- Table 75: Global High Voltage Connector Revenue billion Forecast, by Type 2020 & 2033
- Table 76: Global High Voltage Connector Volume K Forecast, by Type 2020 & 2033
- Table 77: Global High Voltage Connector Revenue billion Forecast, by Country 2020 & 2033
- Table 78: Global High Voltage Connector Volume K Forecast, by Country 2020 & 2033
- Table 79: China High Voltage Connector Revenue (billion) Forecast, by Application 2020 & 2033
- Table 80: China High Voltage Connector Volume (K) Forecast, by Application 2020 & 2033
- Table 81: India High Voltage Connector Revenue (billion) Forecast, by Application 2020 & 2033
- Table 82: India High Voltage Connector Volume (K) Forecast, by Application 2020 & 2033
- Table 83: Japan High Voltage Connector Revenue (billion) Forecast, by Application 2020 & 2033
- Table 84: Japan High Voltage Connector Volume (K) Forecast, by Application 2020 & 2033
- Table 85: South Korea High Voltage Connector Revenue (billion) Forecast, by Application 2020 & 2033
- Table 86: South Korea High Voltage Connector Volume (K) Forecast, by Application 2020 & 2033
- Table 87: ASEAN High Voltage Connector Revenue (billion) Forecast, by Application 2020 & 2033
- Table 88: ASEAN High Voltage Connector Volume (K) Forecast, by Application 2020 & 2033
- Table 89: Oceania High Voltage Connector Revenue (billion) Forecast, by Application 2020 & 2033
- Table 90: Oceania High Voltage Connector Volume (K) Forecast, by Application 2020 & 2033
- Table 91: Rest of Asia Pacific High Voltage Connector Revenue (billion) Forecast, by Application 2020 & 2033
- Table 92: Rest of Asia Pacific High Voltage Connector Volume (K) Forecast, by Application 2020 & 2033
Frequently Asked Questions
1. What is the projected Compound Annual Growth Rate (CAGR) of the High Voltage Connector?
The projected CAGR is approximately 13.31%.
2. Which companies are prominent players in the High Voltage Connector?
Key companies in the market include TE Connectivity, Amphenol, APTIV, MOLEX, Sumitomo, Hirose Electric Group (HRS), Yazaki, JONHON, YONGGUI, Luxshare Precision, Recodeal, Ebusbar, Guizhou Space Appliance, Sichuan Huafeng Enterprise Group, Shenglan Technology, Zhangjiagang Uchen New Energy Technology, Shenzhen Wore New Energy Electrical Techbology, JST.
3. What are the main segments of the High Voltage Connector?
The market segments include Application, Type.
4. Can you provide details about the market size?
The market size is estimated to be USD 9.3 billion as of 2022.
5. What are some drivers contributing to market growth?
N/A
6. What are the notable trends driving market growth?
N/A
7. Are there any restraints impacting market growth?
N/A
8. Can you provide examples of recent developments in the market?
N/A
9. What pricing options are available for accessing the report?
Pricing options include single-user, multi-user, and enterprise licenses priced at USD 3950.00, USD 5925.00, and USD 7900.00 respectively.
10. Is the market size provided in terms of value or volume?
The market size is provided in terms of value, measured in billion and volume, measured in K.
11. Are there any specific market keywords associated with the report?
Yes, the market keyword associated with the report is "High Voltage Connector," which aids in identifying and referencing the specific market segment covered.
12. How do I determine which pricing option suits my needs best?
The pricing options vary based on user requirements and access needs. Individual users may opt for single-user licenses, while businesses requiring broader access may choose multi-user or enterprise licenses for cost-effective access to the report.
13. Are there any additional resources or data provided in the High Voltage Connector report?
While the report offers comprehensive insights, it's advisable to review the specific contents or supplementary materials provided to ascertain if additional resources or data are available.
14. How can I stay updated on further developments or reports in the High Voltage Connector?
To stay informed about further developments, trends, and reports in the High Voltage Connector, consider subscribing to industry newsletters, following relevant companies and organizations, or regularly checking reputable industry news sources and publications.
Methodology
Step 1 - Identification of Relevant Samples Size from Population Database


Step 2 - Approaches for Defining Global Market Size (Value, Volume* & Price*)

Note*: In applicable scenarios
Step 3 - Data Sources
Primary Research
- Web Analytics
- Survey Reports
- Research Institute
- Latest Research Reports
- Opinion Leaders
Secondary Research
- Annual Reports
- White Paper
- Latest Press Release
- Industry Association
- Paid Database
- Investor Presentations

Step 4 - Data Triangulation
Involves using different sources of information in order to increase the validity of a study
These sources are likely to be stakeholders in a program - participants, other researchers, program staff, other community members, and so on.
Then we put all data in single framework & apply various statistical tools to find out the dynamic on the market.
During the analysis stage, feedback from the stakeholder groups would be compared to determine areas of agreement as well as areas of divergence