

Key Insights
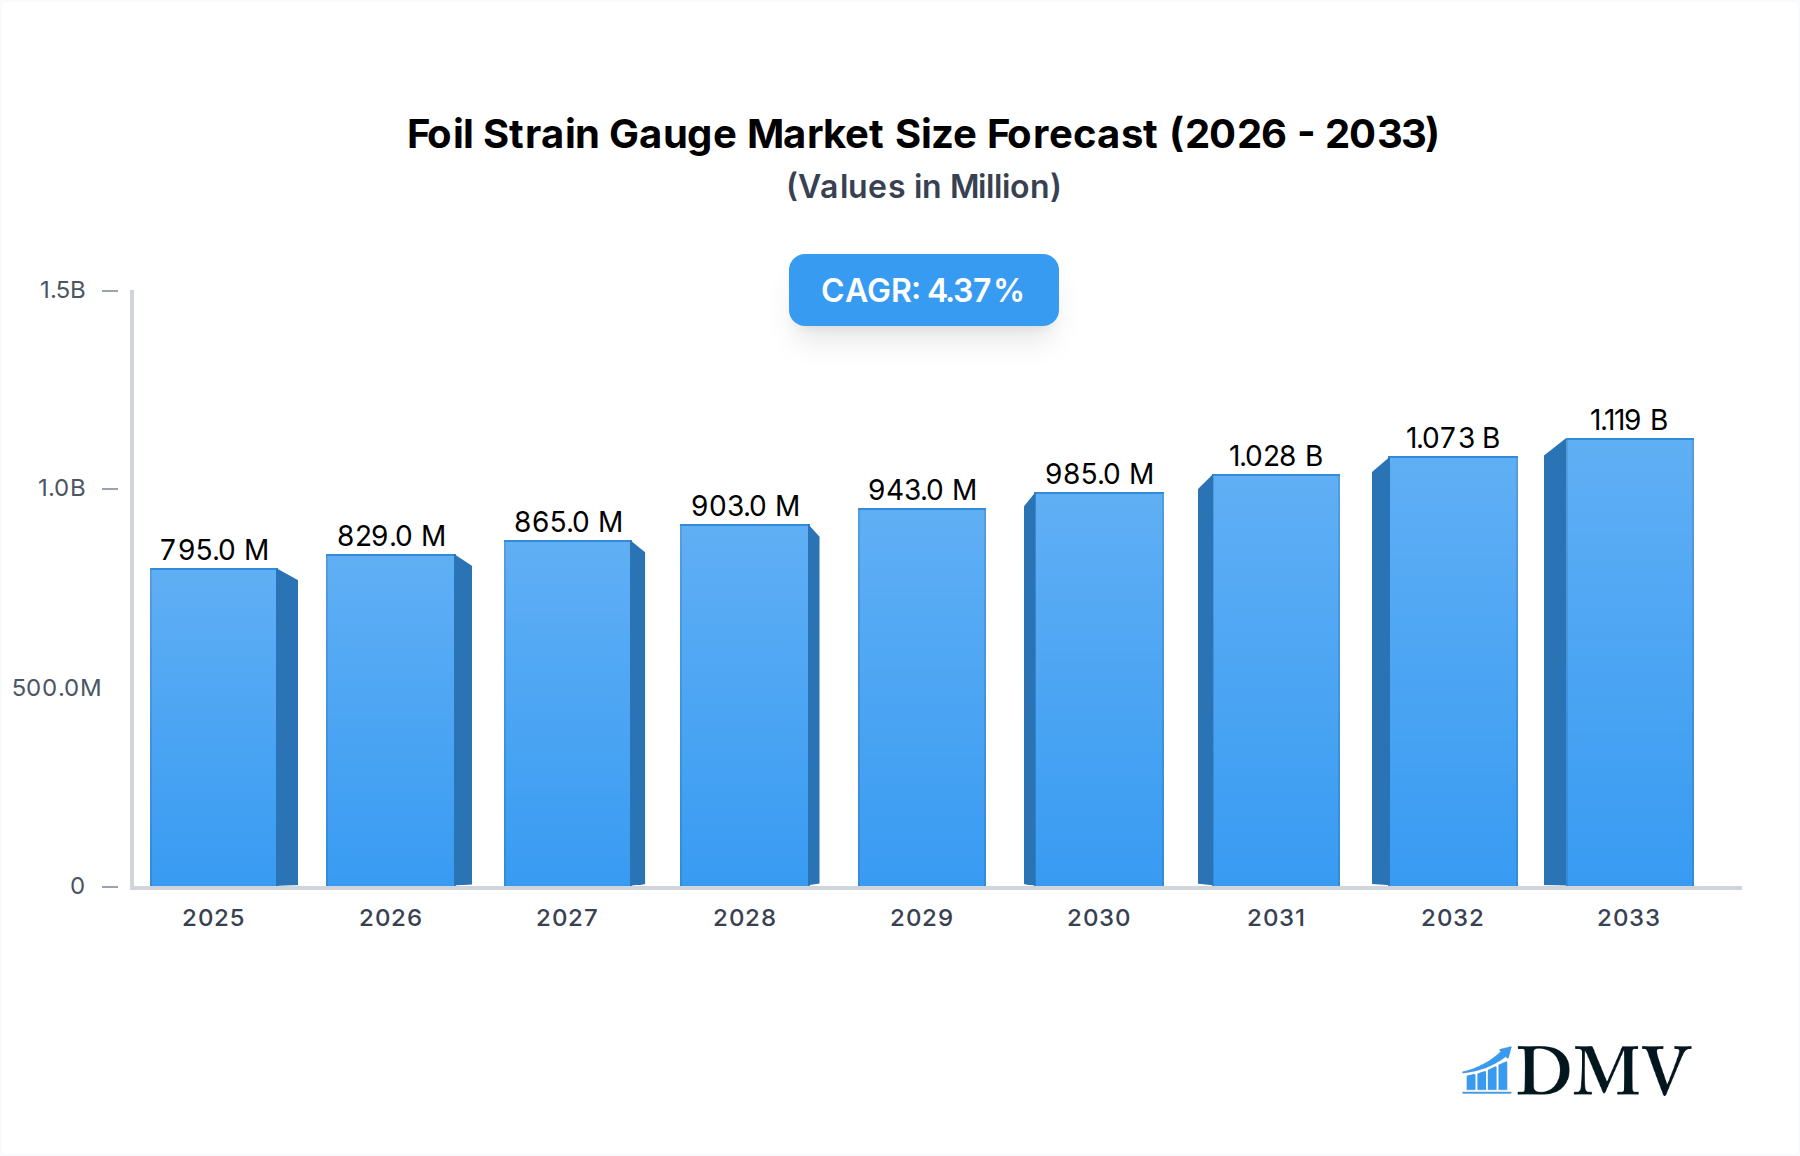
The global Foil Strain Gauge market is poised for significant expansion, projected to reach 1023 million by 2033, driven by a robust Compound Annual Growth Rate (CAGR) of 4.2%. This steady growth is underpinned by the increasing demand for precise stress and strain measurement across a multitude of industries, including aerospace, automotive, civil engineering, and manufacturing. The inherent advantages of foil strain gauges, such as their high sensitivity, excellent linearity, and compact size, make them indispensable tools for quality control, structural health monitoring, and research and development. Emerging applications in advanced robotics, renewable energy infrastructure, and the burgeoning medical device sector are further propelling market adoption. Innovations in materials science and manufacturing techniques are leading to the development of more durable, high-temperature resistant, and cost-effective foil strain gauges, broadening their applicability and market penetration. The market's trajectory is strongly influenced by investments in infrastructure development and the continuous drive for enhanced product performance and safety standards worldwide.

Foil Strain Gauge Market Size (In Million)
The market dynamics are characterized by a balanced interplay of growth drivers and restraining factors. Key growth drivers include the escalating need for accurate structural integrity assessments, particularly in critical infrastructure projects and the automotive industry's pursuit of lightweight yet robust designs. Advancements in data acquisition systems and IoT integration are also enhancing the utility and adoption of foil strain gauges. However, the market faces certain restraints, such as the relatively high initial cost of advanced systems and the availability of alternative sensing technologies for specific niche applications. The complexity of installation and calibration in certain environments can also present challenges. Despite these hurdles, the continuous innovation in foil strain gauge technology, coupled with increasing regulatory emphasis on safety and performance, ensures a sustained upward trend. The market is segmented by application and type, with "Residual Stress Measurement" and "Torque Measurement" applications showing substantial promise, while "linear" and "Ring" types continue to dominate due to their widespread use. Leading companies are actively engaged in research and development to introduce next-generation products and expand their global footprint.
Foil Strain Gauge Company Market Share
Foil Strain Gauge Market Composition & Trends
The global Foil Strain Gauge market exhibits a dynamic competitive landscape, characterized by a mix of established leaders and emerging innovators. Market concentration is moderate, with key players like Kyowa Electronic Instruments, HBK, and Tokyo Measuring Instruments Laboratory holding significant shares, estimated at over 70% in collective revenue for 2025. Innovation is a critical catalyst, driven by advancements in sensor materials, miniaturization, and enhanced data acquisition capabilities. The regulatory environment, particularly in aerospace and automotive sectors, mandates stringent quality and performance standards, influencing product development and market entry. Substitute products, such as fiber optic sensors and MEMS-based sensors, are gaining traction but are yet to fully displace the established advantages of foil strain gauges in specific applications due to cost-effectiveness and proven reliability. End-user profiles span critical industries including aerospace, automotive, civil engineering, and industrial manufacturing, each with unique demands for precision and durability. Mergers and acquisitions (M&A) activity is anticipated to remain a significant trend, with an estimated M&A deal value of over $500 million projected for the forecast period (2025-2033), aimed at consolidating market presence, acquiring advanced technologies, and expanding geographical reach.
- Market Share Distribution (2025 Estimate):
- Kyowa Electronic Instruments: XX%
- HBK: XX%
- Tokyo Measuring Instruments Laboratory: XX%
- Others: XX%
- M&A Deal Value (Projected 2025-2033): Over $500 million
- Innovation Drivers: Miniaturization, advanced materials, enhanced signal processing.
- Regulatory Influence: Aerospace and automotive standards.
- Substitute Product Landscape: Fiber optic sensors, MEMS sensors.
Foil Strain Gauge Industry Evolution
The Foil Strain Gauge industry has witnessed a remarkable evolution, driven by continuous technological advancements and an ever-expanding application spectrum. From its inception, the market has charted a consistent upward trajectory, fueled by the increasing demand for precise strain measurement in critical engineering applications. The historical period (2019–2024) saw a steady compound annual growth rate (CAGR) of approximately 5.5%, a testament to the indispensable role of foil strain gauges in ensuring structural integrity and performance optimization. The base year (2025) is projected to mark a significant milestone, with the market size estimated to reach over $2 billion. Looking ahead, the forecast period (2025–2033) is expected to maintain a robust CAGR of around 6.0%, surpassing a market valuation of $3.5 billion by the end of the study period. This sustained growth is underpinned by several key factors, including the increasing complexity of modern engineering designs, the stringent safety regulations across various sectors, and the growing adoption of smart manufacturing and Industry 4.0 principles. Technological breakthroughs, such as the development of high-temperature strain gauges capable of withstanding extreme thermal environments and ultra-miniature foil gauges for intricate applications, have broadened the applicability of these sensors. Furthermore, advancements in data acquisition systems and signal processing software have significantly enhanced the accuracy and ease of use of foil strain gauge technology, making it more accessible to a wider range of users. The shift towards more complex and lightweight structures in aerospace and automotive industries, coupled with the need for comprehensive residual stress analysis in manufacturing and civil infrastructure, continues to be a dominant driver of demand. The market is also witnessing a growing trend towards customized strain gauge solutions tailored to specific application needs, further propelling its expansion.
Leading Regions, Countries, or Segments in Foil Strain Gauge
The Foil Strain Gauge market is dominated by North America and Europe, with Asia Pacific emerging as a rapidly growing contender, particularly in the Application segment of Residual Stress Measurement. These regions exhibit strong demand driven by their mature industrial bases in aerospace, automotive, and advanced manufacturing.
Application: Residual Stress Measurement
Residual stress measurement is a critical application where foil strain gauges offer unparalleled accuracy and reliability. This segment is poised for significant growth due to its vital role in ensuring the longevity and safety of manufactured components and structures.
- Key Drivers:
- Aerospace Industry: Strict safety regulations and the need for lightweight yet durable aircraft components necessitate precise residual stress analysis during manufacturing and maintenance. The estimated market value for foil strain gauges in aerospace residual stress measurement is projected to exceed $400 million by 2033.
- Automotive Sector: The increasing complexity of vehicle designs, including advanced materials and intricate powertrain components, demands thorough residual stress analysis to prevent failures and optimize performance. The automotive segment is anticipated to contribute over $350 million to this application by 2033.
- Civil Engineering: Infrastructure projects, including bridges, dams, and tunnels, require ongoing monitoring and assessment of residual stresses to ensure structural integrity and predict potential fatigue. Investment in infrastructure modernization will further fuel demand, projected to be over $200 million by 2033.
- Manufacturing & Heavy Industry: The use of foil strain gauges in welding, forging, and casting processes helps in identifying and mitigating residual stresses, leading to improved product quality and reduced material waste. This sector is expected to contribute over $250 million by 2033.
Type: Linear
Linear foil strain gauges represent the most widely adopted type due to their versatility and ease of application across a broad spectrum of measurement requirements.
- Dominance Factors:
- Simplicity and Cost-Effectiveness: Linear gauges are generally simpler to manufacture and install, making them a cost-effective solution for a vast array of applications compared to more specialized types.
- Wide Availability: They are readily available from numerous manufacturers, including BCM Sensor, Althen Sensors, and ME-Systeme, ensuring a consistent supply chain and competitive pricing.
- Versatile Measurement: Their ability to accurately measure strain along a single axis makes them suitable for a wide range of structural health monitoring and stress analysis tasks.
- Integration with Existing Systems: Linear gauges are easily integrated with existing data acquisition systems, simplifying implementation for end-users.
Leading Countries: United States, Germany, China
- United States: A major hub for aerospace and automotive manufacturing, coupled with significant investment in infrastructure projects, makes the US a dominant market. The estimated market size in the US for foil strain gauges is projected to be over $600 million by 2033.
- Germany: Renowned for its high-precision engineering, automotive industry leadership, and strong emphasis on industrial automation, Germany is a key market. The projected market size in Germany is over $500 million by 2033.
- China: With its burgeoning manufacturing sector, rapid infrastructure development, and growing aerospace and automotive industries, China represents a significant and rapidly expanding market. The estimated market size in China is projected to be over $450 million by 2033.
Foil Strain Gauge Product Innovations
Recent product innovations in the Foil Strain Gauge market are focused on enhancing performance, expanding application envelopes, and simplifying integration. Manufacturers like Hamilton Precision Metals are introducing new alloy foils offering superior temperature compensation and fatigue life, crucial for applications in extreme environments. ESI Technology is pushing the boundaries with miniature foil strain gauges designed for high-density installations in confined spaces, such as within advanced medical devices or micro-electromechanical systems (MEMS). Furthermore, advancements in encapsulation techniques are leading to strain gauges with improved resistance to moisture, chemicals, and abrasion, extending their lifespan and reliability in harsh industrial settings. These innovations are directly impacting performance metrics, with new gauges exhibiting linearity errors of less than 0.1% and temperature sensitivities below 1 ppm/°C.
Propelling Factors for Foil Strain Gauge Growth
The Foil Strain Gauge market is propelled by several interconnected factors. Technologically, the ongoing demand for increased precision and miniaturization in sensors for sectors like aerospace and automotive is a primary driver. Economic influences stem from global investments in infrastructure development and manufacturing automation, necessitating robust structural health monitoring. Regulatory landscapes, particularly stringent safety standards in critical industries, mandate the use of reliable strain measurement tools. The inherent advantages of foil strain gauges, including their cost-effectiveness for high-volume applications, proven reliability over decades, and ease of integration, continue to solidify their market position. For instance, the growth of electric vehicles, with their complex battery and chassis designs, is creating new demand for precise strain analysis.
Obstacles in the Foil Strain Gauge Market
Despite its robust growth, the Foil Strain Gauge market faces certain obstacles. Regulatory hurdles in niche markets can sometimes slow down adoption due to the need for extensive validation. Supply chain disruptions, as experienced globally in recent years, can impact the availability of raw materials and finished products, leading to price volatility. Intense competitive pressures from alternative sensing technologies, such as fiber optic sensors and MEMS, especially in price-sensitive applications, pose a constant challenge. Furthermore, the requirement for skilled personnel for installation and data interpretation can be a barrier in less developed regions. The predicted impact of these barriers on market growth is estimated to be around 2-3% annually.
Future Opportunities in Foil Strain Gauge
Emerging opportunities in the Foil Strain Gauge market are significant and diverse. The burgeoning renewable energy sector, particularly in wind turbine blade monitoring and solar panel structural integrity, presents a substantial growth avenue. The increasing adoption of Industry 4.0 principles and the Internet of Things (IoT) is driving demand for smart sensors with integrated data logging capabilities, where foil strain gauges can play a crucial role. Advancements in materials science are enabling the development of strain gauges for even more extreme environments, opening up opportunities in deep-sea exploration and advanced industrial processes. The continued miniaturization of electronic devices also creates a demand for micro-strain gauges.
Major Players in the Foil Strain Gauge Ecosystem
- Kyowa Electronic Instruments
- Hudson Technologies
- HBK
- Tokyo Measuring Instruments Laboratory
- BCM Sensor
- Althen Sensors
- Hamilton Precision Metals
- ME-Systeme
- ESI Technology
Key Developments in Foil Strain Gauge Industry
- 2023: Introduction of advanced, high-temperature resistant foil strain gauges by HBK, expanding application possibilities in jet engines and industrial furnaces.
- 2022: Kyowa Electronic Instruments launches a new series of ultra-miniature foil strain gauges, enabling integration into highly confined spaces in electronic devices.
- 2022: Hamilton Precision Metals announces the development of novel alloy foils with enhanced fatigue resistance, improving the lifespan of strain gauges in dynamic applications.
- 2021: BCM Sensor releases an improved encapsulation technology for foil strain gauges, offering superior protection against harsh environmental conditions.
- 2020: Althen Sensors expands its portfolio with specialized shear strain gauges, catering to the growing demand for advanced structural analysis.
Strategic Foil Strain Gauge Market Forecast
The Foil Strain Gauge market is strategically positioned for sustained growth, driven by its intrinsic technological advantages and expanding application frontiers. Future opportunities in renewable energy, smart manufacturing, and advanced materials will be key catalysts. The forecast period (2025–2033) anticipates a CAGR of approximately 6.0%, with the market expected to reach over $3.5 billion. Continued investment in research and development for enhanced performance, miniaturization, and environmental resilience, coupled with strategic market expansions by key players, will solidify the dominance of foil strain gauges in critical measurement applications. The increasing focus on structural integrity and performance optimization across diverse industries underpins a robust and optimistic market outlook.
Foil Strain Gauge Segmentation
-
1. Application
- 1.1. Residual Stress Measurement
- 1.2. Shear Strain Measurement
- 1.3. Torque Measurement
- 1.4. Stress Concentration Measurement
- 1.5. Others
-
2. Type
- 2.1. linear
- 2.2. Ring
- 2.3. Chain
- 2.4. Others
Foil Strain Gauge Segmentation By Geography
-
1. North America
- 1.1. United States
- 1.2. Canada
- 1.3. Mexico
-
2. South America
- 2.1. Brazil
- 2.2. Argentina
- 2.3. Rest of South America
-
3. Europe
- 3.1. United Kingdom
- 3.2. Germany
- 3.3. France
- 3.4. Italy
- 3.5. Spain
- 3.6. Russia
- 3.7. Benelux
- 3.8. Nordics
- 3.9. Rest of Europe
-
4. Middle East & Africa
- 4.1. Turkey
- 4.2. Israel
- 4.3. GCC
- 4.4. North Africa
- 4.5. South Africa
- 4.6. Rest of Middle East & Africa
-
5. Asia Pacific
- 5.1. China
- 5.2. India
- 5.3. Japan
- 5.4. South Korea
- 5.5. ASEAN
- 5.6. Oceania
- 5.7. Rest of Asia Pacific
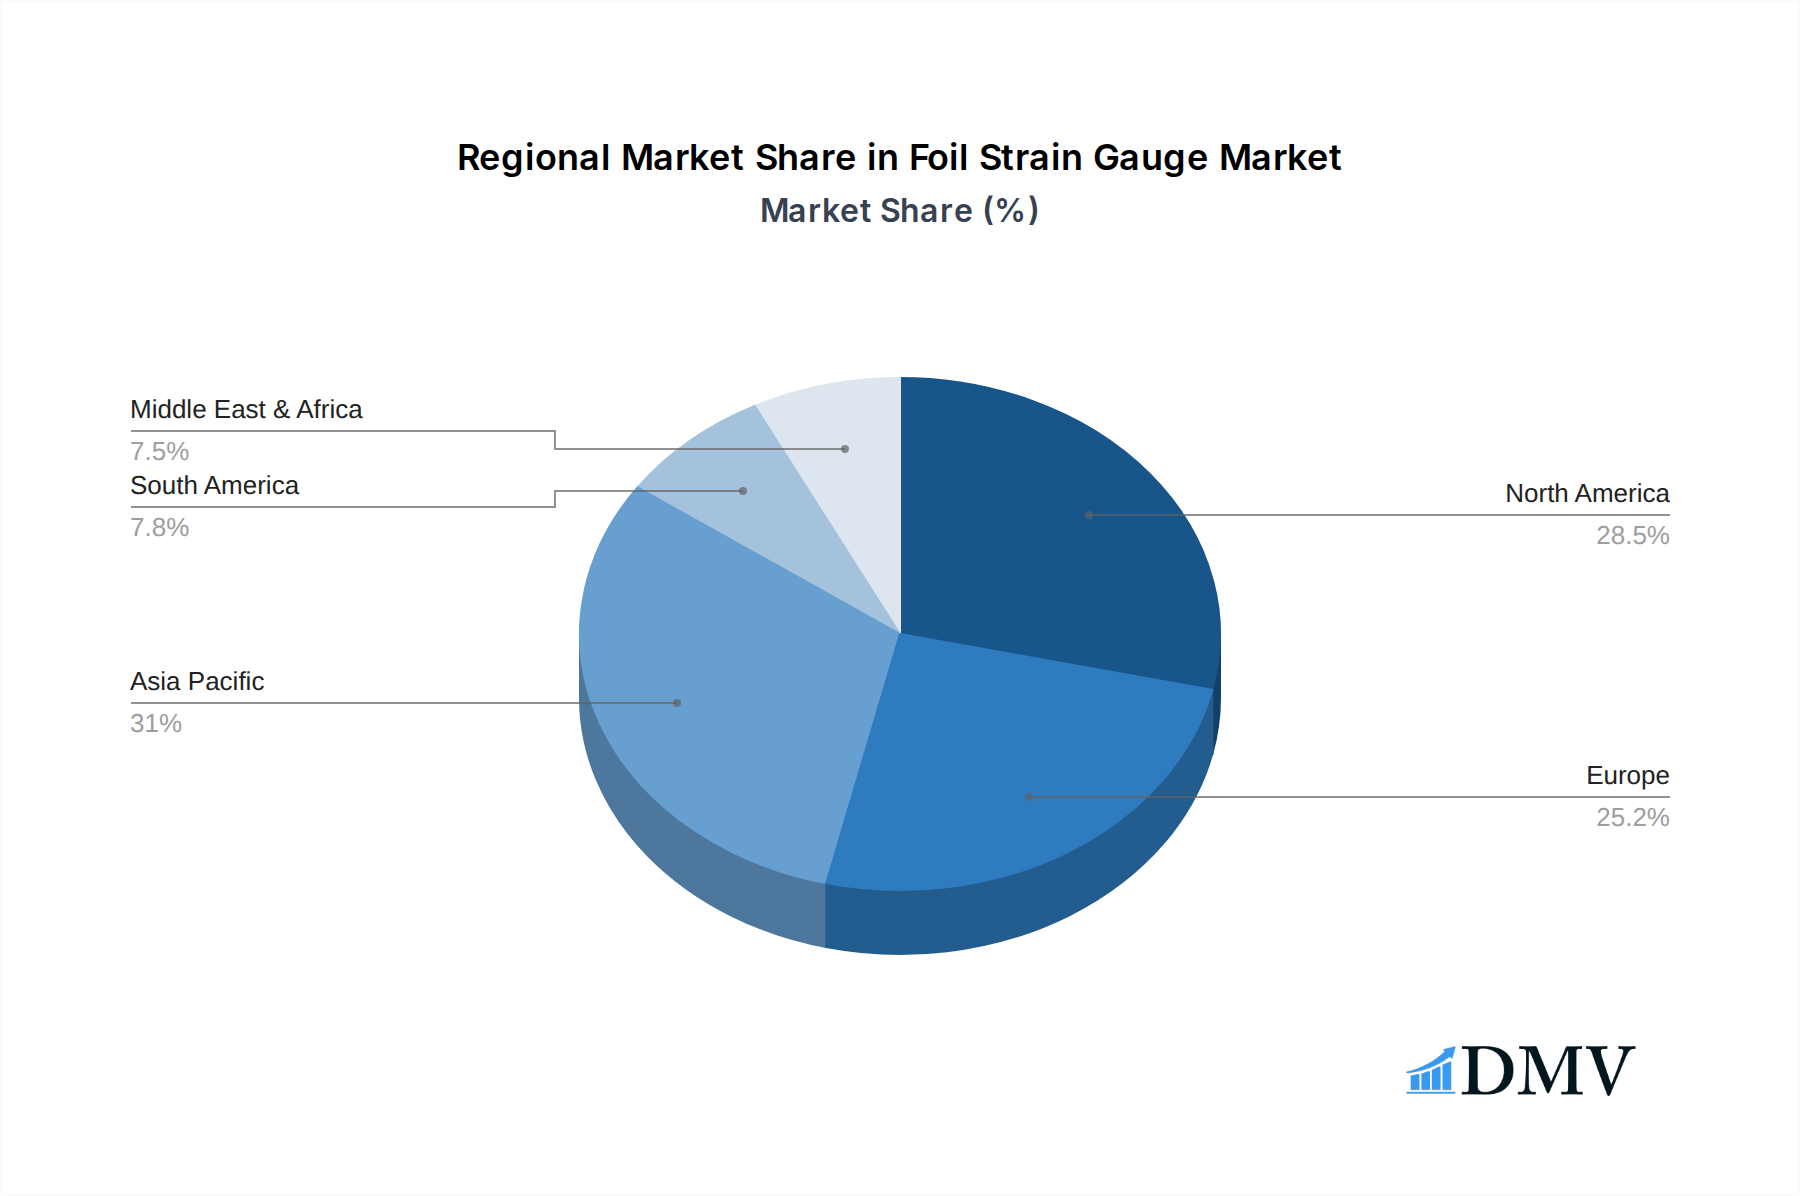
Foil Strain Gauge Regional Market Share
Geographic Coverage of Foil Strain Gauge
Foil Strain Gauge REPORT HIGHLIGHTS
| Aspects | Details |
|---|---|
| Study Period | 2020-2034 |
| Base Year | 2025 |
| Estimated Year | 2026 |
| Forecast Period | 2026-2034 |
| Historical Period | 2020-2025 |
| Growth Rate | CAGR of 4.2% from 2020-2034 |
| Segmentation |
|
Table of Contents
- 1. Introduction
- 1.1. Research Scope
- 1.2. Market Segmentation
- 1.3. Research Objective
- 1.4. Definitions and Assumptions
- 2. Executive Summary
- 2.1. Market Snapshot
- 3. Market Dynamics
- 3.1. Market Drivers
- 3.2. Market Restrains
- 3.3. Market Trends
- 3.4. Market Opportunities
- 4. Market Factor Analysis
- 4.1. Porters Five Forces
- 4.1.1. Bargaining Power of Suppliers
- 4.1.2. Bargaining Power of Buyers
- 4.1.3. Threat of New Entrants
- 4.1.4. Threat of Substitutes
- 4.1.5. Competitive Rivalry
- 4.2. PESTEL analysis
- 4.3. BCG Analysis
- 4.3.1. Stars (High Growth, High Market Share)
- 4.3.2. Cash Cows (Low Growth, High Market Share)
- 4.3.3. Question Mark (High Growth, Low Market Share)
- 4.3.4. Dogs (Low Growth, Low Market Share)
- 4.4. Ansoff Matrix Analysis
- 4.5. Supply Chain Analysis
- 4.6. Regulatory Landscape
- 4.7. Current Market Potential and Opportunity Assessment (TAM–SAM–SOM Framework)
- 4.8. DMV Analyst Note
- 4.1. Porters Five Forces
- 5. Market Analysis, Insights and Forecast 2021-2033
- 5.1. Market Analysis, Insights and Forecast - by Application
- 5.1.1. Residual Stress Measurement
- 5.1.2. Shear Strain Measurement
- 5.1.3. Torque Measurement
- 5.1.4. Stress Concentration Measurement
- 5.1.5. Others
- 5.2. Market Analysis, Insights and Forecast - by Type
- 5.2.1. linear
- 5.2.2. Ring
- 5.2.3. Chain
- 5.2.4. Others
- 5.3. Market Analysis, Insights and Forecast - by Region
- 5.3.1. North America
- 5.3.2. South America
- 5.3.3. Europe
- 5.3.4. Middle East & Africa
- 5.3.5. Asia Pacific
- 5.1. Market Analysis, Insights and Forecast - by Application
- 6. Global Foil Strain Gauge Analysis, Insights and Forecast, 2021-2033
- 6.1. Market Analysis, Insights and Forecast - by Application
- 6.1.1. Residual Stress Measurement
- 6.1.2. Shear Strain Measurement
- 6.1.3. Torque Measurement
- 6.1.4. Stress Concentration Measurement
- 6.1.5. Others
- 6.2. Market Analysis, Insights and Forecast - by Type
- 6.2.1. linear
- 6.2.2. Ring
- 6.2.3. Chain
- 6.2.4. Others
- 6.1. Market Analysis, Insights and Forecast - by Application
- 7. North America Foil Strain Gauge Analysis, Insights and Forecast, 2020-2032
- 7.1. Market Analysis, Insights and Forecast - by Application
- 7.1.1. Residual Stress Measurement
- 7.1.2. Shear Strain Measurement
- 7.1.3. Torque Measurement
- 7.1.4. Stress Concentration Measurement
- 7.1.5. Others
- 7.2. Market Analysis, Insights and Forecast - by Type
- 7.2.1. linear
- 7.2.2. Ring
- 7.2.3. Chain
- 7.2.4. Others
- 7.1. Market Analysis, Insights and Forecast - by Application
- 8. South America Foil Strain Gauge Analysis, Insights and Forecast, 2020-2032
- 8.1. Market Analysis, Insights and Forecast - by Application
- 8.1.1. Residual Stress Measurement
- 8.1.2. Shear Strain Measurement
- 8.1.3. Torque Measurement
- 8.1.4. Stress Concentration Measurement
- 8.1.5. Others
- 8.2. Market Analysis, Insights and Forecast - by Type
- 8.2.1. linear
- 8.2.2. Ring
- 8.2.3. Chain
- 8.2.4. Others
- 8.1. Market Analysis, Insights and Forecast - by Application
- 9. Europe Foil Strain Gauge Analysis, Insights and Forecast, 2020-2032
- 9.1. Market Analysis, Insights and Forecast - by Application
- 9.1.1. Residual Stress Measurement
- 9.1.2. Shear Strain Measurement
- 9.1.3. Torque Measurement
- 9.1.4. Stress Concentration Measurement
- 9.1.5. Others
- 9.2. Market Analysis, Insights and Forecast - by Type
- 9.2.1. linear
- 9.2.2. Ring
- 9.2.3. Chain
- 9.2.4. Others
- 9.1. Market Analysis, Insights and Forecast - by Application
- 10. Middle East & Africa Foil Strain Gauge Analysis, Insights and Forecast, 2020-2032
- 10.1. Market Analysis, Insights and Forecast - by Application
- 10.1.1. Residual Stress Measurement
- 10.1.2. Shear Strain Measurement
- 10.1.3. Torque Measurement
- 10.1.4. Stress Concentration Measurement
- 10.1.5. Others
- 10.2. Market Analysis, Insights and Forecast - by Type
- 10.2.1. linear
- 10.2.2. Ring
- 10.2.3. Chain
- 10.2.4. Others
- 10.1. Market Analysis, Insights and Forecast - by Application
- 11. Asia Pacific Foil Strain Gauge Analysis, Insights and Forecast, 2020-2032
- 11.1. Market Analysis, Insights and Forecast - by Application
- 11.1.1. Residual Stress Measurement
- 11.1.2. Shear Strain Measurement
- 11.1.3. Torque Measurement
- 11.1.4. Stress Concentration Measurement
- 11.1.5. Others
- 11.2. Market Analysis, Insights and Forecast - by Type
- 11.2.1. linear
- 11.2.2. Ring
- 11.2.3. Chain
- 11.2.4. Others
- 11.1. Market Analysis, Insights and Forecast - by Application
- 12. Competitive Analysis
- 12.1. Company Profiles
- 12.1.1 Kyowa Electronic Instruments
- 12.1.1.1. Company Overview
- 12.1.1.2. Products
- 12.1.1.3. Company Financials
- 12.1.1.4. SWOT Analysis
- 12.1.2 Hudson Technologies
- 12.1.2.1. Company Overview
- 12.1.2.2. Products
- 12.1.2.3. Company Financials
- 12.1.2.4. SWOT Analysis
- 12.1.3 HBK
- 12.1.3.1. Company Overview
- 12.1.3.2. Products
- 12.1.3.3. Company Financials
- 12.1.3.4. SWOT Analysis
- 12.1.4 Tokyo Measuring Instruments Laboratory
- 12.1.4.1. Company Overview
- 12.1.4.2. Products
- 12.1.4.3. Company Financials
- 12.1.4.4. SWOT Analysis
- 12.1.5 BCM Sensor
- 12.1.5.1. Company Overview
- 12.1.5.2. Products
- 12.1.5.3. Company Financials
- 12.1.5.4. SWOT Analysis
- 12.1.6 Althen Sensors
- 12.1.6.1. Company Overview
- 12.1.6.2. Products
- 12.1.6.3. Company Financials
- 12.1.6.4. SWOT Analysis
- 12.1.7 Hamilton Precision Metals
- 12.1.7.1. Company Overview
- 12.1.7.2. Products
- 12.1.7.3. Company Financials
- 12.1.7.4. SWOT Analysis
- 12.1.8 ME-Systeme
- 12.1.8.1. Company Overview
- 12.1.8.2. Products
- 12.1.8.3. Company Financials
- 12.1.8.4. SWOT Analysis
- 12.1.9 ESI Technology
- 12.1.9.1. Company Overview
- 12.1.9.2. Products
- 12.1.9.3. Company Financials
- 12.1.9.4. SWOT Analysis
- 12.1.1 Kyowa Electronic Instruments
- 12.2. Market Entropy
- 12.2.1 Company's Key Areas Served
- 12.2.2 Recent Developments
- 12.3. Company Market Share Analysis 2025
- 12.3.1 Top 5 Companies Market Share Analysis
- 12.3.2 Top 3 Companies Market Share Analysis
- 12.4. List of Potential Customers
- 13. Research Methodology
List of Figures
- Figure 1: Global Foil Strain Gauge Revenue Breakdown (million, %) by Region 2025 & 2033
- Figure 2: North America Foil Strain Gauge Revenue (million), by Application 2025 & 2033
- Figure 3: North America Foil Strain Gauge Revenue Share (%), by Application 2025 & 2033
- Figure 4: North America Foil Strain Gauge Revenue (million), by Type 2025 & 2033
- Figure 5: North America Foil Strain Gauge Revenue Share (%), by Type 2025 & 2033
- Figure 6: North America Foil Strain Gauge Revenue (million), by Country 2025 & 2033
- Figure 7: North America Foil Strain Gauge Revenue Share (%), by Country 2025 & 2033
- Figure 8: South America Foil Strain Gauge Revenue (million), by Application 2025 & 2033
- Figure 9: South America Foil Strain Gauge Revenue Share (%), by Application 2025 & 2033
- Figure 10: South America Foil Strain Gauge Revenue (million), by Type 2025 & 2033
- Figure 11: South America Foil Strain Gauge Revenue Share (%), by Type 2025 & 2033
- Figure 12: South America Foil Strain Gauge Revenue (million), by Country 2025 & 2033
- Figure 13: South America Foil Strain Gauge Revenue Share (%), by Country 2025 & 2033
- Figure 14: Europe Foil Strain Gauge Revenue (million), by Application 2025 & 2033
- Figure 15: Europe Foil Strain Gauge Revenue Share (%), by Application 2025 & 2033
- Figure 16: Europe Foil Strain Gauge Revenue (million), by Type 2025 & 2033
- Figure 17: Europe Foil Strain Gauge Revenue Share (%), by Type 2025 & 2033
- Figure 18: Europe Foil Strain Gauge Revenue (million), by Country 2025 & 2033
- Figure 19: Europe Foil Strain Gauge Revenue Share (%), by Country 2025 & 2033
- Figure 20: Middle East & Africa Foil Strain Gauge Revenue (million), by Application 2025 & 2033
- Figure 21: Middle East & Africa Foil Strain Gauge Revenue Share (%), by Application 2025 & 2033
- Figure 22: Middle East & Africa Foil Strain Gauge Revenue (million), by Type 2025 & 2033
- Figure 23: Middle East & Africa Foil Strain Gauge Revenue Share (%), by Type 2025 & 2033
- Figure 24: Middle East & Africa Foil Strain Gauge Revenue (million), by Country 2025 & 2033
- Figure 25: Middle East & Africa Foil Strain Gauge Revenue Share (%), by Country 2025 & 2033
- Figure 26: Asia Pacific Foil Strain Gauge Revenue (million), by Application 2025 & 2033
- Figure 27: Asia Pacific Foil Strain Gauge Revenue Share (%), by Application 2025 & 2033
- Figure 28: Asia Pacific Foil Strain Gauge Revenue (million), by Type 2025 & 2033
- Figure 29: Asia Pacific Foil Strain Gauge Revenue Share (%), by Type 2025 & 2033
- Figure 30: Asia Pacific Foil Strain Gauge Revenue (million), by Country 2025 & 2033
- Figure 31: Asia Pacific Foil Strain Gauge Revenue Share (%), by Country 2025 & 2033
List of Tables
- Table 1: Global Foil Strain Gauge Revenue million Forecast, by Application 2020 & 2033
- Table 2: Global Foil Strain Gauge Revenue million Forecast, by Type 2020 & 2033
- Table 3: Global Foil Strain Gauge Revenue million Forecast, by Region 2020 & 2033
- Table 4: Global Foil Strain Gauge Revenue million Forecast, by Application 2020 & 2033
- Table 5: Global Foil Strain Gauge Revenue million Forecast, by Type 2020 & 2033
- Table 6: Global Foil Strain Gauge Revenue million Forecast, by Country 2020 & 2033
- Table 7: United States Foil Strain Gauge Revenue (million) Forecast, by Application 2020 & 2033
- Table 8: Canada Foil Strain Gauge Revenue (million) Forecast, by Application 2020 & 2033
- Table 9: Mexico Foil Strain Gauge Revenue (million) Forecast, by Application 2020 & 2033
- Table 10: Global Foil Strain Gauge Revenue million Forecast, by Application 2020 & 2033
- Table 11: Global Foil Strain Gauge Revenue million Forecast, by Type 2020 & 2033
- Table 12: Global Foil Strain Gauge Revenue million Forecast, by Country 2020 & 2033
- Table 13: Brazil Foil Strain Gauge Revenue (million) Forecast, by Application 2020 & 2033
- Table 14: Argentina Foil Strain Gauge Revenue (million) Forecast, by Application 2020 & 2033
- Table 15: Rest of South America Foil Strain Gauge Revenue (million) Forecast, by Application 2020 & 2033
- Table 16: Global Foil Strain Gauge Revenue million Forecast, by Application 2020 & 2033
- Table 17: Global Foil Strain Gauge Revenue million Forecast, by Type 2020 & 2033
- Table 18: Global Foil Strain Gauge Revenue million Forecast, by Country 2020 & 2033
- Table 19: United Kingdom Foil Strain Gauge Revenue (million) Forecast, by Application 2020 & 2033
- Table 20: Germany Foil Strain Gauge Revenue (million) Forecast, by Application 2020 & 2033
- Table 21: France Foil Strain Gauge Revenue (million) Forecast, by Application 2020 & 2033
- Table 22: Italy Foil Strain Gauge Revenue (million) Forecast, by Application 2020 & 2033
- Table 23: Spain Foil Strain Gauge Revenue (million) Forecast, by Application 2020 & 2033
- Table 24: Russia Foil Strain Gauge Revenue (million) Forecast, by Application 2020 & 2033
- Table 25: Benelux Foil Strain Gauge Revenue (million) Forecast, by Application 2020 & 2033
- Table 26: Nordics Foil Strain Gauge Revenue (million) Forecast, by Application 2020 & 2033
- Table 27: Rest of Europe Foil Strain Gauge Revenue (million) Forecast, by Application 2020 & 2033
- Table 28: Global Foil Strain Gauge Revenue million Forecast, by Application 2020 & 2033
- Table 29: Global Foil Strain Gauge Revenue million Forecast, by Type 2020 & 2033
- Table 30: Global Foil Strain Gauge Revenue million Forecast, by Country 2020 & 2033
- Table 31: Turkey Foil Strain Gauge Revenue (million) Forecast, by Application 2020 & 2033
- Table 32: Israel Foil Strain Gauge Revenue (million) Forecast, by Application 2020 & 2033
- Table 33: GCC Foil Strain Gauge Revenue (million) Forecast, by Application 2020 & 2033
- Table 34: North Africa Foil Strain Gauge Revenue (million) Forecast, by Application 2020 & 2033
- Table 35: South Africa Foil Strain Gauge Revenue (million) Forecast, by Application 2020 & 2033
- Table 36: Rest of Middle East & Africa Foil Strain Gauge Revenue (million) Forecast, by Application 2020 & 2033
- Table 37: Global Foil Strain Gauge Revenue million Forecast, by Application 2020 & 2033
- Table 38: Global Foil Strain Gauge Revenue million Forecast, by Type 2020 & 2033
- Table 39: Global Foil Strain Gauge Revenue million Forecast, by Country 2020 & 2033
- Table 40: China Foil Strain Gauge Revenue (million) Forecast, by Application 2020 & 2033
- Table 41: India Foil Strain Gauge Revenue (million) Forecast, by Application 2020 & 2033
- Table 42: Japan Foil Strain Gauge Revenue (million) Forecast, by Application 2020 & 2033
- Table 43: South Korea Foil Strain Gauge Revenue (million) Forecast, by Application 2020 & 2033
- Table 44: ASEAN Foil Strain Gauge Revenue (million) Forecast, by Application 2020 & 2033
- Table 45: Oceania Foil Strain Gauge Revenue (million) Forecast, by Application 2020 & 2033
- Table 46: Rest of Asia Pacific Foil Strain Gauge Revenue (million) Forecast, by Application 2020 & 2033
Frequently Asked Questions
1. What is the projected Compound Annual Growth Rate (CAGR) of the Foil Strain Gauge?
The projected CAGR is approximately 4.2%.
2. Which companies are prominent players in the Foil Strain Gauge?
Key companies in the market include Kyowa Electronic Instruments, Hudson Technologies, HBK, Tokyo Measuring Instruments Laboratory, BCM Sensor, Althen Sensors, Hamilton Precision Metals, ME-Systeme, ESI Technology.
3. What are the main segments of the Foil Strain Gauge?
The market segments include Application, Type.
4. Can you provide details about the market size?
The market size is estimated to be USD 1023 million as of 2022.
5. What are some drivers contributing to market growth?
N/A
6. What are the notable trends driving market growth?
N/A
7. Are there any restraints impacting market growth?
N/A
8. Can you provide examples of recent developments in the market?
N/A
9. What pricing options are available for accessing the report?
Pricing options include single-user, multi-user, and enterprise licenses priced at USD 2900.00, USD 4350.00, and USD 5800.00 respectively.
10. Is the market size provided in terms of value or volume?
The market size is provided in terms of value, measured in million.
11. Are there any specific market keywords associated with the report?
Yes, the market keyword associated with the report is "Foil Strain Gauge," which aids in identifying and referencing the specific market segment covered.
12. How do I determine which pricing option suits my needs best?
The pricing options vary based on user requirements and access needs. Individual users may opt for single-user licenses, while businesses requiring broader access may choose multi-user or enterprise licenses for cost-effective access to the report.
13. Are there any additional resources or data provided in the Foil Strain Gauge report?
While the report offers comprehensive insights, it's advisable to review the specific contents or supplementary materials provided to ascertain if additional resources or data are available.
14. How can I stay updated on further developments or reports in the Foil Strain Gauge?
To stay informed about further developments, trends, and reports in the Foil Strain Gauge, consider subscribing to industry newsletters, following relevant companies and organizations, or regularly checking reputable industry news sources and publications.
Methodology
Step 1 - Identification of Relevant Samples Size from Population Database


Step 2 - Approaches for Defining Global Market Size (Value, Volume* & Price*)

Note*: In applicable scenarios
Step 3 - Data Sources
Primary Research
- Web Analytics
- Survey Reports
- Research Institute
- Latest Research Reports
- Opinion Leaders
Secondary Research
- Annual Reports
- White Paper
- Latest Press Release
- Industry Association
- Paid Database
- Investor Presentations

Step 4 - Data Triangulation
Involves using different sources of information in order to increase the validity of a study
These sources are likely to be stakeholders in a program - participants, other researchers, program staff, other community members, and so on.
Then we put all data in single framework & apply various statistical tools to find out the dynamic on the market.
During the analysis stage, feedback from the stakeholder groups would be compared to determine areas of agreement as well as areas of divergence