

Key Insights
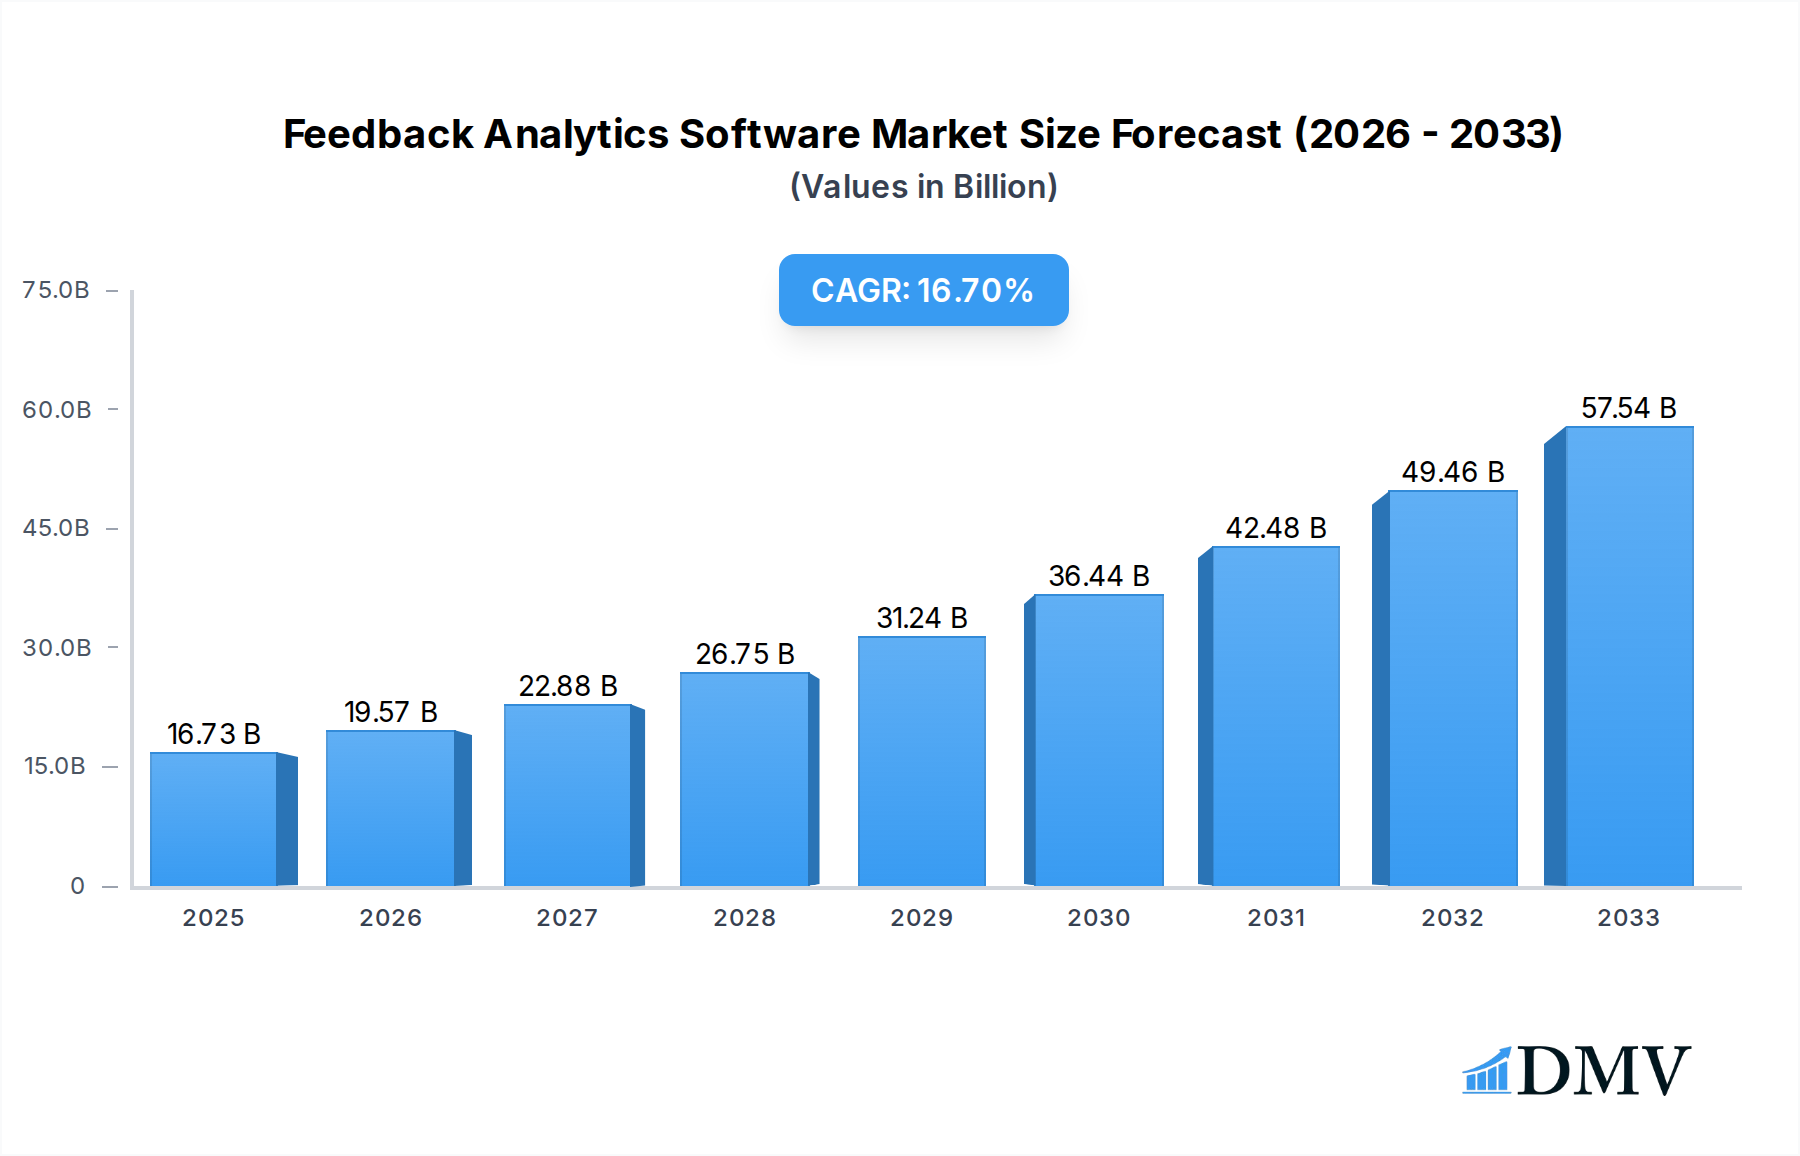
The global Feedback Analytics Software market is poised for substantial expansion, projected to reach an impressive $16.73 billion by 2025, exhibiting a remarkable compound annual growth rate (CAGR) of 16.9%. This robust growth is primarily fueled by the increasing recognition among businesses of all sizes, from Large Enterprises to Small and Medium-sized Enterprises (SMEs), regarding the critical importance of understanding customer sentiment and operational efficiency. The proliferation of digital channels and the subsequent explosion of customer feedback data across various touchpoints necessitate sophisticated solutions for analysis. Consequently, the demand for cloud-based platforms, offering scalability, accessibility, and cost-effectiveness, is expected to dominate the market. However, the integration challenges with existing legacy systems and concerns over data privacy and security are key restraints that market players will need to address to fully capitalize on the market's potential. The market is characterized by a competitive landscape with key players like Qualtrics, Medallia, and Birdeye actively innovating to provide comprehensive feedback analysis capabilities.

Feedback Analytics Software Market Size (In Billion)
The strategic imperative for businesses to enhance customer experience (CX) and drive data-informed decision-making is a paramount driver for the feedback analytics software market. Companies are increasingly leveraging these tools to derive actionable insights from unstructured data, including surveys, social media comments, reviews, and call transcripts. This enables them to proactively identify pain points, improve product/service offerings, and foster customer loyalty. The growing adoption of AI and machine learning algorithms within these platforms further enhances their analytical prowess, allowing for deeper sentiment analysis, trend identification, and predictive modeling. Geographically, North America is expected to lead the market, driven by early adoption and a strong presence of technology-forward enterprises. The Asia Pacific region, however, is anticipated to witness the fastest growth, propelled by the expanding digital economy and a burgeoning number of SMEs seeking to gain a competitive edge through customer insights.
Feedback Analytics Software Company Market Share
Feedback Analytics Software Market Composition & Trends
The global Feedback Analytics Software market is characterized by a dynamic and evolving landscape, shaped by a confluence of technological innovation, shifting customer expectations, and an increasing imperative for data-driven decision-making. Market concentration is moderately fragmented, with a blend of established giants and nimble disruptors vying for market share. Key players such as Qualtrics, Medallia, and Birdeye command significant influence, leveraging their comprehensive platforms and extensive customer bases. However, specialized solutions from companies like Keatext, Thematic Analysis, and Chattermill are carving out niches by offering advanced AI-driven insights for specific use cases. Innovation catalysts abound, driven by the relentless pursuit of more sophisticated Natural Language Processing (NLP) and sentiment analysis capabilities, enabling businesses to extract deeper, more nuanced understanding from unstructured feedback.
The regulatory landscape, particularly around data privacy and consumer protection, continues to influence market development. Compliance with regulations like GDPR and CCPA necessitates robust data governance and security features within feedback analytics solutions. Substitute products, such as manual analysis and generic survey tools, are increasingly being outpaced by the efficiency and depth of specialized feedback analytics software. End-user profiles are diversifying, ranging from Large Enterprises seeking to optimize customer experience and operational efficiency to Small and Medium-sized Enterprises (SMEs) looking for cost-effective ways to gather and act upon customer insights. Mergers and acquisitions (M&A) remain a significant driver of market consolidation and strategic expansion. For instance, the acquisition of Wootric by InMoment in 2022, valued at an estimated $300 million, exemplifies the industry's drive to broaden service offerings and technological capabilities.
- Market Share Distribution: Leading players like Qualtrics and Medallia collectively hold an estimated 35% of the market share, with specialized vendors like Keatext and Chattermill capturing an aggregate of 15%. The remaining share is distributed amongst numerous smaller and emerging vendors.
- M&A Deal Values: Recent M&A activities, excluding publicly disclosed valuations, are estimated to involve an average deal value of XXX billion. Major acquisitions are projected to exceed $1 billion in the coming years as consolidation accelerates.
- Innovation Hubs: North America and Europe lead in terms of research and development spending for AI-driven feedback analysis, contributing an estimated 60% of global innovation in NLP and sentiment analysis algorithms.
- Regulatory Impact: Investments in compliance features are projected to increase by 20% annually, driven by evolving global data privacy laws.
Feedback Analytics Software Industry Evolution
The Feedback Analytics Software industry is experiencing a profound period of evolution, marked by exponential growth, rapid technological advancements, and a fundamental shift in how businesses approach customer engagement and operational improvement. The historical period from 2019 to 2024 has witnessed a significant surge in the adoption of feedback analytics solutions, driven by an increasing awareness of the direct correlation between customer satisfaction and business success. This era saw the maturation of core technologies, with Natural Language Processing (NLP) and Machine Learning (ML) becoming increasingly sophisticated, enabling more accurate sentiment analysis, topic extraction, and trend identification from diverse feedback sources. The estimated market size in 2019 was approximately XXX billion, growing steadily through to an estimated $XXX billion in 2024.
The base year of 2025 marks a pivotal point, with the market projected to reach an estimated $XXX billion, setting the stage for robust expansion throughout the forecast period of 2025–2033. This growth trajectory is underpinned by several key factors. Firstly, the sheer volume of customer feedback generated across various channels – from social media and review sites to direct surveys and support interactions – necessitates advanced analytical tools to derive actionable insights. Companies are realizing that raw feedback data, without sophisticated analysis, represents a missed opportunity. Secondly, the democratization of AI and ML technologies has made powerful feedback analytics capabilities more accessible to businesses of all sizes, fostering wider adoption. Cloud-based solutions, in particular, have played a crucial role in this accessibility, offering scalability, flexibility, and cost-effectiveness.
Technological advancements continue to be a primary catalyst. Beyond sentiment analysis, the industry is witnessing advancements in predictive analytics, allowing businesses to anticipate customer churn or identify emerging issues before they escalate. Explainable AI (XAI) is also gaining traction, providing greater transparency into how insights are generated, thereby building trust and facilitating wider adoption by non-technical stakeholders. The rise of conversational AI and its integration with feedback platforms is enabling more natural and continuous feedback loops. Consumer demands are also evolving; customers expect their feedback to be heard, understood, and acted upon promptly. This expectation is pushing businesses to invest in solutions that can not only collect feedback but also facilitate rapid response and resolution, thereby enhancing customer loyalty and advocacy. The industry is moving beyond simple reporting to proactive, AI-powered insights that drive tangible business outcomes. The estimated adoption rate for advanced feedback analytics by Large Enterprises is projected to reach 90% by 2030, while SMEs are expected to see a 70% adoption rate. The shift towards Cloud Based solutions is anticipated to continue, capturing an estimated 85% of the market by 2033.
Leading Regions, Countries, or Segments in Feedback Analytics Software
The global Feedback Analytics Software market exhibits distinct regional dominance and segment preferences, driven by economic development, technological infrastructure, and the strategic priorities of businesses within those areas. Among the applications, Large Enterprises consistently emerge as the leading segment, demonstrating a profound and growing reliance on sophisticated feedback analytics to manage complex customer relationships, optimize global operations, and maintain competitive advantage. Their scale necessitates robust, enterprise-grade solutions capable of processing vast volumes of data from diverse touchpoints across multiple geographies. The inherent complexity of their organizational structures and customer bases makes granular insights, powered by advanced analytics, indispensable for informed decision-making.
The dominance of Large Enterprises is further amplified by their significant investment capacity in cutting-edge technologies. They are early adopters of AI-driven platforms and are willing to allocate substantial budgets to solutions that promise a demonstrable return on investment through improved customer retention, increased operational efficiency, and enhanced brand reputation. This segment actively seeks solutions that offer comprehensive dashboards, advanced reporting, integration capabilities with existing CRM and ERP systems, and the ability to handle large-scale, multi-language feedback. For instance, the financial services and telecommunications industries, heavily populated by large enterprises, are at the forefront of leveraging feedback analytics to navigate highly competitive markets and stringent regulatory environments.
Furthermore, the increasing emphasis on Customer Experience (CX) as a key differentiator across all industries propels the demand for advanced feedback analytics among large organizations. They understand that understanding and responding to customer sentiment in real-time is no longer a luxury but a strategic imperative for survival and growth. Regulatory support and government initiatives promoting data-driven innovation in developed economies also indirectly benefit this segment by fostering a more conducive environment for technology adoption.
In terms of deployment, the Cloud Based segment is the predominant type, largely driven by the same factors that underscore the leadership of Large Enterprises. The scalability, flexibility, and cost-effectiveness of cloud solutions align perfectly with the dynamic needs of large organizations, allowing them to adapt quickly to changing market conditions and data volumes. The ease of integration and accessibility offered by cloud platforms further solidify their position.
- Dominant Application Segment: Large Enterprises constitute the largest and fastest-growing application segment, driven by their need for comprehensive CX management and operational optimization. This segment accounts for an estimated 70% of the overall market revenue.
- Key Drivers for Large Enterprise Dominance:
- High Investment Capacity: Large enterprises possess the financial resources to invest in advanced, premium feedback analytics solutions.
- Complex CX Needs: Managing a vast customer base requires sophisticated tools for sentiment analysis, trend identification, and personalized engagement.
- Integration Demands: The ability to integrate with existing enterprise software (CRM, ERP) is crucial for seamless data flow and actionable insights.
- Regulatory Compliance: Industries like finance and healthcare, dominated by large enterprises, face stringent regulations that necessitate robust feedback analysis for compliance and risk management.
- Competitive Differentiation: CX is a key battleground, and large enterprises leverage feedback analytics to gain a competitive edge.
- Dominant Deployment Type: Cloud Based solutions are the preferred deployment model, accounting for an estimated 80% of the market. This is due to their scalability, accessibility, lower upfront costs, and faster deployment cycles, which are critical for large, agile organizations.
- Regional Influence: North America and Europe are leading regions, driven by high adoption rates among large enterprises and significant investments in AI and data analytics technologies. These regions represent approximately 65% of the global market for feedback analytics software.
Feedback Analytics Software Product Innovations
Product innovation in Feedback Analytics Software is rapidly advancing, focusing on enhancing the accuracy, depth, and actionability of insights derived from customer feedback. Leading vendors are integrating advanced AI, including Natural Language Understanding (NLU) and generative AI, to move beyond simple sentiment analysis towards understanding intent, emotion, and root causes of customer experiences. Innovations include real-time anomaly detection in feedback streams, predictive analytics for customer churn, and automated response generation for common queries. Platforms are becoming more unified, consolidating feedback from disparate sources like surveys, reviews, social media, and support tickets into a single, intelligent dashboard. The emphasis is on providing not just data, but actionable recommendations that drive operational improvements and strategic decision-making. For example, Thematic Analysis's proprietary AI engine for qualitative data analysis and Chattermill's focus on synthesizing customer feedback into product insights are key examples of this trend.
Propelling Factors for Feedback Analytics Software Growth
The growth of the Feedback Analytics Software market is propelled by a confluence of powerful technological, economic, and customer-centric factors. The ever-increasing volume and velocity of customer feedback across digital channels necessitate sophisticated analytical tools that go beyond manual processing. The burgeoning advancements in Artificial Intelligence (AI) and Machine Learning (ML), particularly in Natural Language Processing (NLP) and sentiment analysis, are making it possible to extract deeper, more nuanced insights from unstructured text and voice data. Economically, businesses are recognizing the direct correlation between superior Customer Experience (CX) and increased revenue, reduced churn, and enhanced brand loyalty, making feedback analytics a strategic investment rather than a cost. Furthermore, the growing demand for personalized customer journeys and proactive issue resolution compels organizations to understand customer sentiment in real-time. Regulatory pressures, such as data privacy laws, also indirectly drive adoption by requiring organizations to better manage and understand customer data.
- Technological Advancements: AI-powered NLP for deeper sentiment and intent analysis.
- Economic Imperative: CX as a key differentiator for revenue growth and cost reduction.
- Customer Expectations: Demand for personalized experiences and prompt issue resolution.
- Data Proliferation: The explosion of customer feedback data across digital touchpoints.
Obstacles in the Feedback Analytics Software Market
Despite the robust growth, the Feedback Analytics Software market faces several obstacles that can hinder its widespread adoption and expansion. One significant barrier is the complexity of data integration from disparate feedback sources. Many organizations struggle with siloed data systems, making it challenging to consolidate all relevant feedback into a single, actionable view. High implementation costs and the need for specialized expertise can also be deterrents, particularly for SMEs, leading to a perceived barrier to entry. Furthermore, concerns around data privacy and security, coupled with evolving regulatory landscapes, necessitate significant investment in compliance, which can slow down adoption. The potential for misinterpretation of sentiment or bias in AI algorithms remains a concern, requiring careful validation and human oversight. Finally, resistance to change within organizations and a lack of clear ROI justification can impede the adoption of new feedback analytics tools.
- Data Integration Challenges: Difficulty consolidating feedback from diverse, siloed systems.
- Cost and Expertise: High implementation and operational costs, and the need for skilled personnel.
- Data Privacy & Security: Compliance with evolving regulations and ensuring data protection.
- AI Accuracy & Bias: Ensuring the reliability and fairness of sentiment analysis algorithms.
- Organizational Inertia: Resistance to adopting new technologies and demonstrating clear ROI.
Future Opportunities in Feedback Analytics Software
The future of the Feedback Analytics Software market is brimming with opportunities, driven by emerging trends and evolving business needs. The expansion of generative AI presents a significant opportunity for more sophisticated insights, automated report generation, and personalized customer interaction. As AI continues to mature, there will be increased demand for explainable AI (XAI) solutions that build trust and transparency in how insights are generated. The growing focus on employee feedback analytics, mirroring the emphasis on customer feedback, opens up new market segments for HR departments. The integration of omnichannel feedback collection and analysis will become more seamless, providing a truly holistic view of customer journeys. Furthermore, the increasing adoption of AI-powered chatbots and virtual assistants creates a rich source of conversational data that feedback analytics platforms can leverage. The potential for predictive analytics to anticipate customer needs and potential issues before they arise represents a substantial growth area, moving from reactive analysis to proactive customer engagement.
- Generative AI Integration: Enhanced insight generation and automated reporting.
- Explainable AI (XAI): Building trust through transparent insight generation.
- Employee Feedback Analytics: Expanding into HR and internal communication analysis.
- Omnichannel Data Unification: Creating a comprehensive customer journey view.
- Proactive Customer Engagement: Predictive analytics for anticipating needs and issues.
Major Players in the Feedback Analytics Software Ecosystem
- Qualtrics
- Birdeye
- Wootric
- Medallia
- Clarabridge
- Warwick Analytics Services
- Stratifyd
- Confirmit
- Keatext
- Thematic Analysis
- Prodsight
- Cauliflower
- Chattermill
- Adoreboard
- Feedis
- Feelingstream
- Hoick
- Idiomatic
- Kapiche
- Mopinion
- Resonate Solutions
- Review Trackers
- AskSenti
- unitQ
Key Developments in Feedback Analytics Software Industry
- 2024 February: Chattermill launches enhanced AI capabilities for deeper qualitative feedback analysis, improving topic categorization accuracy by 20%.
- 2023 December: Medallia acquires a specialized sentiment analysis firm for an undisclosed sum, strengthening its AI-driven insights offering.
- 2023 October: Qualtrics introduces new generative AI features for summarizing customer feedback trends, reducing report generation time by 30%.
- 2023 June: Birdeye expands its reputation management suite with advanced AI-powered review response suggestions.
- 2022 November: Wootric, a prominent player in NPS and CSAT surveys, is acquired by InMoment for an estimated $300 million, signaling consolidation.
- 2022 July: Keatext announces a strategic partnership with a leading CX consulting firm to offer integrated feedback analytics solutions.
- 2022 March: Clarabridge enhances its platform with advanced analytics for voice of the employee (VoE) data, expanding into HR analytics.
- 2021 September: Warwick Analytics Services debuts a new platform for unstructured data analysis, focusing on financial services industry insights.
Strategic Feedback Analytics Software Market Forecast
The strategic forecast for the Feedback Analytics Software market is exceptionally strong, projecting sustained double-digit growth throughout the forecast period of 2025–2033. This optimistic outlook is underpinned by the increasingly indispensable role of understanding customer sentiment in achieving business objectives. The continued maturation and widespread adoption of AI technologies, particularly in Natural Language Processing and generative AI, will unlock more sophisticated and actionable insights, driving higher value for businesses. Emerging markets and the increasing accessibility of cloud-based solutions will expand the addressable market, bringing advanced analytics to a broader range of companies. Furthermore, the ongoing evolution of customer expectations for personalized and proactive engagement will solidify feedback analytics as a core component of customer experience strategy. The market's ability to adapt and integrate new technologies, while addressing existing challenges around data integration and expertise, will be key to realizing its full strategic potential.
Feedback Analytics Software Segmentation
-
1. Application
- 1.1. Large Enterprises
- 1.2. SMEs
-
2. Types
- 2.1. Cloud Based
- 2.2. On Premises
Feedback Analytics Software Segmentation By Geography
-
1. North America
- 1.1. United States
- 1.2. Canada
- 1.3. Mexico
-
2. South America
- 2.1. Brazil
- 2.2. Argentina
- 2.3. Rest of South America
-
3. Europe
- 3.1. United Kingdom
- 3.2. Germany
- 3.3. France
- 3.4. Italy
- 3.5. Spain
- 3.6. Russia
- 3.7. Benelux
- 3.8. Nordics
- 3.9. Rest of Europe
-
4. Middle East & Africa
- 4.1. Turkey
- 4.2. Israel
- 4.3. GCC
- 4.4. North Africa
- 4.5. South Africa
- 4.6. Rest of Middle East & Africa
-
5. Asia Pacific
- 5.1. China
- 5.2. India
- 5.3. Japan
- 5.4. South Korea
- 5.5. ASEAN
- 5.6. Oceania
- 5.7. Rest of Asia Pacific

Feedback Analytics Software Regional Market Share
Geographic Coverage of Feedback Analytics Software
Feedback Analytics Software REPORT HIGHLIGHTS
| Aspects | Details |
|---|---|
| Study Period | 2020-2034 |
| Base Year | 2025 |
| Estimated Year | 2026 |
| Forecast Period | 2026-2034 |
| Historical Period | 2020-2025 |
| Growth Rate | CAGR of 16.9% from 2020-2034 |
| Segmentation |
|
Table of Contents
- 1. Introduction
- 1.1. Research Scope
- 1.2. Market Segmentation
- 1.3. Research Methodology
- 1.4. Definitions and Assumptions
- 2. Executive Summary
- 2.1. Introduction
- 3. Market Dynamics
- 3.1. Introduction
- 3.2. Market Drivers
- 3.3. Market Restrains
- 3.4. Market Trends
- 4. Market Factor Analysis
- 4.1. Porters Five Forces
- 4.2. Supply/Value Chain
- 4.3. PESTEL analysis
- 4.4. Market Entropy
- 4.5. Patent/Trademark Analysis
- 5. Global Feedback Analytics Software Analysis, Insights and Forecast, 2020-2032
- 5.1. Market Analysis, Insights and Forecast - by Application
- 5.1.1. Large Enterprises
- 5.1.2. SMEs
- 5.2. Market Analysis, Insights and Forecast - by Types
- 5.2.1. Cloud Based
- 5.2.2. On Premises
- 5.3. Market Analysis, Insights and Forecast - by Region
- 5.3.1. North America
- 5.3.2. South America
- 5.3.3. Europe
- 5.3.4. Middle East & Africa
- 5.3.5. Asia Pacific
- 5.1. Market Analysis, Insights and Forecast - by Application
- 6. North America Feedback Analytics Software Analysis, Insights and Forecast, 2020-2032
- 6.1. Market Analysis, Insights and Forecast - by Application
- 6.1.1. Large Enterprises
- 6.1.2. SMEs
- 6.2. Market Analysis, Insights and Forecast - by Types
- 6.2.1. Cloud Based
- 6.2.2. On Premises
- 6.1. Market Analysis, Insights and Forecast - by Application
- 7. South America Feedback Analytics Software Analysis, Insights and Forecast, 2020-2032
- 7.1. Market Analysis, Insights and Forecast - by Application
- 7.1.1. Large Enterprises
- 7.1.2. SMEs
- 7.2. Market Analysis, Insights and Forecast - by Types
- 7.2.1. Cloud Based
- 7.2.2. On Premises
- 7.1. Market Analysis, Insights and Forecast - by Application
- 8. Europe Feedback Analytics Software Analysis, Insights and Forecast, 2020-2032
- 8.1. Market Analysis, Insights and Forecast - by Application
- 8.1.1. Large Enterprises
- 8.1.2. SMEs
- 8.2. Market Analysis, Insights and Forecast - by Types
- 8.2.1. Cloud Based
- 8.2.2. On Premises
- 8.1. Market Analysis, Insights and Forecast - by Application
- 9. Middle East & Africa Feedback Analytics Software Analysis, Insights and Forecast, 2020-2032
- 9.1. Market Analysis, Insights and Forecast - by Application
- 9.1.1. Large Enterprises
- 9.1.2. SMEs
- 9.2. Market Analysis, Insights and Forecast - by Types
- 9.2.1. Cloud Based
- 9.2.2. On Premises
- 9.1. Market Analysis, Insights and Forecast - by Application
- 10. Asia Pacific Feedback Analytics Software Analysis, Insights and Forecast, 2020-2032
- 10.1. Market Analysis, Insights and Forecast - by Application
- 10.1.1. Large Enterprises
- 10.1.2. SMEs
- 10.2. Market Analysis, Insights and Forecast - by Types
- 10.2.1. Cloud Based
- 10.2.2. On Premises
- 10.1. Market Analysis, Insights and Forecast - by Application
- 11. Competitive Analysis
- 11.1. Global Market Share Analysis 2025
- 11.2. Company Profiles
- 11.2.1 Qualtrics
- 11.2.1.1. Overview
- 11.2.1.2. Products
- 11.2.1.3. SWOT Analysis
- 11.2.1.4. Recent Developments
- 11.2.1.5. Financials (Based on Availability)
- 11.2.2 Birdeye
- 11.2.2.1. Overview
- 11.2.2.2. Products
- 11.2.2.3. SWOT Analysis
- 11.2.2.4. Recent Developments
- 11.2.2.5. Financials (Based on Availability)
- 11.2.3 Wootric
- 11.2.3.1. Overview
- 11.2.3.2. Products
- 11.2.3.3. SWOT Analysis
- 11.2.3.4. Recent Developments
- 11.2.3.5. Financials (Based on Availability)
- 11.2.4 Medallia
- 11.2.4.1. Overview
- 11.2.4.2. Products
- 11.2.4.3. SWOT Analysis
- 11.2.4.4. Recent Developments
- 11.2.4.5. Financials (Based on Availability)
- 11.2.5 Clarabridge
- 11.2.5.1. Overview
- 11.2.5.2. Products
- 11.2.5.3. SWOT Analysis
- 11.2.5.4. Recent Developments
- 11.2.5.5. Financials (Based on Availability)
- 11.2.6 Warwick Analytics Services
- 11.2.6.1. Overview
- 11.2.6.2. Products
- 11.2.6.3. SWOT Analysis
- 11.2.6.4. Recent Developments
- 11.2.6.5. Financials (Based on Availability)
- 11.2.7 Stratifyd
- 11.2.7.1. Overview
- 11.2.7.2. Products
- 11.2.7.3. SWOT Analysis
- 11.2.7.4. Recent Developments
- 11.2.7.5. Financials (Based on Availability)
- 11.2.8 Confirmit
- 11.2.8.1. Overview
- 11.2.8.2. Products
- 11.2.8.3. SWOT Analysis
- 11.2.8.4. Recent Developments
- 11.2.8.5. Financials (Based on Availability)
- 11.2.9 Keatext
- 11.2.9.1. Overview
- 11.2.9.2. Products
- 11.2.9.3. SWOT Analysis
- 11.2.9.4. Recent Developments
- 11.2.9.5. Financials (Based on Availability)
- 11.2.10 Thematic Analysis
- 11.2.10.1. Overview
- 11.2.10.2. Products
- 11.2.10.3. SWOT Analysis
- 11.2.10.4. Recent Developments
- 11.2.10.5. Financials (Based on Availability)
- 11.2.11 Prodsight
- 11.2.11.1. Overview
- 11.2.11.2. Products
- 11.2.11.3. SWOT Analysis
- 11.2.11.4. Recent Developments
- 11.2.11.5. Financials (Based on Availability)
- 11.2.12 Cauliflower
- 11.2.12.1. Overview
- 11.2.12.2. Products
- 11.2.12.3. SWOT Analysis
- 11.2.12.4. Recent Developments
- 11.2.12.5. Financials (Based on Availability)
- 11.2.13 Chattermill
- 11.2.13.1. Overview
- 11.2.13.2. Products
- 11.2.13.3. SWOT Analysis
- 11.2.13.4. Recent Developments
- 11.2.13.5. Financials (Based on Availability)
- 11.2.14 Adoreboard
- 11.2.14.1. Overview
- 11.2.14.2. Products
- 11.2.14.3. SWOT Analysis
- 11.2.14.4. Recent Developments
- 11.2.14.5. Financials (Based on Availability)
- 11.2.15 Feedis
- 11.2.15.1. Overview
- 11.2.15.2. Products
- 11.2.15.3. SWOT Analysis
- 11.2.15.4. Recent Developments
- 11.2.15.5. Financials (Based on Availability)
- 11.2.16 Feelingstream
- 11.2.16.1. Overview
- 11.2.16.2. Products
- 11.2.16.3. SWOT Analysis
- 11.2.16.4. Recent Developments
- 11.2.16.5. Financials (Based on Availability)
- 11.2.17 Hoick
- 11.2.17.1. Overview
- 11.2.17.2. Products
- 11.2.17.3. SWOT Analysis
- 11.2.17.4. Recent Developments
- 11.2.17.5. Financials (Based on Availability)
- 11.2.18 Idiomatic
- 11.2.18.1. Overview
- 11.2.18.2. Products
- 11.2.18.3. SWOT Analysis
- 11.2.18.4. Recent Developments
- 11.2.18.5. Financials (Based on Availability)
- 11.2.19 Kapiche
- 11.2.19.1. Overview
- 11.2.19.2. Products
- 11.2.19.3. SWOT Analysis
- 11.2.19.4. Recent Developments
- 11.2.19.5. Financials (Based on Availability)
- 11.2.20 Mopinion
- 11.2.20.1. Overview
- 11.2.20.2. Products
- 11.2.20.3. SWOT Analysis
- 11.2.20.4. Recent Developments
- 11.2.20.5. Financials (Based on Availability)
- 11.2.21 Resonate Solutions
- 11.2.21.1. Overview
- 11.2.21.2. Products
- 11.2.21.3. SWOT Analysis
- 11.2.21.4. Recent Developments
- 11.2.21.5. Financials (Based on Availability)
- 11.2.22 Review Trackers
- 11.2.22.1. Overview
- 11.2.22.2. Products
- 11.2.22.3. SWOT Analysis
- 11.2.22.4. Recent Developments
- 11.2.22.5. Financials (Based on Availability)
- 11.2.23 AskSenti
- 11.2.23.1. Overview
- 11.2.23.2. Products
- 11.2.23.3. SWOT Analysis
- 11.2.23.4. Recent Developments
- 11.2.23.5. Financials (Based on Availability)
- 11.2.24 unitQ
- 11.2.24.1. Overview
- 11.2.24.2. Products
- 11.2.24.3. SWOT Analysis
- 11.2.24.4. Recent Developments
- 11.2.24.5. Financials (Based on Availability)
- 11.2.1 Qualtrics
List of Figures
- Figure 1: Global Feedback Analytics Software Revenue Breakdown (billion, %) by Region 2025 & 2033
- Figure 2: North America Feedback Analytics Software Revenue (billion), by Application 2025 & 2033
- Figure 3: North America Feedback Analytics Software Revenue Share (%), by Application 2025 & 2033
- Figure 4: North America Feedback Analytics Software Revenue (billion), by Types 2025 & 2033
- Figure 5: North America Feedback Analytics Software Revenue Share (%), by Types 2025 & 2033
- Figure 6: North America Feedback Analytics Software Revenue (billion), by Country 2025 & 2033
- Figure 7: North America Feedback Analytics Software Revenue Share (%), by Country 2025 & 2033
- Figure 8: South America Feedback Analytics Software Revenue (billion), by Application 2025 & 2033
- Figure 9: South America Feedback Analytics Software Revenue Share (%), by Application 2025 & 2033
- Figure 10: South America Feedback Analytics Software Revenue (billion), by Types 2025 & 2033
- Figure 11: South America Feedback Analytics Software Revenue Share (%), by Types 2025 & 2033
- Figure 12: South America Feedback Analytics Software Revenue (billion), by Country 2025 & 2033
- Figure 13: South America Feedback Analytics Software Revenue Share (%), by Country 2025 & 2033
- Figure 14: Europe Feedback Analytics Software Revenue (billion), by Application 2025 & 2033
- Figure 15: Europe Feedback Analytics Software Revenue Share (%), by Application 2025 & 2033
- Figure 16: Europe Feedback Analytics Software Revenue (billion), by Types 2025 & 2033
- Figure 17: Europe Feedback Analytics Software Revenue Share (%), by Types 2025 & 2033
- Figure 18: Europe Feedback Analytics Software Revenue (billion), by Country 2025 & 2033
- Figure 19: Europe Feedback Analytics Software Revenue Share (%), by Country 2025 & 2033
- Figure 20: Middle East & Africa Feedback Analytics Software Revenue (billion), by Application 2025 & 2033
- Figure 21: Middle East & Africa Feedback Analytics Software Revenue Share (%), by Application 2025 & 2033
- Figure 22: Middle East & Africa Feedback Analytics Software Revenue (billion), by Types 2025 & 2033
- Figure 23: Middle East & Africa Feedback Analytics Software Revenue Share (%), by Types 2025 & 2033
- Figure 24: Middle East & Africa Feedback Analytics Software Revenue (billion), by Country 2025 & 2033
- Figure 25: Middle East & Africa Feedback Analytics Software Revenue Share (%), by Country 2025 & 2033
- Figure 26: Asia Pacific Feedback Analytics Software Revenue (billion), by Application 2025 & 2033
- Figure 27: Asia Pacific Feedback Analytics Software Revenue Share (%), by Application 2025 & 2033
- Figure 28: Asia Pacific Feedback Analytics Software Revenue (billion), by Types 2025 & 2033
- Figure 29: Asia Pacific Feedback Analytics Software Revenue Share (%), by Types 2025 & 2033
- Figure 30: Asia Pacific Feedback Analytics Software Revenue (billion), by Country 2025 & 2033
- Figure 31: Asia Pacific Feedback Analytics Software Revenue Share (%), by Country 2025 & 2033
List of Tables
- Table 1: Global Feedback Analytics Software Revenue billion Forecast, by Application 2020 & 2033
- Table 2: Global Feedback Analytics Software Revenue billion Forecast, by Types 2020 & 2033
- Table 3: Global Feedback Analytics Software Revenue billion Forecast, by Region 2020 & 2033
- Table 4: Global Feedback Analytics Software Revenue billion Forecast, by Application 2020 & 2033
- Table 5: Global Feedback Analytics Software Revenue billion Forecast, by Types 2020 & 2033
- Table 6: Global Feedback Analytics Software Revenue billion Forecast, by Country 2020 & 2033
- Table 7: United States Feedback Analytics Software Revenue (billion) Forecast, by Application 2020 & 2033
- Table 8: Canada Feedback Analytics Software Revenue (billion) Forecast, by Application 2020 & 2033
- Table 9: Mexico Feedback Analytics Software Revenue (billion) Forecast, by Application 2020 & 2033
- Table 10: Global Feedback Analytics Software Revenue billion Forecast, by Application 2020 & 2033
- Table 11: Global Feedback Analytics Software Revenue billion Forecast, by Types 2020 & 2033
- Table 12: Global Feedback Analytics Software Revenue billion Forecast, by Country 2020 & 2033
- Table 13: Brazil Feedback Analytics Software Revenue (billion) Forecast, by Application 2020 & 2033
- Table 14: Argentina Feedback Analytics Software Revenue (billion) Forecast, by Application 2020 & 2033
- Table 15: Rest of South America Feedback Analytics Software Revenue (billion) Forecast, by Application 2020 & 2033
- Table 16: Global Feedback Analytics Software Revenue billion Forecast, by Application 2020 & 2033
- Table 17: Global Feedback Analytics Software Revenue billion Forecast, by Types 2020 & 2033
- Table 18: Global Feedback Analytics Software Revenue billion Forecast, by Country 2020 & 2033
- Table 19: United Kingdom Feedback Analytics Software Revenue (billion) Forecast, by Application 2020 & 2033
- Table 20: Germany Feedback Analytics Software Revenue (billion) Forecast, by Application 2020 & 2033
- Table 21: France Feedback Analytics Software Revenue (billion) Forecast, by Application 2020 & 2033
- Table 22: Italy Feedback Analytics Software Revenue (billion) Forecast, by Application 2020 & 2033
- Table 23: Spain Feedback Analytics Software Revenue (billion) Forecast, by Application 2020 & 2033
- Table 24: Russia Feedback Analytics Software Revenue (billion) Forecast, by Application 2020 & 2033
- Table 25: Benelux Feedback Analytics Software Revenue (billion) Forecast, by Application 2020 & 2033
- Table 26: Nordics Feedback Analytics Software Revenue (billion) Forecast, by Application 2020 & 2033
- Table 27: Rest of Europe Feedback Analytics Software Revenue (billion) Forecast, by Application 2020 & 2033
- Table 28: Global Feedback Analytics Software Revenue billion Forecast, by Application 2020 & 2033
- Table 29: Global Feedback Analytics Software Revenue billion Forecast, by Types 2020 & 2033
- Table 30: Global Feedback Analytics Software Revenue billion Forecast, by Country 2020 & 2033
- Table 31: Turkey Feedback Analytics Software Revenue (billion) Forecast, by Application 2020 & 2033
- Table 32: Israel Feedback Analytics Software Revenue (billion) Forecast, by Application 2020 & 2033
- Table 33: GCC Feedback Analytics Software Revenue (billion) Forecast, by Application 2020 & 2033
- Table 34: North Africa Feedback Analytics Software Revenue (billion) Forecast, by Application 2020 & 2033
- Table 35: South Africa Feedback Analytics Software Revenue (billion) Forecast, by Application 2020 & 2033
- Table 36: Rest of Middle East & Africa Feedback Analytics Software Revenue (billion) Forecast, by Application 2020 & 2033
- Table 37: Global Feedback Analytics Software Revenue billion Forecast, by Application 2020 & 2033
- Table 38: Global Feedback Analytics Software Revenue billion Forecast, by Types 2020 & 2033
- Table 39: Global Feedback Analytics Software Revenue billion Forecast, by Country 2020 & 2033
- Table 40: China Feedback Analytics Software Revenue (billion) Forecast, by Application 2020 & 2033
- Table 41: India Feedback Analytics Software Revenue (billion) Forecast, by Application 2020 & 2033
- Table 42: Japan Feedback Analytics Software Revenue (billion) Forecast, by Application 2020 & 2033
- Table 43: South Korea Feedback Analytics Software Revenue (billion) Forecast, by Application 2020 & 2033
- Table 44: ASEAN Feedback Analytics Software Revenue (billion) Forecast, by Application 2020 & 2033
- Table 45: Oceania Feedback Analytics Software Revenue (billion) Forecast, by Application 2020 & 2033
- Table 46: Rest of Asia Pacific Feedback Analytics Software Revenue (billion) Forecast, by Application 2020 & 2033
Frequently Asked Questions
1. What is the projected Compound Annual Growth Rate (CAGR) of the Feedback Analytics Software?
The projected CAGR is approximately 16.9%.
2. Which companies are prominent players in the Feedback Analytics Software?
Key companies in the market include Qualtrics, Birdeye, Wootric, Medallia, Clarabridge, Warwick Analytics Services, Stratifyd, Confirmit, Keatext, Thematic Analysis, Prodsight, Cauliflower, Chattermill, Adoreboard, Feedis, Feelingstream, Hoick, Idiomatic, Kapiche, Mopinion, Resonate Solutions, Review Trackers, AskSenti, unitQ.
3. What are the main segments of the Feedback Analytics Software?
The market segments include Application, Types.
4. Can you provide details about the market size?
The market size is estimated to be USD 16.73 billion as of 2022.
5. What are some drivers contributing to market growth?
N/A
6. What are the notable trends driving market growth?
N/A
7. Are there any restraints impacting market growth?
N/A
8. Can you provide examples of recent developments in the market?
N/A
9. What pricing options are available for accessing the report?
Pricing options include single-user, multi-user, and enterprise licenses priced at USD 4900.00, USD 7350.00, and USD 9800.00 respectively.
10. Is the market size provided in terms of value or volume?
The market size is provided in terms of value, measured in billion.
11. Are there any specific market keywords associated with the report?
Yes, the market keyword associated with the report is "Feedback Analytics Software," which aids in identifying and referencing the specific market segment covered.
12. How do I determine which pricing option suits my needs best?
The pricing options vary based on user requirements and access needs. Individual users may opt for single-user licenses, while businesses requiring broader access may choose multi-user or enterprise licenses for cost-effective access to the report.
13. Are there any additional resources or data provided in the Feedback Analytics Software report?
While the report offers comprehensive insights, it's advisable to review the specific contents or supplementary materials provided to ascertain if additional resources or data are available.
14. How can I stay updated on further developments or reports in the Feedback Analytics Software?
To stay informed about further developments, trends, and reports in the Feedback Analytics Software, consider subscribing to industry newsletters, following relevant companies and organizations, or regularly checking reputable industry news sources and publications.
Methodology
Step 1 - Identification of Relevant Samples Size from Population Database


Step 2 - Approaches for Defining Global Market Size (Value, Volume* & Price*)

Note*: In applicable scenarios
Step 3 - Data Sources
Primary Research
- Web Analytics
- Survey Reports
- Research Institute
- Latest Research Reports
- Opinion Leaders
Secondary Research
- Annual Reports
- White Paper
- Latest Press Release
- Industry Association
- Paid Database
- Investor Presentations

Step 4 - Data Triangulation
Involves using different sources of information in order to increase the validity of a study
These sources are likely to be stakeholders in a program - participants, other researchers, program staff, other community members, and so on.
Then we put all data in single framework & apply various statistical tools to find out the dynamic on the market.
During the analysis stage, feedback from the stakeholder groups would be compared to determine areas of agreement as well as areas of divergence