

Key Insights
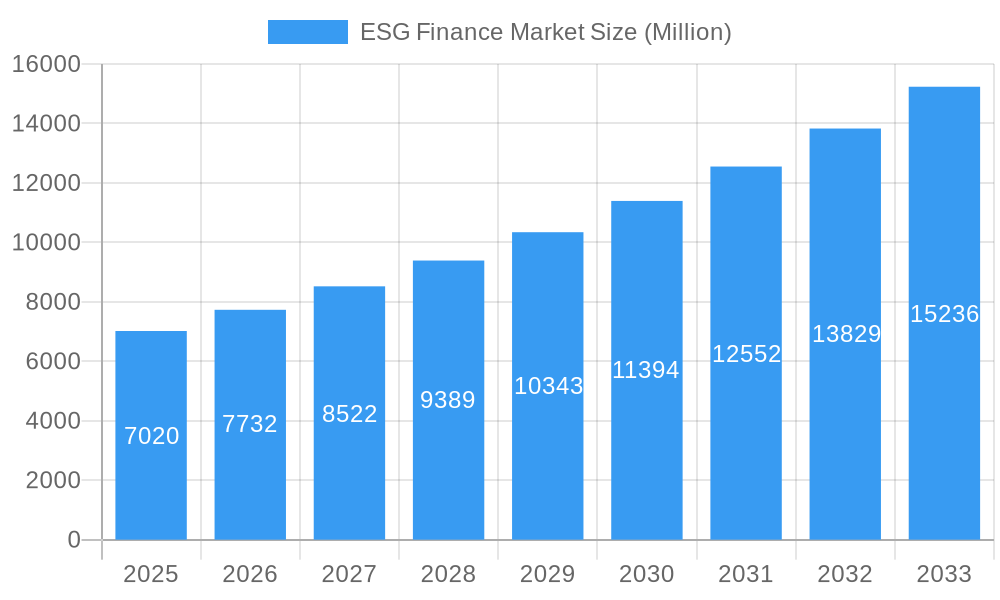
The ESG (Environmental, Social, and Governance) finance market is experiencing robust growth, projected to reach \$7.02 billion in 2025 and maintain a Compound Annual Growth Rate (CAGR) of 10.04% from 2025 to 2033. This expansion is driven by increasing investor demand for sustainable investments, stricter regulatory frameworks promoting ESG disclosures and responsible investing, and growing awareness among corporations about their environmental and social impact. Key trends include the rise of impact investing, green bonds, and sustainable finance initiatives, alongside the increasing integration of ESG factors into traditional investment strategies. While data on specific regional breakdowns is unavailable, we can infer significant market presence across North America and Europe, given the concentration of major players like BlackRock, State Street, and UBS in these regions. Furthermore, the market's growth is fueled by a growing pool of capital targeting ESG-aligned opportunities, as investors seek both financial returns and positive societal and environmental impact.
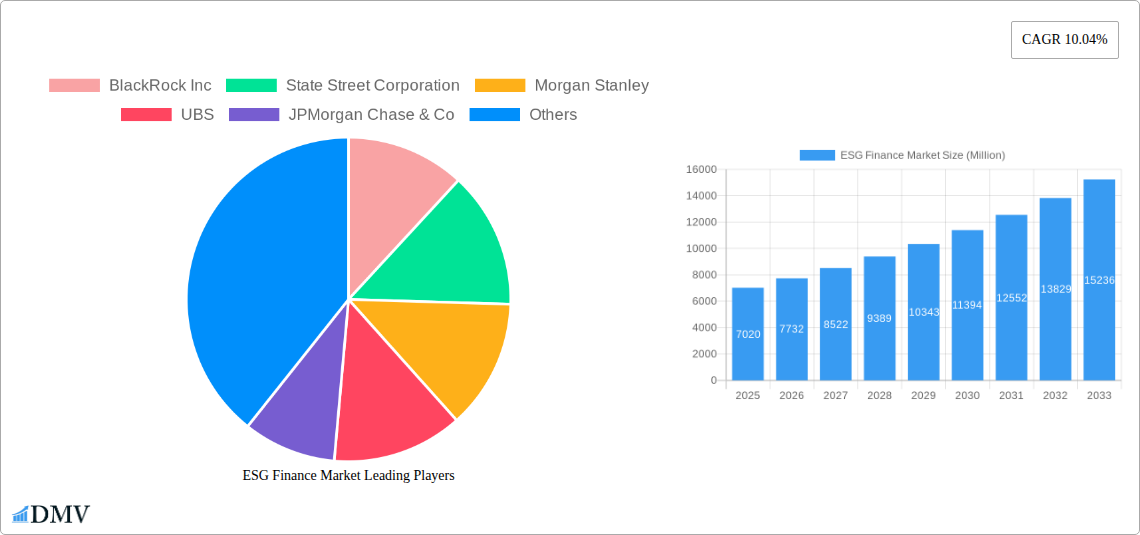
ESG Finance Market Market Size (In Billion)
Despite the strong growth trajectory, challenges remain. These include the lack of standardized ESG metrics and reporting frameworks, which can hinder accurate assessment and comparison across companies and investments. Furthermore, concerns about "greenwashing" – the practice of making misleading or unsubstantiated claims about environmental or social performance – present a significant risk. Overcoming these challenges through greater transparency and the development of robust, universally accepted ESG standards will be crucial for continued sustainable market expansion. The leading players in this market – including BlackRock, State Street, Morgan Stanley, UBS, JPMorgan Chase, and others – are actively shaping this landscape through their product offerings, investment strategies, and engagement with companies on ESG issues. The continued innovation and competition within this sector will drive further market expansion and contribute to a more sustainable global financial system.
ESG Finance Market Company Market Share
ESG Finance Market: A Comprehensive Report (2019-2033)
This insightful report provides a detailed analysis of the ESG (Environmental, Social, and Governance) Finance Market, offering a comprehensive overview of its current state and future trajectory. Covering the historical period (2019-2024), base year (2025), and forecast period (2025-2033), this report is an indispensable resource for stakeholders seeking to understand and capitalize on the burgeoning opportunities within this dynamic market. The global ESG Finance market is projected to reach xx Million by 2033, exhibiting a CAGR of xx% during the forecast period.
ESG Finance Market Composition & Trends
The ESG finance market is characterized by a moderately concentrated landscape with key players vying for market share. BlackRock Inc, State Street Corporation, Morgan Stanley, UBS, JPMorgan Chase & Co, Franklin Templeton Investments, Amundi US, The Bank of New York Mellon Corporation, Deutsche Bank AG, and Goldman Sachs are some of the prominent players, though the list is not exhaustive. Market share distribution among these firms varies significantly, with BlackRock holding a substantial portion. Innovation is driven by increasing regulatory scrutiny, technological advancements (like AI-driven ESG data analysis), and the growing demand for sustainable investment solutions.
- Market Concentration: High, with a few dominant players controlling a significant portion of the market. Exact figures are unavailable but BlackRock and State Street are expected to possess the largest market share individually.
- Innovation Catalysts: Stringent ESG regulations, technological advancements in data analytics and reporting, and investor pressure for transparency.
- Regulatory Landscape: Evolving and increasingly stringent regulations globally are shaping the market dynamics and driving the adoption of ESG principles.
- Substitute Products: Limited direct substitutes, but traditional finance products face increasing competition from ESG-focused alternatives.
- End-User Profiles: Institutional investors (pension funds, insurance companies), retail investors increasingly incorporating ESG considerations into their portfolios, and corporations seeking to improve their ESG profiles.
- M&A Activities: Significant M&A activity observed in recent years, driven by consolidation and expansion strategies. Recent deals include State Street's acquisition of CF Global Trading (February 2024) and BlackRock's acquisition of GIP (January 2024), for USD 3 Billion and approximately 12 million BlackRock shares. Morgan Stanley Investment Management also acquired Sacyr S.A. (October 2023). The total M&A deal value in 2023 is estimated to be around xx Million.
ESG Finance Market Industry Evolution
The ESG finance market has experienced rapid growth in recent years, fueled by several factors. Increased awareness of environmental and social issues, coupled with stricter regulatory frameworks, has driven the demand for sustainable investment products. Technological advancements, including the development of sophisticated ESG data analytics tools and platforms, have facilitated the growth of the market by enhancing transparency and efficiency. The evolving demands of consumers and investors, who increasingly prioritize ESG factors in their investment decisions, further accelerate the market’s expansion. The market witnessed a growth rate of xx% between 2019 and 2024, and this trajectory is expected to continue during the forecast period, with the market size projected to reach xx Million by 2033. Adoption metrics, such as the number of ESG-focused funds and the total assets under management in these funds, show a significant upward trend.
Leading Regions, Countries, or Segments in ESG Finance Market
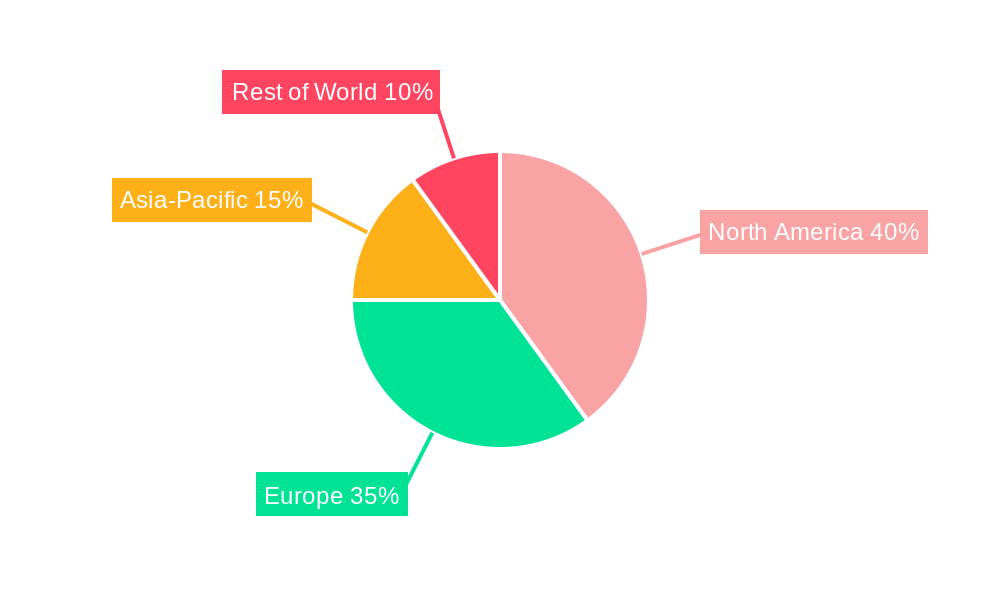
The global ESG finance market is experiencing dynamic growth, with distinct regional strengths and evolving investor preferences. North America currently leads in market share, propelled by robust regulatory frameworks, a deeply ingrained investor culture prioritizing sustainability, and a sophisticated financial ecosystem conducive to ESG integration. Following closely, Europe is a significant growth engine, largely influenced by ambitious regulatory initiatives such as the EU's Sustainable Finance Disclosure Regulation (SFDR) and the Taxonomy Regulation, which are mandating greater transparency and accountability in sustainable investments. The Asia-Pacific region is emerging as a pivotal growth frontier, characterized by escalating awareness of ESG imperatives, burgeoning institutional investor participation, and increasing government support for sustainable finance initiatives.
- Key Drivers for North American Dominance: A proactive and comprehensive regulatory environment, exceptionally high investor appetite for ESG-aligned assets, and mature financial markets that facilitate seamless integration of sustainability considerations.
- Key Drivers for European Growth: The impetus from stringent regulations like SFDR and the EU Taxonomy, amplified demand from institutional investors seeking to meet fiduciary duties, and a heightened consumer and corporate consciousness regarding environmental and social impacts.
- Key Drivers for Asia-Pacific Expansion: Rapidly growing awareness of ESG risks and opportunities, substantial government-led strategies and incentives promoting sustainable development, and a marked increase in interest from both institutional and retail investors keen on contributing to a sustainable future.
The overarching dominance in this market is a testament to a confluence of factors including strong governmental and regulatory endorsement, the availability of substantial capital pools, and a highly informed investor base that recognizes the long-term value creation potential of ESG integration.
ESG Finance Market Product Innovations
Recent product innovations in the ESG finance market include the development of sophisticated ESG data analytics platforms, the launch of innovative ESG-linked bonds and loans, and the creation of specialized ESG investment funds tailored to specific sustainability goals. These innovations provide improved transparency, enhanced risk management capabilities, and increased investor engagement in sustainable finance initiatives. The unique selling propositions often revolve around enhanced data transparency, customized solutions for investors, and robust risk management strategies.
Propelling Factors for ESG Finance Market Growth
Several factors are driving the growth of the ESG finance market. Increasing regulatory pressure on companies to disclose their ESG performance is a key driver. Growing investor demand for sustainable investments, coupled with technological advancements in ESG data analytics and reporting, is another important factor. Furthermore, rising consumer awareness and demand for environmentally and socially responsible products and services are contributing significantly to market expansion.
Obstacles in the ESG Finance Market
Despite its robust growth, the ESG finance market navigates several significant challenges. A primary hurdle is the lack of standardization in ESG data and reporting. This fragmentation makes it arduous for investors to conduct accurate comparative analyses of companies' sustainability performance, leading to potential misallocations of capital. The persistent issue of greenwashing, where entities deceptively market their ESG credentials, continues to erode investor trust and market integrity. Furthermore, the complexity and susceptibility of global supply chains to disruptions can profoundly impact a company's actual sustainability performance and its ability to access ESG-linked financing. The substantial upfront cost associated with implementing robust ESG initiatives can also present a barrier, particularly for smaller and medium-sized enterprises (SMEs), potentially creating an uneven playing field.
Future Opportunities in ESG Finance Market
The horizon for ESG finance is brimming with promising opportunities. A significant avenue for expansion lies in the penetration of emerging markets, where the burgeoning demand for sustainable investment solutions is rapidly outpacing supply. Technological advancements, particularly the integration of Artificial Intelligence (AI) and Machine Learning (ML), are poised to revolutionize ESG data analysis, enhancing accuracy, efficiency, and transparency across the market. The intensifying global focus on climate-related financial risks, as evidenced by frameworks like the Task Force on Climate-related Financial Disclosures (TCFD), will continue to fuel substantial growth in climate finance, a critical and expanding segment within the broader ESG finance landscape. Additionally, opportunities exist in developing more innovative and accessible ESG investment products, catering to a wider range of investor needs and risk appetites.
Major Players in the ESG Finance Market Ecosystem
- BlackRock Inc. (A global leader in investment management, actively integrating ESG considerations into its vast portfolio and offering a wide array of sustainable investment products.)
- State Street Corporation (A prominent custodian bank and financial services company, providing critical infrastructure and services for ESG data management and sustainable investing.)
- Morgan Stanley (A leading global financial services firm, actively involved in sustainable finance advisory, investment banking, and wealth management, with a strong commitment to ESG integration.)
- UBS (A Swiss multinational investment bank and financial services company, recognized for its pioneering work in sustainable investing and its comprehensive ESG product offerings.)
- JPMorgan Chase & Co. (A major global financial institution, increasingly committing resources to sustainable finance, including green bonds and ESG-focused investment strategies.)
- Franklin Templeton Investments (A global investment management organization that has been expanding its ESG capabilities and product suite to meet growing investor demand.)
- Amundi US (A leading European asset manager with a significant global presence, known for its strong expertise and commitment to responsible and sustainable investing.)
- The Bank of New York Mellon Corporation (A global investment company providing services to institutional investors, playing a key role in the infrastructure for sustainable finance.)
- Deutsche Bank AG (A leading German bank with a significant commitment to sustainable finance, actively involved in green finance and ESG advisory services.)
- Goldman Sachs (A premier global investment banking, securities, and investment management firm, actively involved in structuring and underwriting ESG-related financial products and services.)
- *List Not Exhaustive - The ESG finance market is characterized by a diverse and evolving ecosystem of asset managers, banks, data providers, rating agencies, and regulatory bodies.
Key Developments in ESG Finance Market Industry
- February 2024: State Street Corporation strategically acquired CF Global Trading, a move designed to enhance its agency-based trading services and provide clients with more sophisticated execution capabilities, including those relevant to ESG-focused portfolios.
- January 2024: BlackRock significantly bolstered its alternative assets division by acquiring Global Infrastructure Partners (GIP) for USD 3 Billion and approximately 12 million BlackRock common shares. This acquisition strengthens BlackRock's position in key infrastructure sectors, which are crucial for the transition to a sustainable economy.
- October 2023: Morgan Stanley Investment Management expanded its private infrastructure investment portfolio through the acquisition of Sacyr S.A. This strategic move allows Morgan Stanley to further invest in and develop sustainable infrastructure projects, aligning with global climate goals.
Strategic ESG Finance Market Forecast
The ESG finance market is poised for continued robust growth, driven by increasing regulatory pressures, rising investor demand for sustainable investments, and technological advancements in data analytics. The market's expansion into emerging markets and the development of innovative financial products will further fuel its growth trajectory, creating substantial opportunities for stakeholders across the value chain. The continued focus on climate change and the need for a more sustainable global economy will solidify the long-term growth outlook for the ESG finance market.
ESG Finance Market Segmentation
-
1. Investment Type
- 1.1. Equity, Fixed Income, Mixed Allocation
- 1.2. Other Investment Types
-
2. Transaction Type
- 2.1. Green Bond
- 2.2. Social Bond
- 2.3. Mixed Sustainability Bond
- 2.4. ESG Integrated Investment Funds
- 2.5. Other Transaction Types
-
3. Investor Type
- 3.1. Institutional Investors
- 3.2. Retail Investors
-
4. Industry Vertical
- 4.1. Utilities
- 4.2. Transport & Logistics
- 4.3. Chemicals
- 4.4. Food and Beverage
- 4.5. Government
- 4.6. Other Industry Verticals
-
5. North America
- 5.1. United States
- 5.2. Canada
- 5.3. Mexico
- 5.4. Rest of North America
-
6. Europe
- 6.1. United Kingdom
- 6.2. Germany
- 6.3. France
- 6.4. Russia
- 6.5. Italy
- 6.6. Spain
- 6.7. Rest of Europe
-
7. Asia-Pacific
- 7.1. India
- 7.2. China
- 7.3. Japan
- 7.4. Australia
- 7.5. Rest of Asia-Pacific
-
8. South America
- 8.1. Brazil
- 8.2. Argentina
- 8.3. Rest of South America
-
9. Middle-East and Africa
- 9.1. United Arab Emirates
- 9.2. South Africa
- 9.3. Rest of Middle-East and Africa
ESG Finance Market Segmentation By Geography
-
1. North America
- 1.1. United States
- 1.2. Canada
- 1.3. Mexico
-
2. South America
- 2.1. Brazil
- 2.2. Argentina
- 2.3. Rest of South America
-
3. Europe
- 3.1. United Kingdom
- 3.2. Germany
- 3.3. France
- 3.4. Italy
- 3.5. Spain
- 3.6. Russia
- 3.7. Benelux
- 3.8. Nordics
- 3.9. Rest of Europe
-
4. Middle East & Africa
- 4.1. Turkey
- 4.2. Israel
- 4.3. GCC
- 4.4. North Africa
- 4.5. South Africa
- 4.6. Rest of Middle East & Africa
-
5. Asia Pacific
- 5.1. China
- 5.2. India
- 5.3. Japan
- 5.4. South Korea
- 5.5. ASEAN
- 5.6. Oceania
- 5.7. Rest of Asia Pacific
ESG Finance Market Regional Market Share
Geographic Coverage of ESG Finance Market
ESG Finance Market REPORT HIGHLIGHTS
| Aspects | Details |
|---|---|
| Study Period | 2020-2034 |
| Base Year | 2025 |
| Estimated Year | 2026 |
| Forecast Period | 2026-2034 |
| Historical Period | 2020-2025 |
| Growth Rate | CAGR of 10.04% from 2020-2034 |
| Segmentation |
|
Table of Contents
- 1. Introduction
- 1.1. Research Scope
- 1.2. Market Segmentation
- 1.3. Research Objective
- 1.4. Definitions and Assumptions
- 2. Executive Summary
- 2.1. Market Snapshot
- 3. Market Dynamics
- 3.1. Market Drivers
- 3.2. Market Restrains
- 3.3. Market Trends
- 3.4. Market Opportunities
- 4. Market Factor Analysis
- 4.1. Porters Five Forces
- 4.1.1. Bargaining Power of Suppliers
- 4.1.2. Bargaining Power of Buyers
- 4.1.3. Threat of New Entrants
- 4.1.4. Threat of Substitutes
- 4.1.5. Competitive Rivalry
- 4.2. PESTEL analysis
- 4.3. BCG Analysis
- 4.3.1. Stars (High Growth, High Market Share)
- 4.3.2. Cash Cows (Low Growth, High Market Share)
- 4.3.3. Question Mark (High Growth, Low Market Share)
- 4.3.4. Dogs (Low Growth, Low Market Share)
- 4.4. Ansoff Matrix Analysis
- 4.5. Supply Chain Analysis
- 4.6. Regulatory Landscape
- 4.7. Current Market Potential and Opportunity Assessment (TAM–SAM–SOM Framework)
- 4.8. DMV Analyst Note
- 4.1. Porters Five Forces
- 5. Market Analysis, Insights and Forecast 2021-2033
- 5.1. Market Analysis, Insights and Forecast - by Investment Type
- 5.1.1. Equity, Fixed Income, Mixed Allocation
- 5.1.2. Other Investment Types
- 5.2. Market Analysis, Insights and Forecast - by Transaction Type
- 5.2.1. Green Bond
- 5.2.2. Social Bond
- 5.2.3. Mixed Sustainability Bond
- 5.2.4. ESG Integrated Investment Funds
- 5.2.5. Other Transaction Types
- 5.3. Market Analysis, Insights and Forecast - by Investor Type
- 5.3.1. Institutional Investors
- 5.3.2. Retail Investors
- 5.4. Market Analysis, Insights and Forecast - by Industry Vertical
- 5.4.1. Utilities
- 5.4.2. Transport & Logistics
- 5.4.3. Chemicals
- 5.4.4. Food and Beverage
- 5.4.5. Government
- 5.4.6. Other Industry Verticals
- 5.5. Market Analysis, Insights and Forecast - by North America
- 5.5.1. United States
- 5.5.2. Canada
- 5.5.3. Mexico
- 5.5.4. Rest of North America
- 5.6. Market Analysis, Insights and Forecast - by Europe
- 5.6.1. United Kingdom
- 5.6.2. Germany
- 5.6.3. France
- 5.6.4. Russia
- 5.6.5. Italy
- 5.6.6. Spain
- 5.6.7. Rest of Europe
- 5.7. Market Analysis, Insights and Forecast - by Asia-Pacific
- 5.7.1. India
- 5.7.2. China
- 5.7.3. Japan
- 5.7.4. Australia
- 5.7.5. Rest of Asia-Pacific
- 5.8. Market Analysis, Insights and Forecast - by South America
- 5.8.1. Brazil
- 5.8.2. Argentina
- 5.8.3. Rest of South America
- 5.9. Market Analysis, Insights and Forecast - by Middle-East and Africa
- 5.9.1. United Arab Emirates
- 5.9.2. South Africa
- 5.9.3. Rest of Middle-East and Africa
- 5.10. Market Analysis, Insights and Forecast - by Region
- 5.10.1. North America
- 5.10.2. South America
- 5.10.3. Europe
- 5.10.4. Middle East & Africa
- 5.10.5. Asia Pacific
- 5.1. Market Analysis, Insights and Forecast - by Investment Type
- 6. Global ESG Finance Market Analysis, Insights and Forecast, 2021-2033
- 6.1. Market Analysis, Insights and Forecast - by Investment Type
- 6.1.1. Equity, Fixed Income, Mixed Allocation
- 6.1.2. Other Investment Types
- 6.2. Market Analysis, Insights and Forecast - by Transaction Type
- 6.2.1. Green Bond
- 6.2.2. Social Bond
- 6.2.3. Mixed Sustainability Bond
- 6.2.4. ESG Integrated Investment Funds
- 6.2.5. Other Transaction Types
- 6.3. Market Analysis, Insights and Forecast - by Investor Type
- 6.3.1. Institutional Investors
- 6.3.2. Retail Investors
- 6.4. Market Analysis, Insights and Forecast - by Industry Vertical
- 6.4.1. Utilities
- 6.4.2. Transport & Logistics
- 6.4.3. Chemicals
- 6.4.4. Food and Beverage
- 6.4.5. Government
- 6.4.6. Other Industry Verticals
- 6.5. Market Analysis, Insights and Forecast - by North America
- 6.5.1. United States
- 6.5.2. Canada
- 6.5.3. Mexico
- 6.5.4. Rest of North America
- 6.6. Market Analysis, Insights and Forecast - by Europe
- 6.6.1. United Kingdom
- 6.6.2. Germany
- 6.6.3. France
- 6.6.4. Russia
- 6.6.5. Italy
- 6.6.6. Spain
- 6.6.7. Rest of Europe
- 6.7. Market Analysis, Insights and Forecast - by Asia-Pacific
- 6.7.1. India
- 6.7.2. China
- 6.7.3. Japan
- 6.7.4. Australia
- 6.7.5. Rest of Asia-Pacific
- 6.8. Market Analysis, Insights and Forecast - by South America
- 6.8.1. Brazil
- 6.8.2. Argentina
- 6.8.3. Rest of South America
- 6.9. Market Analysis, Insights and Forecast - by Middle-East and Africa
- 6.9.1. United Arab Emirates
- 6.9.2. South Africa
- 6.9.3. Rest of Middle-East and Africa
- 6.1. Market Analysis, Insights and Forecast - by Investment Type
- 7. North America ESG Finance Market Analysis, Insights and Forecast, 2020-2032
- 7.1. Market Analysis, Insights and Forecast - by Investment Type
- 7.1.1. Equity, Fixed Income, Mixed Allocation
- 7.1.2. Other Investment Types
- 7.2. Market Analysis, Insights and Forecast - by Transaction Type
- 7.2.1. Green Bond
- 7.2.2. Social Bond
- 7.2.3. Mixed Sustainability Bond
- 7.2.4. ESG Integrated Investment Funds
- 7.2.5. Other Transaction Types
- 7.3. Market Analysis, Insights and Forecast - by Investor Type
- 7.3.1. Institutional Investors
- 7.3.2. Retail Investors
- 7.4. Market Analysis, Insights and Forecast - by Industry Vertical
- 7.4.1. Utilities
- 7.4.2. Transport & Logistics
- 7.4.3. Chemicals
- 7.4.4. Food and Beverage
- 7.4.5. Government
- 7.4.6. Other Industry Verticals
- 7.5. Market Analysis, Insights and Forecast - by North America
- 7.5.1. United States
- 7.5.2. Canada
- 7.5.3. Mexico
- 7.5.4. Rest of North America
- 7.6. Market Analysis, Insights and Forecast - by Europe
- 7.6.1. United Kingdom
- 7.6.2. Germany
- 7.6.3. France
- 7.6.4. Russia
- 7.6.5. Italy
- 7.6.6. Spain
- 7.6.7. Rest of Europe
- 7.7. Market Analysis, Insights and Forecast - by Asia-Pacific
- 7.7.1. India
- 7.7.2. China
- 7.7.3. Japan
- 7.7.4. Australia
- 7.7.5. Rest of Asia-Pacific
- 7.8. Market Analysis, Insights and Forecast - by South America
- 7.8.1. Brazil
- 7.8.2. Argentina
- 7.8.3. Rest of South America
- 7.9. Market Analysis, Insights and Forecast - by Middle-East and Africa
- 7.9.1. United Arab Emirates
- 7.9.2. South Africa
- 7.9.3. Rest of Middle-East and Africa
- 7.1. Market Analysis, Insights and Forecast - by Investment Type
- 8. South America ESG Finance Market Analysis, Insights and Forecast, 2020-2032
- 8.1. Market Analysis, Insights and Forecast - by Investment Type
- 8.1.1. Equity, Fixed Income, Mixed Allocation
- 8.1.2. Other Investment Types
- 8.2. Market Analysis, Insights and Forecast - by Transaction Type
- 8.2.1. Green Bond
- 8.2.2. Social Bond
- 8.2.3. Mixed Sustainability Bond
- 8.2.4. ESG Integrated Investment Funds
- 8.2.5. Other Transaction Types
- 8.3. Market Analysis, Insights and Forecast - by Investor Type
- 8.3.1. Institutional Investors
- 8.3.2. Retail Investors
- 8.4. Market Analysis, Insights and Forecast - by Industry Vertical
- 8.4.1. Utilities
- 8.4.2. Transport & Logistics
- 8.4.3. Chemicals
- 8.4.4. Food and Beverage
- 8.4.5. Government
- 8.4.6. Other Industry Verticals
- 8.5. Market Analysis, Insights and Forecast - by North America
- 8.5.1. United States
- 8.5.2. Canada
- 8.5.3. Mexico
- 8.5.4. Rest of North America
- 8.6. Market Analysis, Insights and Forecast - by Europe
- 8.6.1. United Kingdom
- 8.6.2. Germany
- 8.6.3. France
- 8.6.4. Russia
- 8.6.5. Italy
- 8.6.6. Spain
- 8.6.7. Rest of Europe
- 8.7. Market Analysis, Insights and Forecast - by Asia-Pacific
- 8.7.1. India
- 8.7.2. China
- 8.7.3. Japan
- 8.7.4. Australia
- 8.7.5. Rest of Asia-Pacific
- 8.8. Market Analysis, Insights and Forecast - by South America
- 8.8.1. Brazil
- 8.8.2. Argentina
- 8.8.3. Rest of South America
- 8.9. Market Analysis, Insights and Forecast - by Middle-East and Africa
- 8.9.1. United Arab Emirates
- 8.9.2. South Africa
- 8.9.3. Rest of Middle-East and Africa
- 8.1. Market Analysis, Insights and Forecast - by Investment Type
- 9. Europe ESG Finance Market Analysis, Insights and Forecast, 2020-2032
- 9.1. Market Analysis, Insights and Forecast - by Investment Type
- 9.1.1. Equity, Fixed Income, Mixed Allocation
- 9.1.2. Other Investment Types
- 9.2. Market Analysis, Insights and Forecast - by Transaction Type
- 9.2.1. Green Bond
- 9.2.2. Social Bond
- 9.2.3. Mixed Sustainability Bond
- 9.2.4. ESG Integrated Investment Funds
- 9.2.5. Other Transaction Types
- 9.3. Market Analysis, Insights and Forecast - by Investor Type
- 9.3.1. Institutional Investors
- 9.3.2. Retail Investors
- 9.4. Market Analysis, Insights and Forecast - by Industry Vertical
- 9.4.1. Utilities
- 9.4.2. Transport & Logistics
- 9.4.3. Chemicals
- 9.4.4. Food and Beverage
- 9.4.5. Government
- 9.4.6. Other Industry Verticals
- 9.5. Market Analysis, Insights and Forecast - by North America
- 9.5.1. United States
- 9.5.2. Canada
- 9.5.3. Mexico
- 9.5.4. Rest of North America
- 9.6. Market Analysis, Insights and Forecast - by Europe
- 9.6.1. United Kingdom
- 9.6.2. Germany
- 9.6.3. France
- 9.6.4. Russia
- 9.6.5. Italy
- 9.6.6. Spain
- 9.6.7. Rest of Europe
- 9.7. Market Analysis, Insights and Forecast - by Asia-Pacific
- 9.7.1. India
- 9.7.2. China
- 9.7.3. Japan
- 9.7.4. Australia
- 9.7.5. Rest of Asia-Pacific
- 9.8. Market Analysis, Insights and Forecast - by South America
- 9.8.1. Brazil
- 9.8.2. Argentina
- 9.8.3. Rest of South America
- 9.9. Market Analysis, Insights and Forecast - by Middle-East and Africa
- 9.9.1. United Arab Emirates
- 9.9.2. South Africa
- 9.9.3. Rest of Middle-East and Africa
- 9.1. Market Analysis, Insights and Forecast - by Investment Type
- 10. Middle East & Africa ESG Finance Market Analysis, Insights and Forecast, 2020-2032
- 10.1. Market Analysis, Insights and Forecast - by Investment Type
- 10.1.1. Equity, Fixed Income, Mixed Allocation
- 10.1.2. Other Investment Types
- 10.2. Market Analysis, Insights and Forecast - by Transaction Type
- 10.2.1. Green Bond
- 10.2.2. Social Bond
- 10.2.3. Mixed Sustainability Bond
- 10.2.4. ESG Integrated Investment Funds
- 10.2.5. Other Transaction Types
- 10.3. Market Analysis, Insights and Forecast - by Investor Type
- 10.3.1. Institutional Investors
- 10.3.2. Retail Investors
- 10.4. Market Analysis, Insights and Forecast - by Industry Vertical
- 10.4.1. Utilities
- 10.4.2. Transport & Logistics
- 10.4.3. Chemicals
- 10.4.4. Food and Beverage
- 10.4.5. Government
- 10.4.6. Other Industry Verticals
- 10.5. Market Analysis, Insights and Forecast - by North America
- 10.5.1. United States
- 10.5.2. Canada
- 10.5.3. Mexico
- 10.5.4. Rest of North America
- 10.6. Market Analysis, Insights and Forecast - by Europe
- 10.6.1. United Kingdom
- 10.6.2. Germany
- 10.6.3. France
- 10.6.4. Russia
- 10.6.5. Italy
- 10.6.6. Spain
- 10.6.7. Rest of Europe
- 10.7. Market Analysis, Insights and Forecast - by Asia-Pacific
- 10.7.1. India
- 10.7.2. China
- 10.7.3. Japan
- 10.7.4. Australia
- 10.7.5. Rest of Asia-Pacific
- 10.8. Market Analysis, Insights and Forecast - by South America
- 10.8.1. Brazil
- 10.8.2. Argentina
- 10.8.3. Rest of South America
- 10.9. Market Analysis, Insights and Forecast - by Middle-East and Africa
- 10.9.1. United Arab Emirates
- 10.9.2. South Africa
- 10.9.3. Rest of Middle-East and Africa
- 10.1. Market Analysis, Insights and Forecast - by Investment Type
- 11. Asia Pacific ESG Finance Market Analysis, Insights and Forecast, 2020-2032
- 11.1. Market Analysis, Insights and Forecast - by Investment Type
- 11.1.1. Equity, Fixed Income, Mixed Allocation
- 11.1.2. Other Investment Types
- 11.2. Market Analysis, Insights and Forecast - by Transaction Type
- 11.2.1. Green Bond
- 11.2.2. Social Bond
- 11.2.3. Mixed Sustainability Bond
- 11.2.4. ESG Integrated Investment Funds
- 11.2.5. Other Transaction Types
- 11.3. Market Analysis, Insights and Forecast - by Investor Type
- 11.3.1. Institutional Investors
- 11.3.2. Retail Investors
- 11.4. Market Analysis, Insights and Forecast - by Industry Vertical
- 11.4.1. Utilities
- 11.4.2. Transport & Logistics
- 11.4.3. Chemicals
- 11.4.4. Food and Beverage
- 11.4.5. Government
- 11.4.6. Other Industry Verticals
- 11.5. Market Analysis, Insights and Forecast - by North America
- 11.5.1. United States
- 11.5.2. Canada
- 11.5.3. Mexico
- 11.5.4. Rest of North America
- 11.6. Market Analysis, Insights and Forecast - by Europe
- 11.6.1. United Kingdom
- 11.6.2. Germany
- 11.6.3. France
- 11.6.4. Russia
- 11.6.5. Italy
- 11.6.6. Spain
- 11.6.7. Rest of Europe
- 11.7. Market Analysis, Insights and Forecast - by Asia-Pacific
- 11.7.1. India
- 11.7.2. China
- 11.7.3. Japan
- 11.7.4. Australia
- 11.7.5. Rest of Asia-Pacific
- 11.8. Market Analysis, Insights and Forecast - by South America
- 11.8.1. Brazil
- 11.8.2. Argentina
- 11.8.3. Rest of South America
- 11.9. Market Analysis, Insights and Forecast - by Middle-East and Africa
- 11.9.1. United Arab Emirates
- 11.9.2. South Africa
- 11.9.3. Rest of Middle-East and Africa
- 11.1. Market Analysis, Insights and Forecast - by Investment Type
- 12. Competitive Analysis
- 12.1. Company Profiles
- 12.1.1 BlackRock Inc
- 12.1.1.1. Company Overview
- 12.1.1.2. Products
- 12.1.1.3. Company Financials
- 12.1.1.4. SWOT Analysis
- 12.1.2 State Street Corporation
- 12.1.2.1. Company Overview
- 12.1.2.2. Products
- 12.1.2.3. Company Financials
- 12.1.2.4. SWOT Analysis
- 12.1.3 Morgan Stanley
- 12.1.3.1. Company Overview
- 12.1.3.2. Products
- 12.1.3.3. Company Financials
- 12.1.3.4. SWOT Analysis
- 12.1.4 UBS
- 12.1.4.1. Company Overview
- 12.1.4.2. Products
- 12.1.4.3. Company Financials
- 12.1.4.4. SWOT Analysis
- 12.1.5 JPMorgan Chase & Co
- 12.1.5.1. Company Overview
- 12.1.5.2. Products
- 12.1.5.3. Company Financials
- 12.1.5.4. SWOT Analysis
- 12.1.6 Franklin Templeton Investments
- 12.1.6.1. Company Overview
- 12.1.6.2. Products
- 12.1.6.3. Company Financials
- 12.1.6.4. SWOT Analysis
- 12.1.7 Amundi US
- 12.1.7.1. Company Overview
- 12.1.7.2. Products
- 12.1.7.3. Company Financials
- 12.1.7.4. SWOT Analysis
- 12.1.8 The Bank of New York Mellon Corporation
- 12.1.8.1. Company Overview
- 12.1.8.2. Products
- 12.1.8.3. Company Financials
- 12.1.8.4. SWOT Analysis
- 12.1.9 Deutsche Bank AG
- 12.1.9.1. Company Overview
- 12.1.9.2. Products
- 12.1.9.3. Company Financials
- 12.1.9.4. SWOT Analysis
- 12.1.10 Goldman Sachs*
*List Not Exhaustive
- 12.1.10.1. Company Overview
- 12.1.10.2. Products
- 12.1.10.3. Company Financials
- 12.1.10.4. SWOT Analysis
- 12.1.1 BlackRock Inc
- 12.2. Market Entropy
- 12.2.1 Company's Key Areas Served
- 12.2.2 Recent Developments
- 12.3. Company Market Share Analysis 2025
- 12.3.1 Top 5 Companies Market Share Analysis
- 12.3.2 Top 3 Companies Market Share Analysis
- 12.4. List of Potential Customers
- 13. Research Methodology
List of Figures
- Figure 1: Global ESG Finance Market Revenue Breakdown (Million, %) by Region 2025 & 2033
- Figure 2: Global ESG Finance Market Volume Breakdown (Trillion, %) by Region 2025 & 2033
- Figure 3: North America ESG Finance Market Revenue (Million), by Investment Type 2025 & 2033
- Figure 4: North America ESG Finance Market Volume (Trillion), by Investment Type 2025 & 2033
- Figure 5: North America ESG Finance Market Revenue Share (%), by Investment Type 2025 & 2033
- Figure 6: North America ESG Finance Market Volume Share (%), by Investment Type 2025 & 2033
- Figure 7: North America ESG Finance Market Revenue (Million), by Transaction Type 2025 & 2033
- Figure 8: North America ESG Finance Market Volume (Trillion), by Transaction Type 2025 & 2033
- Figure 9: North America ESG Finance Market Revenue Share (%), by Transaction Type 2025 & 2033
- Figure 10: North America ESG Finance Market Volume Share (%), by Transaction Type 2025 & 2033
- Figure 11: North America ESG Finance Market Revenue (Million), by Investor Type 2025 & 2033
- Figure 12: North America ESG Finance Market Volume (Trillion), by Investor Type 2025 & 2033
- Figure 13: North America ESG Finance Market Revenue Share (%), by Investor Type 2025 & 2033
- Figure 14: North America ESG Finance Market Volume Share (%), by Investor Type 2025 & 2033
- Figure 15: North America ESG Finance Market Revenue (Million), by Industry Vertical 2025 & 2033
- Figure 16: North America ESG Finance Market Volume (Trillion), by Industry Vertical 2025 & 2033
- Figure 17: North America ESG Finance Market Revenue Share (%), by Industry Vertical 2025 & 2033
- Figure 18: North America ESG Finance Market Volume Share (%), by Industry Vertical 2025 & 2033
- Figure 19: North America ESG Finance Market Revenue (Million), by North America 2025 & 2033
- Figure 20: North America ESG Finance Market Volume (Trillion), by North America 2025 & 2033
- Figure 21: North America ESG Finance Market Revenue Share (%), by North America 2025 & 2033
- Figure 22: North America ESG Finance Market Volume Share (%), by North America 2025 & 2033
- Figure 23: North America ESG Finance Market Revenue (Million), by Europe 2025 & 2033
- Figure 24: North America ESG Finance Market Volume (Trillion), by Europe 2025 & 2033
- Figure 25: North America ESG Finance Market Revenue Share (%), by Europe 2025 & 2033
- Figure 26: North America ESG Finance Market Volume Share (%), by Europe 2025 & 2033
- Figure 27: North America ESG Finance Market Revenue (Million), by Asia-Pacific 2025 & 2033
- Figure 28: North America ESG Finance Market Volume (Trillion), by Asia-Pacific 2025 & 2033
- Figure 29: North America ESG Finance Market Revenue Share (%), by Asia-Pacific 2025 & 2033
- Figure 30: North America ESG Finance Market Volume Share (%), by Asia-Pacific 2025 & 2033
- Figure 31: North America ESG Finance Market Revenue (Million), by South America 2025 & 2033
- Figure 32: North America ESG Finance Market Volume (Trillion), by South America 2025 & 2033
- Figure 33: North America ESG Finance Market Revenue Share (%), by South America 2025 & 2033
- Figure 34: North America ESG Finance Market Volume Share (%), by South America 2025 & 2033
- Figure 35: North America ESG Finance Market Revenue (Million), by Middle-East and Africa 2025 & 2033
- Figure 36: North America ESG Finance Market Volume (Trillion), by Middle-East and Africa 2025 & 2033
- Figure 37: North America ESG Finance Market Revenue Share (%), by Middle-East and Africa 2025 & 2033
- Figure 38: North America ESG Finance Market Volume Share (%), by Middle-East and Africa 2025 & 2033
- Figure 39: North America ESG Finance Market Revenue (Million), by Country 2025 & 2033
- Figure 40: North America ESG Finance Market Volume (Trillion), by Country 2025 & 2033
- Figure 41: North America ESG Finance Market Revenue Share (%), by Country 2025 & 2033
- Figure 42: North America ESG Finance Market Volume Share (%), by Country 2025 & 2033
- Figure 43: South America ESG Finance Market Revenue (Million), by Investment Type 2025 & 2033
- Figure 44: South America ESG Finance Market Volume (Trillion), by Investment Type 2025 & 2033
- Figure 45: South America ESG Finance Market Revenue Share (%), by Investment Type 2025 & 2033
- Figure 46: South America ESG Finance Market Volume Share (%), by Investment Type 2025 & 2033
- Figure 47: South America ESG Finance Market Revenue (Million), by Transaction Type 2025 & 2033
- Figure 48: South America ESG Finance Market Volume (Trillion), by Transaction Type 2025 & 2033
- Figure 49: South America ESG Finance Market Revenue Share (%), by Transaction Type 2025 & 2033
- Figure 50: South America ESG Finance Market Volume Share (%), by Transaction Type 2025 & 2033
- Figure 51: South America ESG Finance Market Revenue (Million), by Investor Type 2025 & 2033
- Figure 52: South America ESG Finance Market Volume (Trillion), by Investor Type 2025 & 2033
- Figure 53: South America ESG Finance Market Revenue Share (%), by Investor Type 2025 & 2033
- Figure 54: South America ESG Finance Market Volume Share (%), by Investor Type 2025 & 2033
- Figure 55: South America ESG Finance Market Revenue (Million), by Industry Vertical 2025 & 2033
- Figure 56: South America ESG Finance Market Volume (Trillion), by Industry Vertical 2025 & 2033
- Figure 57: South America ESG Finance Market Revenue Share (%), by Industry Vertical 2025 & 2033
- Figure 58: South America ESG Finance Market Volume Share (%), by Industry Vertical 2025 & 2033
- Figure 59: South America ESG Finance Market Revenue (Million), by North America 2025 & 2033
- Figure 60: South America ESG Finance Market Volume (Trillion), by North America 2025 & 2033
- Figure 61: South America ESG Finance Market Revenue Share (%), by North America 2025 & 2033
- Figure 62: South America ESG Finance Market Volume Share (%), by North America 2025 & 2033
- Figure 63: South America ESG Finance Market Revenue (Million), by Europe 2025 & 2033
- Figure 64: South America ESG Finance Market Volume (Trillion), by Europe 2025 & 2033
- Figure 65: South America ESG Finance Market Revenue Share (%), by Europe 2025 & 2033
- Figure 66: South America ESG Finance Market Volume Share (%), by Europe 2025 & 2033
- Figure 67: South America ESG Finance Market Revenue (Million), by Asia-Pacific 2025 & 2033
- Figure 68: South America ESG Finance Market Volume (Trillion), by Asia-Pacific 2025 & 2033
- Figure 69: South America ESG Finance Market Revenue Share (%), by Asia-Pacific 2025 & 2033
- Figure 70: South America ESG Finance Market Volume Share (%), by Asia-Pacific 2025 & 2033
- Figure 71: South America ESG Finance Market Revenue (Million), by South America 2025 & 2033
- Figure 72: South America ESG Finance Market Volume (Trillion), by South America 2025 & 2033
- Figure 73: South America ESG Finance Market Revenue Share (%), by South America 2025 & 2033
- Figure 74: South America ESG Finance Market Volume Share (%), by South America 2025 & 2033
- Figure 75: South America ESG Finance Market Revenue (Million), by Middle-East and Africa 2025 & 2033
- Figure 76: South America ESG Finance Market Volume (Trillion), by Middle-East and Africa 2025 & 2033
- Figure 77: South America ESG Finance Market Revenue Share (%), by Middle-East and Africa 2025 & 2033
- Figure 78: South America ESG Finance Market Volume Share (%), by Middle-East and Africa 2025 & 2033
- Figure 79: South America ESG Finance Market Revenue (Million), by Country 2025 & 2033
- Figure 80: South America ESG Finance Market Volume (Trillion), by Country 2025 & 2033
- Figure 81: South America ESG Finance Market Revenue Share (%), by Country 2025 & 2033
- Figure 82: South America ESG Finance Market Volume Share (%), by Country 2025 & 2033
- Figure 83: Europe ESG Finance Market Revenue (Million), by Investment Type 2025 & 2033
- Figure 84: Europe ESG Finance Market Volume (Trillion), by Investment Type 2025 & 2033
- Figure 85: Europe ESG Finance Market Revenue Share (%), by Investment Type 2025 & 2033
- Figure 86: Europe ESG Finance Market Volume Share (%), by Investment Type 2025 & 2033
- Figure 87: Europe ESG Finance Market Revenue (Million), by Transaction Type 2025 & 2033
- Figure 88: Europe ESG Finance Market Volume (Trillion), by Transaction Type 2025 & 2033
- Figure 89: Europe ESG Finance Market Revenue Share (%), by Transaction Type 2025 & 2033
- Figure 90: Europe ESG Finance Market Volume Share (%), by Transaction Type 2025 & 2033
- Figure 91: Europe ESG Finance Market Revenue (Million), by Investor Type 2025 & 2033
- Figure 92: Europe ESG Finance Market Volume (Trillion), by Investor Type 2025 & 2033
- Figure 93: Europe ESG Finance Market Revenue Share (%), by Investor Type 2025 & 2033
- Figure 94: Europe ESG Finance Market Volume Share (%), by Investor Type 2025 & 2033
- Figure 95: Europe ESG Finance Market Revenue (Million), by Industry Vertical 2025 & 2033
- Figure 96: Europe ESG Finance Market Volume (Trillion), by Industry Vertical 2025 & 2033
- Figure 97: Europe ESG Finance Market Revenue Share (%), by Industry Vertical 2025 & 2033
- Figure 98: Europe ESG Finance Market Volume Share (%), by Industry Vertical 2025 & 2033
- Figure 99: Europe ESG Finance Market Revenue (Million), by North America 2025 & 2033
- Figure 100: Europe ESG Finance Market Volume (Trillion), by North America 2025 & 2033
- Figure 101: Europe ESG Finance Market Revenue Share (%), by North America 2025 & 2033
- Figure 102: Europe ESG Finance Market Volume Share (%), by North America 2025 & 2033
- Figure 103: Europe ESG Finance Market Revenue (Million), by Europe 2025 & 2033
- Figure 104: Europe ESG Finance Market Volume (Trillion), by Europe 2025 & 2033
- Figure 105: Europe ESG Finance Market Revenue Share (%), by Europe 2025 & 2033
- Figure 106: Europe ESG Finance Market Volume Share (%), by Europe 2025 & 2033
- Figure 107: Europe ESG Finance Market Revenue (Million), by Asia-Pacific 2025 & 2033
- Figure 108: Europe ESG Finance Market Volume (Trillion), by Asia-Pacific 2025 & 2033
- Figure 109: Europe ESG Finance Market Revenue Share (%), by Asia-Pacific 2025 & 2033
- Figure 110: Europe ESG Finance Market Volume Share (%), by Asia-Pacific 2025 & 2033
- Figure 111: Europe ESG Finance Market Revenue (Million), by South America 2025 & 2033
- Figure 112: Europe ESG Finance Market Volume (Trillion), by South America 2025 & 2033
- Figure 113: Europe ESG Finance Market Revenue Share (%), by South America 2025 & 2033
- Figure 114: Europe ESG Finance Market Volume Share (%), by South America 2025 & 2033
- Figure 115: Europe ESG Finance Market Revenue (Million), by Middle-East and Africa 2025 & 2033
- Figure 116: Europe ESG Finance Market Volume (Trillion), by Middle-East and Africa 2025 & 2033
- Figure 117: Europe ESG Finance Market Revenue Share (%), by Middle-East and Africa 2025 & 2033
- Figure 118: Europe ESG Finance Market Volume Share (%), by Middle-East and Africa 2025 & 2033
- Figure 119: Europe ESG Finance Market Revenue (Million), by Country 2025 & 2033
- Figure 120: Europe ESG Finance Market Volume (Trillion), by Country 2025 & 2033
- Figure 121: Europe ESG Finance Market Revenue Share (%), by Country 2025 & 2033
- Figure 122: Europe ESG Finance Market Volume Share (%), by Country 2025 & 2033
- Figure 123: Middle East & Africa ESG Finance Market Revenue (Million), by Investment Type 2025 & 2033
- Figure 124: Middle East & Africa ESG Finance Market Volume (Trillion), by Investment Type 2025 & 2033
- Figure 125: Middle East & Africa ESG Finance Market Revenue Share (%), by Investment Type 2025 & 2033
- Figure 126: Middle East & Africa ESG Finance Market Volume Share (%), by Investment Type 2025 & 2033
- Figure 127: Middle East & Africa ESG Finance Market Revenue (Million), by Transaction Type 2025 & 2033
- Figure 128: Middle East & Africa ESG Finance Market Volume (Trillion), by Transaction Type 2025 & 2033
- Figure 129: Middle East & Africa ESG Finance Market Revenue Share (%), by Transaction Type 2025 & 2033
- Figure 130: Middle East & Africa ESG Finance Market Volume Share (%), by Transaction Type 2025 & 2033
- Figure 131: Middle East & Africa ESG Finance Market Revenue (Million), by Investor Type 2025 & 2033
- Figure 132: Middle East & Africa ESG Finance Market Volume (Trillion), by Investor Type 2025 & 2033
- Figure 133: Middle East & Africa ESG Finance Market Revenue Share (%), by Investor Type 2025 & 2033
- Figure 134: Middle East & Africa ESG Finance Market Volume Share (%), by Investor Type 2025 & 2033
- Figure 135: Middle East & Africa ESG Finance Market Revenue (Million), by Industry Vertical 2025 & 2033
- Figure 136: Middle East & Africa ESG Finance Market Volume (Trillion), by Industry Vertical 2025 & 2033
- Figure 137: Middle East & Africa ESG Finance Market Revenue Share (%), by Industry Vertical 2025 & 2033
- Figure 138: Middle East & Africa ESG Finance Market Volume Share (%), by Industry Vertical 2025 & 2033
- Figure 139: Middle East & Africa ESG Finance Market Revenue (Million), by North America 2025 & 2033
- Figure 140: Middle East & Africa ESG Finance Market Volume (Trillion), by North America 2025 & 2033
- Figure 141: Middle East & Africa ESG Finance Market Revenue Share (%), by North America 2025 & 2033
- Figure 142: Middle East & Africa ESG Finance Market Volume Share (%), by North America 2025 & 2033
- Figure 143: Middle East & Africa ESG Finance Market Revenue (Million), by Europe 2025 & 2033
- Figure 144: Middle East & Africa ESG Finance Market Volume (Trillion), by Europe 2025 & 2033
- Figure 145: Middle East & Africa ESG Finance Market Revenue Share (%), by Europe 2025 & 2033
- Figure 146: Middle East & Africa ESG Finance Market Volume Share (%), by Europe 2025 & 2033
- Figure 147: Middle East & Africa ESG Finance Market Revenue (Million), by Asia-Pacific 2025 & 2033
- Figure 148: Middle East & Africa ESG Finance Market Volume (Trillion), by Asia-Pacific 2025 & 2033
- Figure 149: Middle East & Africa ESG Finance Market Revenue Share (%), by Asia-Pacific 2025 & 2033
- Figure 150: Middle East & Africa ESG Finance Market Volume Share (%), by Asia-Pacific 2025 & 2033
- Figure 151: Middle East & Africa ESG Finance Market Revenue (Million), by South America 2025 & 2033
- Figure 152: Middle East & Africa ESG Finance Market Volume (Trillion), by South America 2025 & 2033
- Figure 153: Middle East & Africa ESG Finance Market Revenue Share (%), by South America 2025 & 2033
- Figure 154: Middle East & Africa ESG Finance Market Volume Share (%), by South America 2025 & 2033
- Figure 155: Middle East & Africa ESG Finance Market Revenue (Million), by Middle-East and Africa 2025 & 2033
- Figure 156: Middle East & Africa ESG Finance Market Volume (Trillion), by Middle-East and Africa 2025 & 2033
- Figure 157: Middle East & Africa ESG Finance Market Revenue Share (%), by Middle-East and Africa 2025 & 2033
- Figure 158: Middle East & Africa ESG Finance Market Volume Share (%), by Middle-East and Africa 2025 & 2033
- Figure 159: Middle East & Africa ESG Finance Market Revenue (Million), by Country 2025 & 2033
- Figure 160: Middle East & Africa ESG Finance Market Volume (Trillion), by Country 2025 & 2033
- Figure 161: Middle East & Africa ESG Finance Market Revenue Share (%), by Country 2025 & 2033
- Figure 162: Middle East & Africa ESG Finance Market Volume Share (%), by Country 2025 & 2033
- Figure 163: Asia Pacific ESG Finance Market Revenue (Million), by Investment Type 2025 & 2033
- Figure 164: Asia Pacific ESG Finance Market Volume (Trillion), by Investment Type 2025 & 2033
- Figure 165: Asia Pacific ESG Finance Market Revenue Share (%), by Investment Type 2025 & 2033
- Figure 166: Asia Pacific ESG Finance Market Volume Share (%), by Investment Type 2025 & 2033
- Figure 167: Asia Pacific ESG Finance Market Revenue (Million), by Transaction Type 2025 & 2033
- Figure 168: Asia Pacific ESG Finance Market Volume (Trillion), by Transaction Type 2025 & 2033
- Figure 169: Asia Pacific ESG Finance Market Revenue Share (%), by Transaction Type 2025 & 2033
- Figure 170: Asia Pacific ESG Finance Market Volume Share (%), by Transaction Type 2025 & 2033
- Figure 171: Asia Pacific ESG Finance Market Revenue (Million), by Investor Type 2025 & 2033
- Figure 172: Asia Pacific ESG Finance Market Volume (Trillion), by Investor Type 2025 & 2033
- Figure 173: Asia Pacific ESG Finance Market Revenue Share (%), by Investor Type 2025 & 2033
- Figure 174: Asia Pacific ESG Finance Market Volume Share (%), by Investor Type 2025 & 2033
- Figure 175: Asia Pacific ESG Finance Market Revenue (Million), by Industry Vertical 2025 & 2033
- Figure 176: Asia Pacific ESG Finance Market Volume (Trillion), by Industry Vertical 2025 & 2033
- Figure 177: Asia Pacific ESG Finance Market Revenue Share (%), by Industry Vertical 2025 & 2033
- Figure 178: Asia Pacific ESG Finance Market Volume Share (%), by Industry Vertical 2025 & 2033
- Figure 179: Asia Pacific ESG Finance Market Revenue (Million), by North America 2025 & 2033
- Figure 180: Asia Pacific ESG Finance Market Volume (Trillion), by North America 2025 & 2033
- Figure 181: Asia Pacific ESG Finance Market Revenue Share (%), by North America 2025 & 2033
- Figure 182: Asia Pacific ESG Finance Market Volume Share (%), by North America 2025 & 2033
- Figure 183: Asia Pacific ESG Finance Market Revenue (Million), by Europe 2025 & 2033
- Figure 184: Asia Pacific ESG Finance Market Volume (Trillion), by Europe 2025 & 2033
- Figure 185: Asia Pacific ESG Finance Market Revenue Share (%), by Europe 2025 & 2033
- Figure 186: Asia Pacific ESG Finance Market Volume Share (%), by Europe 2025 & 2033
- Figure 187: Asia Pacific ESG Finance Market Revenue (Million), by Asia-Pacific 2025 & 2033
- Figure 188: Asia Pacific ESG Finance Market Volume (Trillion), by Asia-Pacific 2025 & 2033
- Figure 189: Asia Pacific ESG Finance Market Revenue Share (%), by Asia-Pacific 2025 & 2033
- Figure 190: Asia Pacific ESG Finance Market Volume Share (%), by Asia-Pacific 2025 & 2033
- Figure 191: Asia Pacific ESG Finance Market Revenue (Million), by South America 2025 & 2033
- Figure 192: Asia Pacific ESG Finance Market Volume (Trillion), by South America 2025 & 2033
- Figure 193: Asia Pacific ESG Finance Market Revenue Share (%), by South America 2025 & 2033
- Figure 194: Asia Pacific ESG Finance Market Volume Share (%), by South America 2025 & 2033
- Figure 195: Asia Pacific ESG Finance Market Revenue (Million), by Middle-East and Africa 2025 & 2033
- Figure 196: Asia Pacific ESG Finance Market Volume (Trillion), by Middle-East and Africa 2025 & 2033
- Figure 197: Asia Pacific ESG Finance Market Revenue Share (%), by Middle-East and Africa 2025 & 2033
- Figure 198: Asia Pacific ESG Finance Market Volume Share (%), by Middle-East and Africa 2025 & 2033
- Figure 199: Asia Pacific ESG Finance Market Revenue (Million), by Country 2025 & 2033
- Figure 200: Asia Pacific ESG Finance Market Volume (Trillion), by Country 2025 & 2033
- Figure 201: Asia Pacific ESG Finance Market Revenue Share (%), by Country 2025 & 2033
- Figure 202: Asia Pacific ESG Finance Market Volume Share (%), by Country 2025 & 2033
List of Tables
- Table 1: Global ESG Finance Market Revenue Million Forecast, by Investment Type 2020 & 2033
- Table 2: Global ESG Finance Market Volume Trillion Forecast, by Investment Type 2020 & 2033
- Table 3: Global ESG Finance Market Revenue Million Forecast, by Transaction Type 2020 & 2033
- Table 4: Global ESG Finance Market Volume Trillion Forecast, by Transaction Type 2020 & 2033
- Table 5: Global ESG Finance Market Revenue Million Forecast, by Investor Type 2020 & 2033
- Table 6: Global ESG Finance Market Volume Trillion Forecast, by Investor Type 2020 & 2033
- Table 7: Global ESG Finance Market Revenue Million Forecast, by Industry Vertical 2020 & 2033
- Table 8: Global ESG Finance Market Volume Trillion Forecast, by Industry Vertical 2020 & 2033
- Table 9: Global ESG Finance Market Revenue Million Forecast, by North America 2020 & 2033
- Table 10: Global ESG Finance Market Volume Trillion Forecast, by North America 2020 & 2033
- Table 11: Global ESG Finance Market Revenue Million Forecast, by Europe 2020 & 2033
- Table 12: Global ESG Finance Market Volume Trillion Forecast, by Europe 2020 & 2033
- Table 13: Global ESG Finance Market Revenue Million Forecast, by Asia-Pacific 2020 & 2033
- Table 14: Global ESG Finance Market Volume Trillion Forecast, by Asia-Pacific 2020 & 2033
- Table 15: Global ESG Finance Market Revenue Million Forecast, by South America 2020 & 2033
- Table 16: Global ESG Finance Market Volume Trillion Forecast, by South America 2020 & 2033
- Table 17: Global ESG Finance Market Revenue Million Forecast, by Middle-East and Africa 2020 & 2033
- Table 18: Global ESG Finance Market Volume Trillion Forecast, by Middle-East and Africa 2020 & 2033
- Table 19: Global ESG Finance Market Revenue Million Forecast, by Region 2020 & 2033
- Table 20: Global ESG Finance Market Volume Trillion Forecast, by Region 2020 & 2033
- Table 21: Global ESG Finance Market Revenue Million Forecast, by Investment Type 2020 & 2033
- Table 22: Global ESG Finance Market Volume Trillion Forecast, by Investment Type 2020 & 2033
- Table 23: Global ESG Finance Market Revenue Million Forecast, by Transaction Type 2020 & 2033
- Table 24: Global ESG Finance Market Volume Trillion Forecast, by Transaction Type 2020 & 2033
- Table 25: Global ESG Finance Market Revenue Million Forecast, by Investor Type 2020 & 2033
- Table 26: Global ESG Finance Market Volume Trillion Forecast, by Investor Type 2020 & 2033
- Table 27: Global ESG Finance Market Revenue Million Forecast, by Industry Vertical 2020 & 2033
- Table 28: Global ESG Finance Market Volume Trillion Forecast, by Industry Vertical 2020 & 2033
- Table 29: Global ESG Finance Market Revenue Million Forecast, by North America 2020 & 2033
- Table 30: Global ESG Finance Market Volume Trillion Forecast, by North America 2020 & 2033
- Table 31: Global ESG Finance Market Revenue Million Forecast, by Europe 2020 & 2033
- Table 32: Global ESG Finance Market Volume Trillion Forecast, by Europe 2020 & 2033
- Table 33: Global ESG Finance Market Revenue Million Forecast, by Asia-Pacific 2020 & 2033
- Table 34: Global ESG Finance Market Volume Trillion Forecast, by Asia-Pacific 2020 & 2033
- Table 35: Global ESG Finance Market Revenue Million Forecast, by South America 2020 & 2033
- Table 36: Global ESG Finance Market Volume Trillion Forecast, by South America 2020 & 2033
- Table 37: Global ESG Finance Market Revenue Million Forecast, by Middle-East and Africa 2020 & 2033
- Table 38: Global ESG Finance Market Volume Trillion Forecast, by Middle-East and Africa 2020 & 2033
- Table 39: Global ESG Finance Market Revenue Million Forecast, by Country 2020 & 2033
- Table 40: Global ESG Finance Market Volume Trillion Forecast, by Country 2020 & 2033
- Table 41: United States ESG Finance Market Revenue (Million) Forecast, by Application 2020 & 2033
- Table 42: United States ESG Finance Market Volume (Trillion) Forecast, by Application 2020 & 2033
- Table 43: Canada ESG Finance Market Revenue (Million) Forecast, by Application 2020 & 2033
- Table 44: Canada ESG Finance Market Volume (Trillion) Forecast, by Application 2020 & 2033
- Table 45: Mexico ESG Finance Market Revenue (Million) Forecast, by Application 2020 & 2033
- Table 46: Mexico ESG Finance Market Volume (Trillion) Forecast, by Application 2020 & 2033
- Table 47: Global ESG Finance Market Revenue Million Forecast, by Investment Type 2020 & 2033
- Table 48: Global ESG Finance Market Volume Trillion Forecast, by Investment Type 2020 & 2033
- Table 49: Global ESG Finance Market Revenue Million Forecast, by Transaction Type 2020 & 2033
- Table 50: Global ESG Finance Market Volume Trillion Forecast, by Transaction Type 2020 & 2033
- Table 51: Global ESG Finance Market Revenue Million Forecast, by Investor Type 2020 & 2033
- Table 52: Global ESG Finance Market Volume Trillion Forecast, by Investor Type 2020 & 2033
- Table 53: Global ESG Finance Market Revenue Million Forecast, by Industry Vertical 2020 & 2033
- Table 54: Global ESG Finance Market Volume Trillion Forecast, by Industry Vertical 2020 & 2033
- Table 55: Global ESG Finance Market Revenue Million Forecast, by North America 2020 & 2033
- Table 56: Global ESG Finance Market Volume Trillion Forecast, by North America 2020 & 2033
- Table 57: Global ESG Finance Market Revenue Million Forecast, by Europe 2020 & 2033
- Table 58: Global ESG Finance Market Volume Trillion Forecast, by Europe 2020 & 2033
- Table 59: Global ESG Finance Market Revenue Million Forecast, by Asia-Pacific 2020 & 2033
- Table 60: Global ESG Finance Market Volume Trillion Forecast, by Asia-Pacific 2020 & 2033
- Table 61: Global ESG Finance Market Revenue Million Forecast, by South America 2020 & 2033
- Table 62: Global ESG Finance Market Volume Trillion Forecast, by South America 2020 & 2033
- Table 63: Global ESG Finance Market Revenue Million Forecast, by Middle-East and Africa 2020 & 2033
- Table 64: Global ESG Finance Market Volume Trillion Forecast, by Middle-East and Africa 2020 & 2033
- Table 65: Global ESG Finance Market Revenue Million Forecast, by Country 2020 & 2033
- Table 66: Global ESG Finance Market Volume Trillion Forecast, by Country 2020 & 2033
- Table 67: Brazil ESG Finance Market Revenue (Million) Forecast, by Application 2020 & 2033
- Table 68: Brazil ESG Finance Market Volume (Trillion) Forecast, by Application 2020 & 2033
- Table 69: Argentina ESG Finance Market Revenue (Million) Forecast, by Application 2020 & 2033
- Table 70: Argentina ESG Finance Market Volume (Trillion) Forecast, by Application 2020 & 2033
- Table 71: Rest of South America ESG Finance Market Revenue (Million) Forecast, by Application 2020 & 2033
- Table 72: Rest of South America ESG Finance Market Volume (Trillion) Forecast, by Application 2020 & 2033
- Table 73: Global ESG Finance Market Revenue Million Forecast, by Investment Type 2020 & 2033
- Table 74: Global ESG Finance Market Volume Trillion Forecast, by Investment Type 2020 & 2033
- Table 75: Global ESG Finance Market Revenue Million Forecast, by Transaction Type 2020 & 2033
- Table 76: Global ESG Finance Market Volume Trillion Forecast, by Transaction Type 2020 & 2033
- Table 77: Global ESG Finance Market Revenue Million Forecast, by Investor Type 2020 & 2033
- Table 78: Global ESG Finance Market Volume Trillion Forecast, by Investor Type 2020 & 2033
- Table 79: Global ESG Finance Market Revenue Million Forecast, by Industry Vertical 2020 & 2033
- Table 80: Global ESG Finance Market Volume Trillion Forecast, by Industry Vertical 2020 & 2033
- Table 81: Global ESG Finance Market Revenue Million Forecast, by North America 2020 & 2033
- Table 82: Global ESG Finance Market Volume Trillion Forecast, by North America 2020 & 2033
- Table 83: Global ESG Finance Market Revenue Million Forecast, by Europe 2020 & 2033
- Table 84: Global ESG Finance Market Volume Trillion Forecast, by Europe 2020 & 2033
- Table 85: Global ESG Finance Market Revenue Million Forecast, by Asia-Pacific 2020 & 2033
- Table 86: Global ESG Finance Market Volume Trillion Forecast, by Asia-Pacific 2020 & 2033
- Table 87: Global ESG Finance Market Revenue Million Forecast, by South America 2020 & 2033
- Table 88: Global ESG Finance Market Volume Trillion Forecast, by South America 2020 & 2033
- Table 89: Global ESG Finance Market Revenue Million Forecast, by Middle-East and Africa 2020 & 2033
- Table 90: Global ESG Finance Market Volume Trillion Forecast, by Middle-East and Africa 2020 & 2033
- Table 91: Global ESG Finance Market Revenue Million Forecast, by Country 2020 & 2033
- Table 92: Global ESG Finance Market Volume Trillion Forecast, by Country 2020 & 2033
- Table 93: United Kingdom ESG Finance Market Revenue (Million) Forecast, by Application 2020 & 2033
- Table 94: United Kingdom ESG Finance Market Volume (Trillion) Forecast, by Application 2020 & 2033
- Table 95: Germany ESG Finance Market Revenue (Million) Forecast, by Application 2020 & 2033
- Table 96: Germany ESG Finance Market Volume (Trillion) Forecast, by Application 2020 & 2033
- Table 97: France ESG Finance Market Revenue (Million) Forecast, by Application 2020 & 2033
- Table 98: France ESG Finance Market Volume (Trillion) Forecast, by Application 2020 & 2033
- Table 99: Italy ESG Finance Market Revenue (Million) Forecast, by Application 2020 & 2033
- Table 100: Italy ESG Finance Market Volume (Trillion) Forecast, by Application 2020 & 2033
- Table 101: Spain ESG Finance Market Revenue (Million) Forecast, by Application 2020 & 2033
- Table 102: Spain ESG Finance Market Volume (Trillion) Forecast, by Application 2020 & 2033
- Table 103: Russia ESG Finance Market Revenue (Million) Forecast, by Application 2020 & 2033
- Table 104: Russia ESG Finance Market Volume (Trillion) Forecast, by Application 2020 & 2033
- Table 105: Benelux ESG Finance Market Revenue (Million) Forecast, by Application 2020 & 2033
- Table 106: Benelux ESG Finance Market Volume (Trillion) Forecast, by Application 2020 & 2033
- Table 107: Nordics ESG Finance Market Revenue (Million) Forecast, by Application 2020 & 2033
- Table 108: Nordics ESG Finance Market Volume (Trillion) Forecast, by Application 2020 & 2033
- Table 109: Rest of Europe ESG Finance Market Revenue (Million) Forecast, by Application 2020 & 2033
- Table 110: Rest of Europe ESG Finance Market Volume (Trillion) Forecast, by Application 2020 & 2033
- Table 111: Global ESG Finance Market Revenue Million Forecast, by Investment Type 2020 & 2033
- Table 112: Global ESG Finance Market Volume Trillion Forecast, by Investment Type 2020 & 2033
- Table 113: Global ESG Finance Market Revenue Million Forecast, by Transaction Type 2020 & 2033
- Table 114: Global ESG Finance Market Volume Trillion Forecast, by Transaction Type 2020 & 2033
- Table 115: Global ESG Finance Market Revenue Million Forecast, by Investor Type 2020 & 2033
- Table 116: Global ESG Finance Market Volume Trillion Forecast, by Investor Type 2020 & 2033
- Table 117: Global ESG Finance Market Revenue Million Forecast, by Industry Vertical 2020 & 2033
- Table 118: Global ESG Finance Market Volume Trillion Forecast, by Industry Vertical 2020 & 2033
- Table 119: Global ESG Finance Market Revenue Million Forecast, by North America 2020 & 2033
- Table 120: Global ESG Finance Market Volume Trillion Forecast, by North America 2020 & 2033
- Table 121: Global ESG Finance Market Revenue Million Forecast, by Europe 2020 & 2033
- Table 122: Global ESG Finance Market Volume Trillion Forecast, by Europe 2020 & 2033
- Table 123: Global ESG Finance Market Revenue Million Forecast, by Asia-Pacific 2020 & 2033
- Table 124: Global ESG Finance Market Volume Trillion Forecast, by Asia-Pacific 2020 & 2033
- Table 125: Global ESG Finance Market Revenue Million Forecast, by South America 2020 & 2033
- Table 126: Global ESG Finance Market Volume Trillion Forecast, by South America 2020 & 2033
- Table 127: Global ESG Finance Market Revenue Million Forecast, by Middle-East and Africa 2020 & 2033
- Table 128: Global ESG Finance Market Volume Trillion Forecast, by Middle-East and Africa 2020 & 2033
- Table 129: Global ESG Finance Market Revenue Million Forecast, by Country 2020 & 2033
- Table 130: Global ESG Finance Market Volume Trillion Forecast, by Country 2020 & 2033
- Table 131: Turkey ESG Finance Market Revenue (Million) Forecast, by Application 2020 & 2033
- Table 132: Turkey ESG Finance Market Volume (Trillion) Forecast, by Application 2020 & 2033
- Table 133: Israel ESG Finance Market Revenue (Million) Forecast, by Application 2020 & 2033
- Table 134: Israel ESG Finance Market Volume (Trillion) Forecast, by Application 2020 & 2033
- Table 135: GCC ESG Finance Market Revenue (Million) Forecast, by Application 2020 & 2033
- Table 136: GCC ESG Finance Market Volume (Trillion) Forecast, by Application 2020 & 2033
- Table 137: North Africa ESG Finance Market Revenue (Million) Forecast, by Application 2020 & 2033
- Table 138: North Africa ESG Finance Market Volume (Trillion) Forecast, by Application 2020 & 2033
- Table 139: South Africa ESG Finance Market Revenue (Million) Forecast, by Application 2020 & 2033
- Table 140: South Africa ESG Finance Market Volume (Trillion) Forecast, by Application 2020 & 2033
- Table 141: Rest of Middle East & Africa ESG Finance Market Revenue (Million) Forecast, by Application 2020 & 2033
- Table 142: Rest of Middle East & Africa ESG Finance Market Volume (Trillion) Forecast, by Application 2020 & 2033
- Table 143: Global ESG Finance Market Revenue Million Forecast, by Investment Type 2020 & 2033
- Table 144: Global ESG Finance Market Volume Trillion Forecast, by Investment Type 2020 & 2033
- Table 145: Global ESG Finance Market Revenue Million Forecast, by Transaction Type 2020 & 2033
- Table 146: Global ESG Finance Market Volume Trillion Forecast, by Transaction Type 2020 & 2033
- Table 147: Global ESG Finance Market Revenue Million Forecast, by Investor Type 2020 & 2033
- Table 148: Global ESG Finance Market Volume Trillion Forecast, by Investor Type 2020 & 2033
- Table 149: Global ESG Finance Market Revenue Million Forecast, by Industry Vertical 2020 & 2033
- Table 150: Global ESG Finance Market Volume Trillion Forecast, by Industry Vertical 2020 & 2033
- Table 151: Global ESG Finance Market Revenue Million Forecast, by North America 2020 & 2033
- Table 152: Global ESG Finance Market Volume Trillion Forecast, by North America 2020 & 2033
- Table 153: Global ESG Finance Market Revenue Million Forecast, by Europe 2020 & 2033
- Table 154: Global ESG Finance Market Volume Trillion Forecast, by Europe 2020 & 2033
- Table 155: Global ESG Finance Market Revenue Million Forecast, by Asia-Pacific 2020 & 2033
- Table 156: Global ESG Finance Market Volume Trillion Forecast, by Asia-Pacific 2020 & 2033
- Table 157: Global ESG Finance Market Revenue Million Forecast, by South America 2020 & 2033
- Table 158: Global ESG Finance Market Volume Trillion Forecast, by South America 2020 & 2033
- Table 159: Global ESG Finance Market Revenue Million Forecast, by Middle-East and Africa 2020 & 2033
- Table 160: Global ESG Finance Market Volume Trillion Forecast, by Middle-East and Africa 2020 & 2033
- Table 161: Global ESG Finance Market Revenue Million Forecast, by Country 2020 & 2033
- Table 162: Global ESG Finance Market Volume Trillion Forecast, by Country 2020 & 2033
- Table 163: China ESG Finance Market Revenue (Million) Forecast, by Application 2020 & 2033
- Table 164: China ESG Finance Market Volume (Trillion) Forecast, by Application 2020 & 2033
- Table 165: India ESG Finance Market Revenue (Million) Forecast, by Application 2020 & 2033
- Table 166: India ESG Finance Market Volume (Trillion) Forecast, by Application 2020 & 2033
- Table 167: Japan ESG Finance Market Revenue (Million) Forecast, by Application 2020 & 2033
- Table 168: Japan ESG Finance Market Volume (Trillion) Forecast, by Application 2020 & 2033
- Table 169: South Korea ESG Finance Market Revenue (Million) Forecast, by Application 2020 & 2033
- Table 170: South Korea ESG Finance Market Volume (Trillion) Forecast, by Application 2020 & 2033
- Table 171: ASEAN ESG Finance Market Revenue (Million) Forecast, by Application 2020 & 2033
- Table 172: ASEAN ESG Finance Market Volume (Trillion) Forecast, by Application 2020 & 2033
- Table 173: Oceania ESG Finance Market Revenue (Million) Forecast, by Application 2020 & 2033
- Table 174: Oceania ESG Finance Market Volume (Trillion) Forecast, by Application 2020 & 2033
- Table 175: Rest of Asia Pacific ESG Finance Market Revenue (Million) Forecast, by Application 2020 & 2033
- Table 176: Rest of Asia Pacific ESG Finance Market Volume (Trillion) Forecast, by Application 2020 & 2033
Frequently Asked Questions
1. What is the projected Compound Annual Growth Rate (CAGR) of the ESG Finance Market?
The projected CAGR is approximately 10.04%.
2. Which companies are prominent players in the ESG Finance Market?
Key companies in the market include BlackRock Inc, State Street Corporation, Morgan Stanley, UBS, JPMorgan Chase & Co, Franklin Templeton Investments, Amundi US, The Bank of New York Mellon Corporation, Deutsche Bank AG, Goldman Sachs* *List Not Exhaustive.
3. What are the main segments of the ESG Finance Market?
The market segments include Investment Type, Transaction Type, Investor Type, Industry Vertical, North America, Europe, Asia-Pacific, South America, Middle-East and Africa.
4. Can you provide details about the market size?
The market size is estimated to be USD 7.02 Million as of 2022.
5. What are some drivers contributing to market growth?
Rise in Investment in Businesses with Sustainable Practices is a Driving Force Behind the Growth of The Sustainable Finance Market; Increasing Government Initiative Towards Sustainability.
6. What are the notable trends driving market growth?
Rising Investments in Green Bonds.
7. Are there any restraints impacting market growth?
Rise in Investment in Businesses with Sustainable Practices is a Driving Force Behind the Growth of The Sustainable Finance Market; Increasing Government Initiative Towards Sustainability.
8. Can you provide examples of recent developments in the market?
In February 2024, State Street Corporation acquired CF Global Trading. CF Global Trading is a global provider of agency-based trading services for a wide range of asset classes, including stocks, listed derivatives, and fixed-income instruments. Terms of the transaction were not disclosed.
9. What pricing options are available for accessing the report?
Pricing options include single-user, multi-user, and enterprise licenses priced at USD 3800, USD 4500, and USD 5800 respectively.
10. Is the market size provided in terms of value or volume?
The market size is provided in terms of value, measured in Million and volume, measured in Trillion.
11. Are there any specific market keywords associated with the report?
Yes, the market keyword associated with the report is "ESG Finance Market," which aids in identifying and referencing the specific market segment covered.
12. How do I determine which pricing option suits my needs best?
The pricing options vary based on user requirements and access needs. Individual users may opt for single-user licenses, while businesses requiring broader access may choose multi-user or enterprise licenses for cost-effective access to the report.
13. Are there any additional resources or data provided in the ESG Finance Market report?
While the report offers comprehensive insights, it's advisable to review the specific contents or supplementary materials provided to ascertain if additional resources or data are available.
14. How can I stay updated on further developments or reports in the ESG Finance Market?
To stay informed about further developments, trends, and reports in the ESG Finance Market, consider subscribing to industry newsletters, following relevant companies and organizations, or regularly checking reputable industry news sources and publications.
Methodology
Step 1 - Identification of Relevant Samples Size from Population Database


Step 2 - Approaches for Defining Global Market Size (Value, Volume* & Price*)

Note*: In applicable scenarios
Step 3 - Data Sources
Primary Research
- Web Analytics
- Survey Reports
- Research Institute
- Latest Research Reports
- Opinion Leaders
Secondary Research
- Annual Reports
- White Paper
- Latest Press Release
- Industry Association
- Paid Database
- Investor Presentations

Step 4 - Data Triangulation
Involves using different sources of information in order to increase the validity of a study
These sources are likely to be stakeholders in a program - participants, other researchers, program staff, other community members, and so on.
Then we put all data in single framework & apply various statistical tools to find out the dynamic on the market.
During the analysis stage, feedback from the stakeholder groups would be compared to determine areas of agreement as well as areas of divergence