

Key Insights
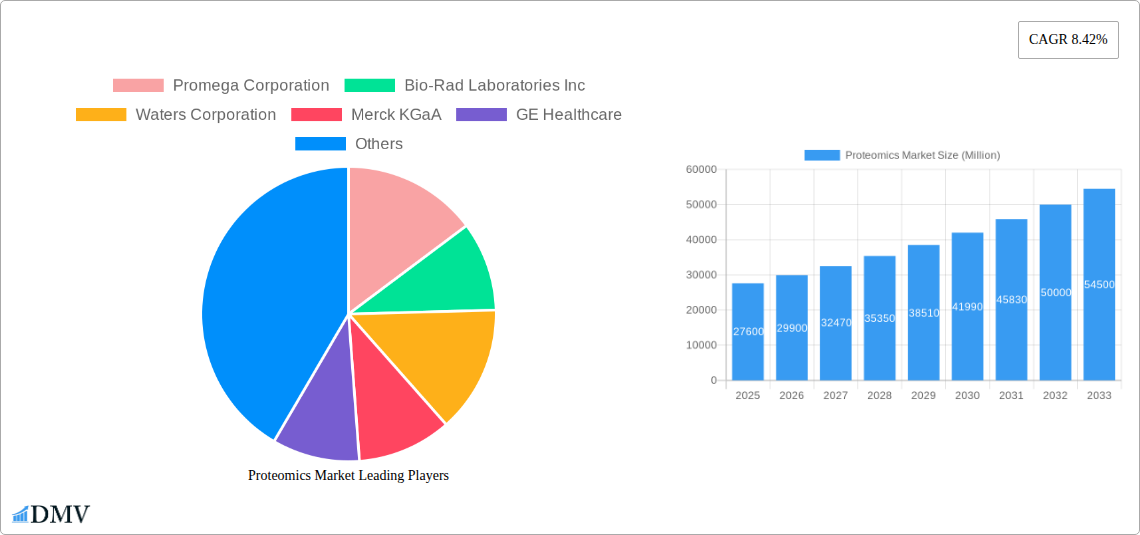
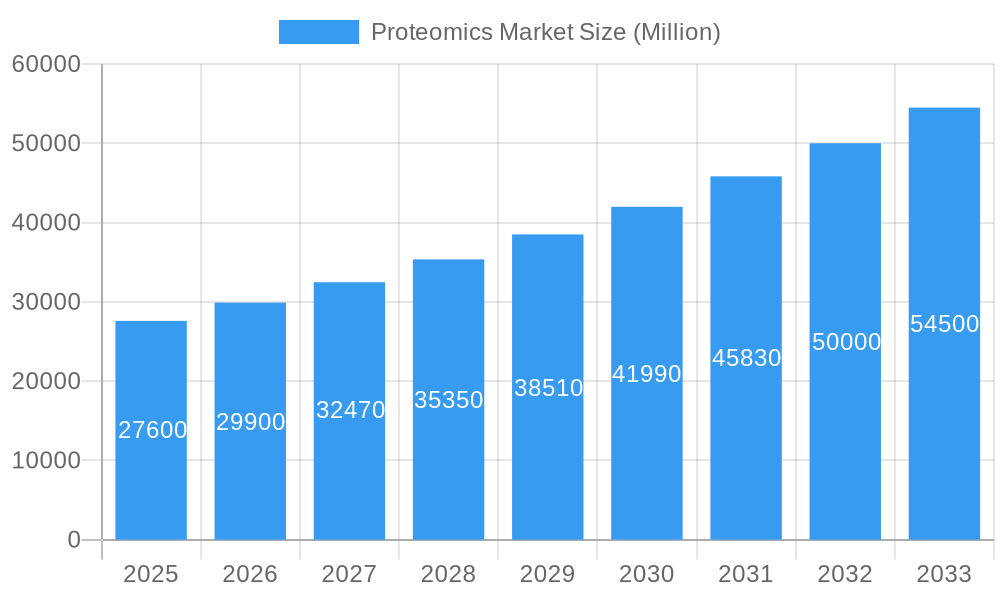
The global proteomics market, valued at $27.60 billion in 2025, is projected to experience robust growth, driven by a compound annual growth rate (CAGR) of 8.42% from 2025 to 2033. This expansion is fueled by several key factors. Advancements in mass spectrometry technologies are enabling higher throughput and more sensitive proteomic analyses, leading to faster and more cost-effective identification and quantification of proteins. The increasing prevalence of chronic diseases, such as cancer and diabetes, is driving demand for improved diagnostic tools and personalized medicine approaches, where proteomics plays a crucial role. Furthermore, the burgeoning field of drug discovery and development heavily relies on proteomics to identify novel drug targets and biomarkers, accelerating the development of new therapies. The rising adoption of proteomics in academic research and clinical settings further contributes to market growth. Significant investments in research and development by both private and public sectors are also supporting this expansion.
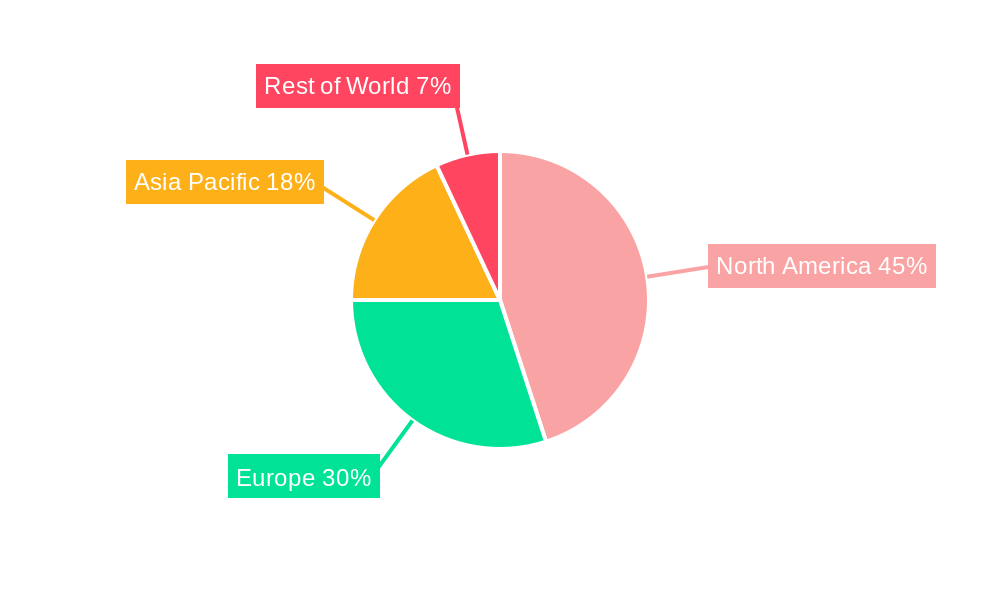
Proteomics Market Market Size (In Billion)
Market segmentation reveals strong growth across various applications. Clinical diagnostics represent a significant segment, leveraging proteomics for early disease detection and improved patient stratification. Drug discovery and development constitute another substantial area, utilizing proteomics to identify and validate potential drug targets and assess the efficacy and safety of new therapeutics. Instrumentation technology, including mass spectrometers and chromatography systems, forms a major component of the market, alongside essential reagents and sophisticated software and services that support data analysis and interpretation. Geographic distribution shows a concentration of market share in North America and Europe, driven by advanced research infrastructure and high healthcare expenditure. However, rapidly developing economies in Asia Pacific are witnessing significant growth, presenting lucrative opportunities for proteomics companies in the coming years. Competition in the market is intense, with major players such as Thermo Fisher Scientific, Danaher Corporation, and Agilent Technologies holding significant market share. However, the market is also characterized by the emergence of innovative smaller companies focused on niche applications and technologies.
Proteomics Market Company Market Share
Unlock the Untapped Potential: A Comprehensive Proteomics Market Report (2019-2033)
This insightful report provides a detailed analysis of the global Proteomics Market, offering a comprehensive overview of its current state, future trajectory, and key players. With a meticulous study period spanning 2019-2033, a base year of 2025, and an estimated year of 2025, this report serves as an indispensable resource for stakeholders seeking to navigate the complexities of this rapidly evolving market. The market is projected to reach xx Million by 2033, exhibiting a Compound Annual Growth Rate (CAGR) of xx% during the forecast period (2025-2033).
Proteomics Market Composition & Trends
This section delves into the intricate landscape of the Proteomics Market, examining its competitive dynamics, innovation drivers, and regulatory influences. We analyze market concentration, revealing the market share distribution among key players like Thermo Fisher Scientific Inc, Promega Corporation, Bio-Rad Laboratories Inc, Waters Corporation, Merck KGaA, GE Healthcare, Danaher Corporation, Agilent Technologies Inc, and Bruker Corporation. The report also explores the impact of M&A activities, quantifying deal values and their influence on market consolidation.
- Market Concentration: The Proteomics market exhibits a moderately concentrated structure, with the top 5 players holding approximately xx% of the market share in 2024.
- Innovation Catalysts: Advancements in mass spectrometry, liquid chromatography, and bioinformatics are driving significant innovation within the market.
- Regulatory Landscape: Stringent regulatory approvals for diagnostic applications and increasing focus on data privacy are shaping market dynamics.
- Substitute Products: The emergence of alternative technologies presents challenges but also opportunities for market expansion.
- End-User Profiles: Pharmaceutical and biotechnology companies, academic research institutions, and clinical diagnostic laboratories constitute the primary end-user base.
- M&A Activity: The historical period (2019-2024) witnessed xx M&A deals, with a total value exceeding xx Million, primarily driven by strategic expansion and technological integration.
Proteomics Market Industry Evolution
This section meticulously tracks the Proteomics Market's evolution, tracing its growth trajectory from 2019 to the projected 2033. It examines technological advancements, such as the integration of artificial intelligence and machine learning, and how these innovations have reshaped market dynamics. The analysis considers shifting consumer demands, including increasing focus on personalized medicine and point-of-care diagnostics. Detailed data points, including precise growth rates and adoption metrics for key technologies, are provided. The rising adoption of proteomics in clinical diagnostics is projected to be a major driver, while technological advancements in mass spectrometry and bioinformatics promise to further accelerate growth. The global market experienced a CAGR of xx% during the historical period (2019-2024), and is expected to maintain strong growth throughout the forecast period driven by factors such as the increasing prevalence of chronic diseases, rising demand for personalized medicine and advancements in proteomics technologies.
Leading Regions, Countries, or Segments in Proteomics Market
This section identifies the leading regions, countries, and market segments within the Proteomics Market, focusing on Product & Services (Instrumentation Technology, Reagents, Software & Services) and Applications (Clinical Diagnostics, Drug Discovery, Other Applications). North America currently dominates the market, driven by robust R&D investments and a well-established healthcare infrastructure.
Key Drivers:
- North America: High R&D spending, strong regulatory support, and a large number of established players.
- Europe: Growing investments in healthcare infrastructure and increasing adoption of proteomics-based diagnostics.
- Asia-Pacific: Rapid market growth fueled by rising healthcare expenditure, increasing prevalence of chronic diseases, and government initiatives supporting life sciences research.
Dominance Factors:
The dominance of North America stems from several factors, including a large number of established biopharmaceutical companies that are actively involved in drug discovery and development, a highly developed healthcare infrastructure, and significant government funding for research and development in the life sciences. Europe also holds a substantial share, due to its strong life science research ecosystem, and increasing focus on personalized medicine. Asia-Pacific is witnessing rapid growth fueled by rising disposable income and increased government initiatives for promoting research in this area. The Clinical Diagnostics application segment currently holds the largest market share due to its growing use in early disease diagnosis, prognosis and personalized medicine.
Proteomics Market Product Innovations
Recent years have witnessed remarkable innovations in proteomics technologies, particularly in mass spectrometry and sample preparation techniques. These advancements have enhanced sensitivity, throughput, and the ability to analyze complex protein samples. New software and data analysis tools are streamlining data interpretation and accelerating the translation of proteomics data into actionable insights. The development of miniaturized and portable devices promises to expand the accessibility of proteomics technologies to diverse settings, including point-of-care diagnostics.
Propelling Factors for Proteomics Market Growth
Several factors contribute to the significant growth projected for the Proteomics Market. Technological advancements in mass spectrometry and bioinformatics are improving the speed, accuracy, and cost-effectiveness of proteomic analysis. The increasing prevalence of chronic diseases globally drives demand for effective diagnostic and therapeutic tools. Government funding and regulatory support for proteomics research and development further stimulate market growth. The rising adoption of personalized medicine also contributes to significant market growth.
Obstacles in the Proteomics Market
Despite its immense potential, the Proteomics Market faces several challenges. High initial investment costs for instrumentation and software can be a barrier to entry for smaller companies. The complexity of proteomic data analysis requires specialized expertise, limiting accessibility. Stringent regulatory requirements for diagnostic applications and ensuring data privacy pose further obstacles. Supply chain disruptions related to specialized reagents and components can also impact market growth.
Future Opportunities in Proteomics Market
The future of the Proteomics Market holds immense opportunities. Expanding applications in oncology, neurology, and infectious diseases offer significant growth potential. The development of novel proteomic biomarkers for early disease detection and personalized medicine will drive market expansion. The integration of artificial intelligence and machine learning for enhanced data analysis will further propel growth. Furthermore, the development of point-of-care diagnostic tools will make proteomic testing more accessible and affordable.
Major Players in the Proteomics Market Ecosystem
- Promega Corporation
- Bio-Rad Laboratories Inc
- Waters Corporation
- Merck KGaA
- GE Healthcare
- Thermo Fisher Scientific Inc
- Danaher Corporation
- Agilent Technologies Inc
- Bruker Corporation
Key Developments in Proteomics Market Industry
- 2024 Q4: Thermo Fisher Scientific Inc. launched a new mass spectrometer with enhanced sensitivity and throughput.
- 2023 Q3: Bio-Rad Laboratories Inc. acquired a small biotech company specializing in proteomics software.
- 2022 Q2: Waters Corporation announced a strategic partnership to develop novel proteomics reagents.
- (Further entries would detail other significant events)
Strategic Proteomics Market Market Forecast
The Proteomics Market is poised for robust growth, driven by technological innovations, increasing healthcare spending, and a growing awareness of the importance of proteomics in disease diagnosis and treatment. The continued development of advanced instrumentation, user-friendly software, and comprehensive databases will facilitate wider adoption. The integration of proteomics with other omics technologies holds immense promise for advancing personalized medicine and improving healthcare outcomes. The market's expansion into emerging economies will further contribute to significant growth.
Proteomics Market Segmentation
-
1. Product & Services
-
1.1. Instrumentation Technology
- 1.1.1. Spectroscopy
- 1.1.2. Chromatography
- 1.1.3. Electrophoresis
- 1.1.4. Protein Microarrays
- 1.1.5. X-Ray Crystallography
- 1.1.6. Other Instrumentation Technologies
- 1.2. Reagents
- 1.3. Software and Services
-
1.1. Instrumentation Technology
-
2. Application
- 2.1. Clinical Diagnostics
- 2.2. Drug Discovery
- 2.3. Other Applications
Proteomics Market Segmentation By Geography
-
1. North America
- 1.1. United States
- 1.2. Canada
- 1.3. Mexico
-
2. Europe
- 2.1. Germany
- 2.2. United Kingdom
- 2.3. France
- 2.4. Italy
- 2.5. Spain
- 2.6. Rest of Europe
-
3. Asia Pacific
- 3.1. China
- 3.2. Japan
- 3.3. India
- 3.4. Australia
- 3.5. South Korea
- 3.6. Rest of Asia Pacific
- 4. Middle East
-
5. GCC
- 5.1. South Africa
- 5.2. Rest of Middle East
-
6. South America
- 6.1. Brazil
- 6.2. Argentina
- 6.3. Rest of South America
Proteomics Market Regional Market Share
Geographic Coverage of Proteomics Market
Proteomics Market REPORT HIGHLIGHTS
| Aspects | Details |
|---|---|
| Study Period | 2020-2034 |
| Base Year | 2025 |
| Estimated Year | 2026 |
| Forecast Period | 2026-2034 |
| Historical Period | 2020-2025 |
| Growth Rate | CAGR of 8.42% from 2020-2034 |
| Segmentation |
|
Table of Contents
- 1. Introduction
- 1.1. Research Scope
- 1.2. Market Segmentation
- 1.3. Research Objective
- 1.4. Definitions and Assumptions
- 2. Executive Summary
- 2.1. Market Snapshot
- 3. Market Dynamics
- 3.1. Market Drivers
- 3.2. Market Restrains
- 3.3. Market Trends
- 3.4. Market Opportunities
- 4. Market Factor Analysis
- 4.1. Porters Five Forces
- 4.1.1. Bargaining Power of Suppliers
- 4.1.2. Bargaining Power of Buyers
- 4.1.3. Threat of New Entrants
- 4.1.4. Threat of Substitutes
- 4.1.5. Competitive Rivalry
- 4.2. PESTEL analysis
- 4.3. BCG Analysis
- 4.3.1. Stars (High Growth, High Market Share)
- 4.3.2. Cash Cows (Low Growth, High Market Share)
- 4.3.3. Question Mark (High Growth, Low Market Share)
- 4.3.4. Dogs (Low Growth, Low Market Share)
- 4.4. Ansoff Matrix Analysis
- 4.5. Supply Chain Analysis
- 4.6. Regulatory Landscape
- 4.7. Current Market Potential and Opportunity Assessment (TAM–SAM–SOM Framework)
- 4.8. DMV Analyst Note
- 4.1. Porters Five Forces
- 5. Market Analysis, Insights and Forecast 2021-2033
- 5.1. Market Analysis, Insights and Forecast - by Product & Services
- 5.1.1. Instrumentation Technology
- 5.1.1.1. Spectroscopy
- 5.1.1.2. Chromatography
- 5.1.1.3. Electrophoresis
- 5.1.1.4. Protein Microarrays
- 5.1.1.5. X-Ray Crystallography
- 5.1.1.6. Other Instrumentation Technologies
- 5.1.2. Reagents
- 5.1.3. Software and Services
- 5.1.1. Instrumentation Technology
- 5.2. Market Analysis, Insights and Forecast - by Application
- 5.2.1. Clinical Diagnostics
- 5.2.2. Drug Discovery
- 5.2.3. Other Applications
- 5.3. Market Analysis, Insights and Forecast - by Region
- 5.3.1. North America
- 5.3.2. Europe
- 5.3.3. Asia Pacific
- 5.3.4. Middle East
- 5.3.5. GCC
- 5.3.6. South America
- 5.1. Market Analysis, Insights and Forecast - by Product & Services
- 6. Global Proteomics Market Analysis, Insights and Forecast, 2021-2033
- 6.1. Market Analysis, Insights and Forecast - by Product & Services
- 6.1.1. Instrumentation Technology
- 6.1.1.1. Spectroscopy
- 6.1.1.2. Chromatography
- 6.1.1.3. Electrophoresis
- 6.1.1.4. Protein Microarrays
- 6.1.1.5. X-Ray Crystallography
- 6.1.1.6. Other Instrumentation Technologies
- 6.1.2. Reagents
- 6.1.3. Software and Services
- 6.1.1. Instrumentation Technology
- 6.2. Market Analysis, Insights and Forecast - by Application
- 6.2.1. Clinical Diagnostics
- 6.2.2. Drug Discovery
- 6.2.3. Other Applications
- 6.1. Market Analysis, Insights and Forecast - by Product & Services
- 7. North America Proteomics Market Analysis, Insights and Forecast, 2020-2032
- 7.1. Market Analysis, Insights and Forecast - by Product & Services
- 7.1.1. Instrumentation Technology
- 7.1.1.1. Spectroscopy
- 7.1.1.2. Chromatography
- 7.1.1.3. Electrophoresis
- 7.1.1.4. Protein Microarrays
- 7.1.1.5. X-Ray Crystallography
- 7.1.1.6. Other Instrumentation Technologies
- 7.1.2. Reagents
- 7.1.3. Software and Services
- 7.1.1. Instrumentation Technology
- 7.2. Market Analysis, Insights and Forecast - by Application
- 7.2.1. Clinical Diagnostics
- 7.2.2. Drug Discovery
- 7.2.3. Other Applications
- 7.1. Market Analysis, Insights and Forecast - by Product & Services
- 8. Europe Proteomics Market Analysis, Insights and Forecast, 2020-2032
- 8.1. Market Analysis, Insights and Forecast - by Product & Services
- 8.1.1. Instrumentation Technology
- 8.1.1.1. Spectroscopy
- 8.1.1.2. Chromatography
- 8.1.1.3. Electrophoresis
- 8.1.1.4. Protein Microarrays
- 8.1.1.5. X-Ray Crystallography
- 8.1.1.6. Other Instrumentation Technologies
- 8.1.2. Reagents
- 8.1.3. Software and Services
- 8.1.1. Instrumentation Technology
- 8.2. Market Analysis, Insights and Forecast - by Application
- 8.2.1. Clinical Diagnostics
- 8.2.2. Drug Discovery
- 8.2.3. Other Applications
- 8.1. Market Analysis, Insights and Forecast - by Product & Services
- 9. Asia Pacific Proteomics Market Analysis, Insights and Forecast, 2020-2032
- 9.1. Market Analysis, Insights and Forecast - by Product & Services
- 9.1.1. Instrumentation Technology
- 9.1.1.1. Spectroscopy
- 9.1.1.2. Chromatography
- 9.1.1.3. Electrophoresis
- 9.1.1.4. Protein Microarrays
- 9.1.1.5. X-Ray Crystallography
- 9.1.1.6. Other Instrumentation Technologies
- 9.1.2. Reagents
- 9.1.3. Software and Services
- 9.1.1. Instrumentation Technology
- 9.2. Market Analysis, Insights and Forecast - by Application
- 9.2.1. Clinical Diagnostics
- 9.2.2. Drug Discovery
- 9.2.3. Other Applications
- 9.1. Market Analysis, Insights and Forecast - by Product & Services
- 10. Middle East Proteomics Market Analysis, Insights and Forecast, 2020-2032
- 10.1. Market Analysis, Insights and Forecast - by Product & Services
- 10.1.1. Instrumentation Technology
- 10.1.1.1. Spectroscopy
- 10.1.1.2. Chromatography
- 10.1.1.3. Electrophoresis
- 10.1.1.4. Protein Microarrays
- 10.1.1.5. X-Ray Crystallography
- 10.1.1.6. Other Instrumentation Technologies
- 10.1.2. Reagents
- 10.1.3. Software and Services
- 10.1.1. Instrumentation Technology
- 10.2. Market Analysis, Insights and Forecast - by Application
- 10.2.1. Clinical Diagnostics
- 10.2.2. Drug Discovery
- 10.2.3. Other Applications
- 10.1. Market Analysis, Insights and Forecast - by Product & Services
- 11. GCC Proteomics Market Analysis, Insights and Forecast, 2020-2032
- 11.1. Market Analysis, Insights and Forecast - by Product & Services
- 11.1.1. Instrumentation Technology
- 11.1.1.1. Spectroscopy
- 11.1.1.2. Chromatography
- 11.1.1.3. Electrophoresis
- 11.1.1.4. Protein Microarrays
- 11.1.1.5. X-Ray Crystallography
- 11.1.1.6. Other Instrumentation Technologies
- 11.1.2. Reagents
- 11.1.3. Software and Services
- 11.1.1. Instrumentation Technology
- 11.2. Market Analysis, Insights and Forecast - by Application
- 11.2.1. Clinical Diagnostics
- 11.2.2. Drug Discovery
- 11.2.3. Other Applications
- 11.1. Market Analysis, Insights and Forecast - by Product & Services
- 12. South America Proteomics Market Analysis, Insights and Forecast, 2020-2032
- 12.1. Market Analysis, Insights and Forecast - by Product & Services
- 12.1.1. Instrumentation Technology
- 12.1.1.1. Spectroscopy
- 12.1.1.2. Chromatography
- 12.1.1.3. Electrophoresis
- 12.1.1.4. Protein Microarrays
- 12.1.1.5. X-Ray Crystallography
- 12.1.1.6. Other Instrumentation Technologies
- 12.1.2. Reagents
- 12.1.3. Software and Services
- 12.1.1. Instrumentation Technology
- 12.2. Market Analysis, Insights and Forecast - by Application
- 12.2.1. Clinical Diagnostics
- 12.2.2. Drug Discovery
- 12.2.3. Other Applications
- 12.1. Market Analysis, Insights and Forecast - by Product & Services
- 13. Competitive Analysis
- 13.1. Company Profiles
- 13.1.1 Promega Corporation
- 13.1.1.1. Company Overview
- 13.1.1.2. Products
- 13.1.1.3. Company Financials
- 13.1.1.4. SWOT Analysis
- 13.1.2 Bio-Rad Laboratories Inc
- 13.1.2.1. Company Overview
- 13.1.2.2. Products
- 13.1.2.3. Company Financials
- 13.1.2.4. SWOT Analysis
- 13.1.3 Waters Corporation
- 13.1.3.1. Company Overview
- 13.1.3.2. Products
- 13.1.3.3. Company Financials
- 13.1.3.4. SWOT Analysis
- 13.1.4 Merck KGaA
- 13.1.4.1. Company Overview
- 13.1.4.2. Products
- 13.1.4.3. Company Financials
- 13.1.4.4. SWOT Analysis
- 13.1.5 GE Healthcare
- 13.1.5.1. Company Overview
- 13.1.5.2. Products
- 13.1.5.3. Company Financials
- 13.1.5.4. SWOT Analysis
- 13.1.6 Thermo Fisher Scientific Inc
- 13.1.6.1. Company Overview
- 13.1.6.2. Products
- 13.1.6.3. Company Financials
- 13.1.6.4. SWOT Analysis
- 13.1.7 Danaher Corporation
- 13.1.7.1. Company Overview
- 13.1.7.2. Products
- 13.1.7.3. Company Financials
- 13.1.7.4. SWOT Analysis
- 13.1.8 Agilent Technologies Inc
- 13.1.8.1. Company Overview
- 13.1.8.2. Products
- 13.1.8.3. Company Financials
- 13.1.8.4. SWOT Analysis
- 13.1.9 Bruker Corporation
- 13.1.9.1. Company Overview
- 13.1.9.2. Products
- 13.1.9.3. Company Financials
- 13.1.9.4. SWOT Analysis
- 13.1.1 Promega Corporation
- 13.2. Market Entropy
- 13.2.1 Company's Key Areas Served
- 13.2.2 Recent Developments
- 13.3. Company Market Share Analysis 2025
- 13.3.1 Top 5 Companies Market Share Analysis
- 13.3.2 Top 3 Companies Market Share Analysis
- 13.4. List of Potential Customers
- 14. Research Methodology
List of Figures
- Figure 1: Global Proteomics Market Revenue Breakdown (Million, %) by Region 2025 & 2033
- Figure 2: Global Proteomics Market Volume Breakdown (K Unit, %) by Region 2025 & 2033
- Figure 3: North America Proteomics Market Revenue (Million), by Product & Services 2025 & 2033
- Figure 4: North America Proteomics Market Volume (K Unit), by Product & Services 2025 & 2033
- Figure 5: North America Proteomics Market Revenue Share (%), by Product & Services 2025 & 2033
- Figure 6: North America Proteomics Market Volume Share (%), by Product & Services 2025 & 2033
- Figure 7: North America Proteomics Market Revenue (Million), by Application 2025 & 2033
- Figure 8: North America Proteomics Market Volume (K Unit), by Application 2025 & 2033
- Figure 9: North America Proteomics Market Revenue Share (%), by Application 2025 & 2033
- Figure 10: North America Proteomics Market Volume Share (%), by Application 2025 & 2033
- Figure 11: North America Proteomics Market Revenue (Million), by Country 2025 & 2033
- Figure 12: North America Proteomics Market Volume (K Unit), by Country 2025 & 2033
- Figure 13: North America Proteomics Market Revenue Share (%), by Country 2025 & 2033
- Figure 14: North America Proteomics Market Volume Share (%), by Country 2025 & 2033
- Figure 15: Europe Proteomics Market Revenue (Million), by Product & Services 2025 & 2033
- Figure 16: Europe Proteomics Market Volume (K Unit), by Product & Services 2025 & 2033
- Figure 17: Europe Proteomics Market Revenue Share (%), by Product & Services 2025 & 2033
- Figure 18: Europe Proteomics Market Volume Share (%), by Product & Services 2025 & 2033
- Figure 19: Europe Proteomics Market Revenue (Million), by Application 2025 & 2033
- Figure 20: Europe Proteomics Market Volume (K Unit), by Application 2025 & 2033
- Figure 21: Europe Proteomics Market Revenue Share (%), by Application 2025 & 2033
- Figure 22: Europe Proteomics Market Volume Share (%), by Application 2025 & 2033
- Figure 23: Europe Proteomics Market Revenue (Million), by Country 2025 & 2033
- Figure 24: Europe Proteomics Market Volume (K Unit), by Country 2025 & 2033
- Figure 25: Europe Proteomics Market Revenue Share (%), by Country 2025 & 2033
- Figure 26: Europe Proteomics Market Volume Share (%), by Country 2025 & 2033
- Figure 27: Asia Pacific Proteomics Market Revenue (Million), by Product & Services 2025 & 2033
- Figure 28: Asia Pacific Proteomics Market Volume (K Unit), by Product & Services 2025 & 2033
- Figure 29: Asia Pacific Proteomics Market Revenue Share (%), by Product & Services 2025 & 2033
- Figure 30: Asia Pacific Proteomics Market Volume Share (%), by Product & Services 2025 & 2033
- Figure 31: Asia Pacific Proteomics Market Revenue (Million), by Application 2025 & 2033
- Figure 32: Asia Pacific Proteomics Market Volume (K Unit), by Application 2025 & 2033
- Figure 33: Asia Pacific Proteomics Market Revenue Share (%), by Application 2025 & 2033
- Figure 34: Asia Pacific Proteomics Market Volume Share (%), by Application 2025 & 2033
- Figure 35: Asia Pacific Proteomics Market Revenue (Million), by Country 2025 & 2033
- Figure 36: Asia Pacific Proteomics Market Volume (K Unit), by Country 2025 & 2033
- Figure 37: Asia Pacific Proteomics Market Revenue Share (%), by Country 2025 & 2033
- Figure 38: Asia Pacific Proteomics Market Volume Share (%), by Country 2025 & 2033
- Figure 39: Middle East Proteomics Market Revenue (Million), by Product & Services 2025 & 2033
- Figure 40: Middle East Proteomics Market Volume (K Unit), by Product & Services 2025 & 2033
- Figure 41: Middle East Proteomics Market Revenue Share (%), by Product & Services 2025 & 2033
- Figure 42: Middle East Proteomics Market Volume Share (%), by Product & Services 2025 & 2033
- Figure 43: Middle East Proteomics Market Revenue (Million), by Application 2025 & 2033
- Figure 44: Middle East Proteomics Market Volume (K Unit), by Application 2025 & 2033
- Figure 45: Middle East Proteomics Market Revenue Share (%), by Application 2025 & 2033
- Figure 46: Middle East Proteomics Market Volume Share (%), by Application 2025 & 2033
- Figure 47: Middle East Proteomics Market Revenue (Million), by Country 2025 & 2033
- Figure 48: Middle East Proteomics Market Volume (K Unit), by Country 2025 & 2033
- Figure 49: Middle East Proteomics Market Revenue Share (%), by Country 2025 & 2033
- Figure 50: Middle East Proteomics Market Volume Share (%), by Country 2025 & 2033
- Figure 51: GCC Proteomics Market Revenue (Million), by Product & Services 2025 & 2033
- Figure 52: GCC Proteomics Market Volume (K Unit), by Product & Services 2025 & 2033
- Figure 53: GCC Proteomics Market Revenue Share (%), by Product & Services 2025 & 2033
- Figure 54: GCC Proteomics Market Volume Share (%), by Product & Services 2025 & 2033
- Figure 55: GCC Proteomics Market Revenue (Million), by Application 2025 & 2033
- Figure 56: GCC Proteomics Market Volume (K Unit), by Application 2025 & 2033
- Figure 57: GCC Proteomics Market Revenue Share (%), by Application 2025 & 2033
- Figure 58: GCC Proteomics Market Volume Share (%), by Application 2025 & 2033
- Figure 59: GCC Proteomics Market Revenue (Million), by Country 2025 & 2033
- Figure 60: GCC Proteomics Market Volume (K Unit), by Country 2025 & 2033
- Figure 61: GCC Proteomics Market Revenue Share (%), by Country 2025 & 2033
- Figure 62: GCC Proteomics Market Volume Share (%), by Country 2025 & 2033
- Figure 63: South America Proteomics Market Revenue (Million), by Product & Services 2025 & 2033
- Figure 64: South America Proteomics Market Volume (K Unit), by Product & Services 2025 & 2033
- Figure 65: South America Proteomics Market Revenue Share (%), by Product & Services 2025 & 2033
- Figure 66: South America Proteomics Market Volume Share (%), by Product & Services 2025 & 2033
- Figure 67: South America Proteomics Market Revenue (Million), by Application 2025 & 2033
- Figure 68: South America Proteomics Market Volume (K Unit), by Application 2025 & 2033
- Figure 69: South America Proteomics Market Revenue Share (%), by Application 2025 & 2033
- Figure 70: South America Proteomics Market Volume Share (%), by Application 2025 & 2033
- Figure 71: South America Proteomics Market Revenue (Million), by Country 2025 & 2033
- Figure 72: South America Proteomics Market Volume (K Unit), by Country 2025 & 2033
- Figure 73: South America Proteomics Market Revenue Share (%), by Country 2025 & 2033
- Figure 74: South America Proteomics Market Volume Share (%), by Country 2025 & 2033
List of Tables
- Table 1: Global Proteomics Market Revenue Million Forecast, by Product & Services 2020 & 2033
- Table 2: Global Proteomics Market Volume K Unit Forecast, by Product & Services 2020 & 2033
- Table 3: Global Proteomics Market Revenue Million Forecast, by Application 2020 & 2033
- Table 4: Global Proteomics Market Volume K Unit Forecast, by Application 2020 & 2033
- Table 5: Global Proteomics Market Revenue Million Forecast, by Region 2020 & 2033
- Table 6: Global Proteomics Market Volume K Unit Forecast, by Region 2020 & 2033
- Table 7: Global Proteomics Market Revenue Million Forecast, by Product & Services 2020 & 2033
- Table 8: Global Proteomics Market Volume K Unit Forecast, by Product & Services 2020 & 2033
- Table 9: Global Proteomics Market Revenue Million Forecast, by Application 2020 & 2033
- Table 10: Global Proteomics Market Volume K Unit Forecast, by Application 2020 & 2033
- Table 11: Global Proteomics Market Revenue Million Forecast, by Country 2020 & 2033
- Table 12: Global Proteomics Market Volume K Unit Forecast, by Country 2020 & 2033
- Table 13: United States Proteomics Market Revenue (Million) Forecast, by Application 2020 & 2033
- Table 14: United States Proteomics Market Volume (K Unit) Forecast, by Application 2020 & 2033
- Table 15: Canada Proteomics Market Revenue (Million) Forecast, by Application 2020 & 2033
- Table 16: Canada Proteomics Market Volume (K Unit) Forecast, by Application 2020 & 2033
- Table 17: Mexico Proteomics Market Revenue (Million) Forecast, by Application 2020 & 2033
- Table 18: Mexico Proteomics Market Volume (K Unit) Forecast, by Application 2020 & 2033
- Table 19: Global Proteomics Market Revenue Million Forecast, by Product & Services 2020 & 2033
- Table 20: Global Proteomics Market Volume K Unit Forecast, by Product & Services 2020 & 2033
- Table 21: Global Proteomics Market Revenue Million Forecast, by Application 2020 & 2033
- Table 22: Global Proteomics Market Volume K Unit Forecast, by Application 2020 & 2033
- Table 23: Global Proteomics Market Revenue Million Forecast, by Country 2020 & 2033
- Table 24: Global Proteomics Market Volume K Unit Forecast, by Country 2020 & 2033
- Table 25: Germany Proteomics Market Revenue (Million) Forecast, by Application 2020 & 2033
- Table 26: Germany Proteomics Market Volume (K Unit) Forecast, by Application 2020 & 2033
- Table 27: United Kingdom Proteomics Market Revenue (Million) Forecast, by Application 2020 & 2033
- Table 28: United Kingdom Proteomics Market Volume (K Unit) Forecast, by Application 2020 & 2033
- Table 29: France Proteomics Market Revenue (Million) Forecast, by Application 2020 & 2033
- Table 30: France Proteomics Market Volume (K Unit) Forecast, by Application 2020 & 2033
- Table 31: Italy Proteomics Market Revenue (Million) Forecast, by Application 2020 & 2033
- Table 32: Italy Proteomics Market Volume (K Unit) Forecast, by Application 2020 & 2033
- Table 33: Spain Proteomics Market Revenue (Million) Forecast, by Application 2020 & 2033
- Table 34: Spain Proteomics Market Volume (K Unit) Forecast, by Application 2020 & 2033
- Table 35: Rest of Europe Proteomics Market Revenue (Million) Forecast, by Application 2020 & 2033
- Table 36: Rest of Europe Proteomics Market Volume (K Unit) Forecast, by Application 2020 & 2033
- Table 37: Global Proteomics Market Revenue Million Forecast, by Product & Services 2020 & 2033
- Table 38: Global Proteomics Market Volume K Unit Forecast, by Product & Services 2020 & 2033
- Table 39: Global Proteomics Market Revenue Million Forecast, by Application 2020 & 2033
- Table 40: Global Proteomics Market Volume K Unit Forecast, by Application 2020 & 2033
- Table 41: Global Proteomics Market Revenue Million Forecast, by Country 2020 & 2033
- Table 42: Global Proteomics Market Volume K Unit Forecast, by Country 2020 & 2033
- Table 43: China Proteomics Market Revenue (Million) Forecast, by Application 2020 & 2033
- Table 44: China Proteomics Market Volume (K Unit) Forecast, by Application 2020 & 2033
- Table 45: Japan Proteomics Market Revenue (Million) Forecast, by Application 2020 & 2033
- Table 46: Japan Proteomics Market Volume (K Unit) Forecast, by Application 2020 & 2033
- Table 47: India Proteomics Market Revenue (Million) Forecast, by Application 2020 & 2033
- Table 48: India Proteomics Market Volume (K Unit) Forecast, by Application 2020 & 2033
- Table 49: Australia Proteomics Market Revenue (Million) Forecast, by Application 2020 & 2033
- Table 50: Australia Proteomics Market Volume (K Unit) Forecast, by Application 2020 & 2033
- Table 51: South Korea Proteomics Market Revenue (Million) Forecast, by Application 2020 & 2033
- Table 52: South Korea Proteomics Market Volume (K Unit) Forecast, by Application 2020 & 2033
- Table 53: Rest of Asia Pacific Proteomics Market Revenue (Million) Forecast, by Application 2020 & 2033
- Table 54: Rest of Asia Pacific Proteomics Market Volume (K Unit) Forecast, by Application 2020 & 2033
- Table 55: Global Proteomics Market Revenue Million Forecast, by Product & Services 2020 & 2033
- Table 56: Global Proteomics Market Volume K Unit Forecast, by Product & Services 2020 & 2033
- Table 57: Global Proteomics Market Revenue Million Forecast, by Application 2020 & 2033
- Table 58: Global Proteomics Market Volume K Unit Forecast, by Application 2020 & 2033
- Table 59: Global Proteomics Market Revenue Million Forecast, by Country 2020 & 2033
- Table 60: Global Proteomics Market Volume K Unit Forecast, by Country 2020 & 2033
- Table 61: Global Proteomics Market Revenue Million Forecast, by Product & Services 2020 & 2033
- Table 62: Global Proteomics Market Volume K Unit Forecast, by Product & Services 2020 & 2033
- Table 63: Global Proteomics Market Revenue Million Forecast, by Application 2020 & 2033
- Table 64: Global Proteomics Market Volume K Unit Forecast, by Application 2020 & 2033
- Table 65: Global Proteomics Market Revenue Million Forecast, by Country 2020 & 2033
- Table 66: Global Proteomics Market Volume K Unit Forecast, by Country 2020 & 2033
- Table 67: South Africa Proteomics Market Revenue (Million) Forecast, by Application 2020 & 2033
- Table 68: South Africa Proteomics Market Volume (K Unit) Forecast, by Application 2020 & 2033
- Table 69: Rest of Middle East Proteomics Market Revenue (Million) Forecast, by Application 2020 & 2033
- Table 70: Rest of Middle East Proteomics Market Volume (K Unit) Forecast, by Application 2020 & 2033
- Table 71: Global Proteomics Market Revenue Million Forecast, by Product & Services 2020 & 2033
- Table 72: Global Proteomics Market Volume K Unit Forecast, by Product & Services 2020 & 2033
- Table 73: Global Proteomics Market Revenue Million Forecast, by Application 2020 & 2033
- Table 74: Global Proteomics Market Volume K Unit Forecast, by Application 2020 & 2033
- Table 75: Global Proteomics Market Revenue Million Forecast, by Country 2020 & 2033
- Table 76: Global Proteomics Market Volume K Unit Forecast, by Country 2020 & 2033
- Table 77: Brazil Proteomics Market Revenue (Million) Forecast, by Application 2020 & 2033
- Table 78: Brazil Proteomics Market Volume (K Unit) Forecast, by Application 2020 & 2033
- Table 79: Argentina Proteomics Market Revenue (Million) Forecast, by Application 2020 & 2033
- Table 80: Argentina Proteomics Market Volume (K Unit) Forecast, by Application 2020 & 2033
- Table 81: Rest of South America Proteomics Market Revenue (Million) Forecast, by Application 2020 & 2033
- Table 82: Rest of South America Proteomics Market Volume (K Unit) Forecast, by Application 2020 & 2033
Frequently Asked Questions
1. What is the projected Compound Annual Growth Rate (CAGR) of the Proteomics Market?
The projected CAGR is approximately 8.42%.
2. Which companies are prominent players in the Proteomics Market?
Key companies in the market include Promega Corporation, Bio-Rad Laboratories Inc, Waters Corporation, Merck KGaA, GE Healthcare, Thermo Fisher Scientific Inc, Danaher Corporation, Agilent Technologies Inc, Bruker Corporation.
3. What are the main segments of the Proteomics Market?
The market segments include Product & Services, Application.
4. Can you provide details about the market size?
The market size is estimated to be USD 27.60 Million as of 2022.
5. What are some drivers contributing to market growth?
Rising Demand for Personalized Medicine; Increasing R&D Expenditure and Government Funding for Proteomics; Technological Advancements.
6. What are the notable trends driving market growth?
Drug Discovery is Expected to Witness Healthy CAGR in Future.
7. Are there any restraints impacting market growth?
High Cost of Instruments.
8. Can you provide examples of recent developments in the market?
N/A
9. What pricing options are available for accessing the report?
Pricing options include single-user, multi-user, and enterprise licenses priced at USD 4750, USD 5250, and USD 8750 respectively.
10. Is the market size provided in terms of value or volume?
The market size is provided in terms of value, measured in Million and volume, measured in K Unit.
11. Are there any specific market keywords associated with the report?
Yes, the market keyword associated with the report is "Proteomics Market," which aids in identifying and referencing the specific market segment covered.
12. How do I determine which pricing option suits my needs best?
The pricing options vary based on user requirements and access needs. Individual users may opt for single-user licenses, while businesses requiring broader access may choose multi-user or enterprise licenses for cost-effective access to the report.
13. Are there any additional resources or data provided in the Proteomics Market report?
While the report offers comprehensive insights, it's advisable to review the specific contents or supplementary materials provided to ascertain if additional resources or data are available.
14. How can I stay updated on further developments or reports in the Proteomics Market?
To stay informed about further developments, trends, and reports in the Proteomics Market, consider subscribing to industry newsletters, following relevant companies and organizations, or regularly checking reputable industry news sources and publications.
Methodology
Step 1 - Identification of Relevant Samples Size from Population Database


Step 2 - Approaches for Defining Global Market Size (Value, Volume* & Price*)

Note*: In applicable scenarios
Step 3 - Data Sources
Primary Research
- Web Analytics
- Survey Reports
- Research Institute
- Latest Research Reports
- Opinion Leaders
Secondary Research
- Annual Reports
- White Paper
- Latest Press Release
- Industry Association
- Paid Database
- Investor Presentations

Step 4 - Data Triangulation
Involves using different sources of information in order to increase the validity of a study
These sources are likely to be stakeholders in a program - participants, other researchers, program staff, other community members, and so on.
Then we put all data in single framework & apply various statistical tools to find out the dynamic on the market.
During the analysis stage, feedback from the stakeholder groups would be compared to determine areas of agreement as well as areas of divergence