

Key Insights
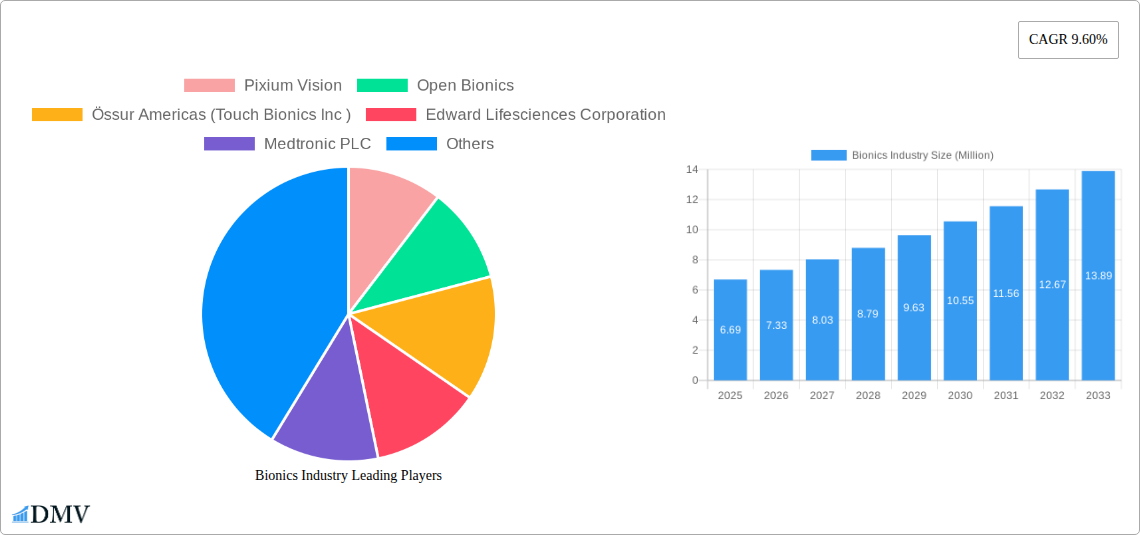
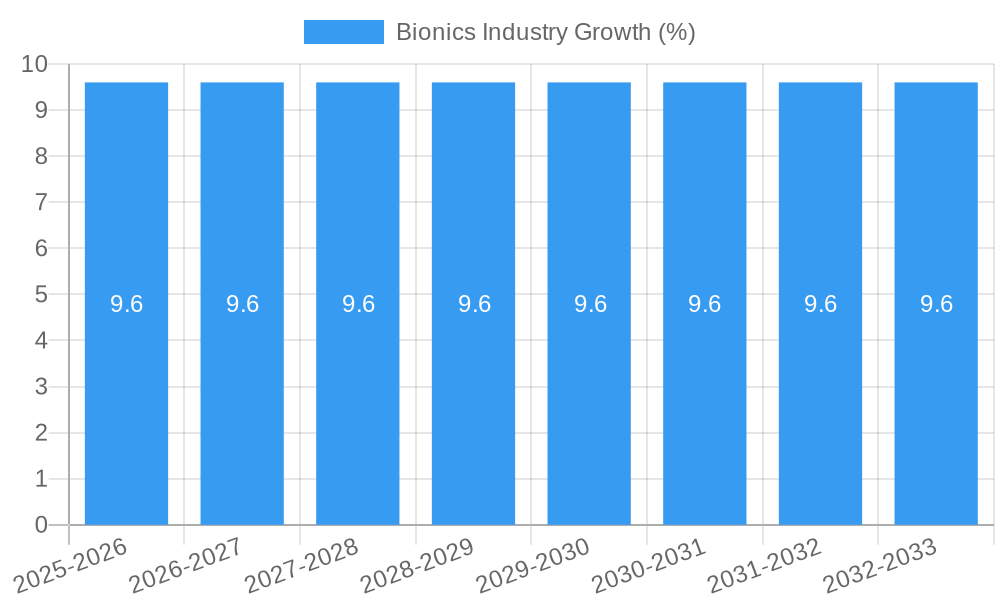
The global bionics market is poised for significant expansion, projected to reach an estimated USD 6.69 million by 2025, with a robust Compound Annual Growth Rate (CAGR) of 9.60% anticipated throughout the forecast period extending to 2033. This substantial growth trajectory is fueled by a confluence of technological advancements, increasing awareness of bionic solutions, and a rising prevalence of conditions necessitating bionic interventions. Vision bionics, catering to individuals with visual impairments, and orthopedic bionics, addressing limb loss and mobility challenges, are expected to be key growth drivers, supported by innovations in prosthetics, cochlear implants for hearing restoration, and cardiac bionics for heart conditions. Leading companies such as Medtronic PLC, Össur Americas (Touch Bionics Inc.), and Cochlear Limited are actively investing in research and development, introducing more sophisticated and user-friendly bionic devices that enhance quality of life.
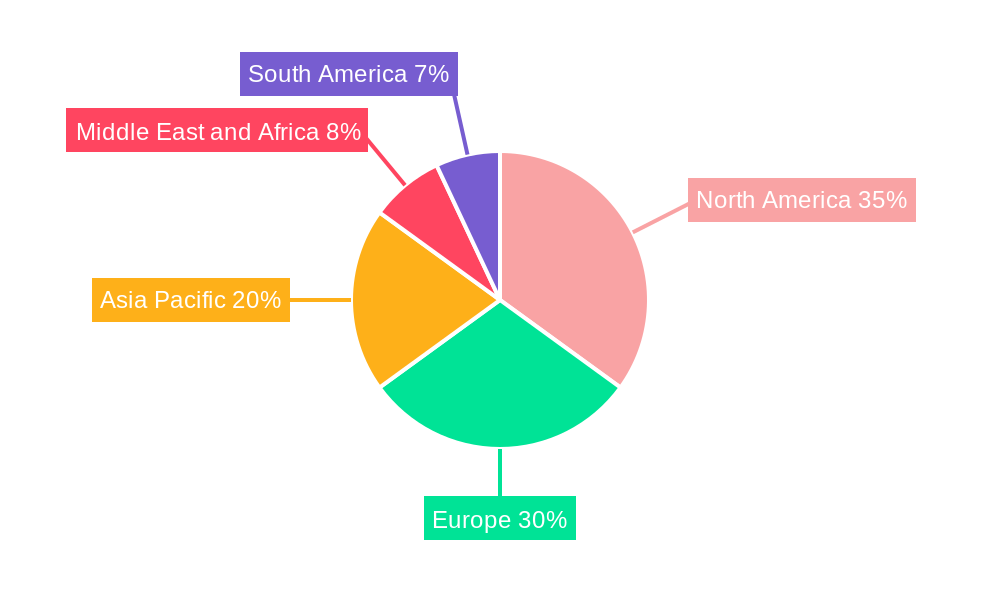
Geographically, North America and Europe are anticipated to dominate the market share, owing to advanced healthcare infrastructure, high disposable incomes, and a strong emphasis on technological adoption. However, the Asia Pacific region presents a burgeoning opportunity for growth, driven by an expanding middle class, increasing healthcare expenditure, and a growing patient population. While the market is characterized by significant growth potential, certain factors could pose challenges. These might include the high cost of advanced bionic devices, regulatory hurdles for new product approvals, and the need for extensive rehabilitation and training for users. Nevertheless, the persistent drive for innovation, coupled with a growing understanding of the transformative impact of bionics on restoring human capabilities, suggests a promising future for the industry.
This in-depth report offers a detailed analysis of the global Bionics Industry, a rapidly evolving sector at the forefront of medical technology and human augmentation. Covering the historical period (2019-2024), base year (2025), estimated year (2025), and an extensive forecast period (2025-2033), this market intelligence report provides actionable insights for stakeholders seeking to capitalize on the burgeoning bionic limbs market, bionic eyes market, and bionic ear market. Dive deep into market composition, industry evolution, leading regions, product innovations, growth drivers, challenges, and future opportunities.
Bionics Industry Market Composition & Trends
The Bionics Industry is characterized by a dynamic market composition with a moderate concentration of leading players and a growing number of innovative startups. Key trends influencing market dynamics include relentless innovation in prosthetic and orthotic technologies, the increasing adoption of advanced bionics for rehabilitation, and a growing awareness of the potential of neural interface technology in human-machine integration. Regulatory landscapes are evolving to accommodate novel bionic devices, with a focus on safety and efficacy. Substitute products, primarily traditional prosthetics and assistive devices, still hold a significant market share, but are steadily being surpassed by the superior functionality of bionic solutions. End-user profiles range from individuals with limb loss or sensory impairments to those seeking enhanced physical capabilities. Mergers and acquisitions (M&A) activity is a significant catalyst for market consolidation and technological advancement, with deal values projected to reach [Specific M&A Deal Value in Millions] Million during the forecast period.
- Market Concentration: Fragmented with key innovators and established players.
- Innovation Catalysts: Advancements in AI, robotics, materials science, and neuroscience.
- Regulatory Landscapes: Evolving standards for safety, efficacy, and data privacy.
- Substitute Products: Traditional prosthetics, wheelchairs, hearing aids.
- End-User Profiles: Amputees, individuals with sensory deficits, athletes, elderly population.
- M&A Activities: Strategic acquisitions to gain market share and technological capabilities, with an estimated [Specific M&A Deal Value in Millions] Million in deal values.
- Market Share Distribution: Orthopedic Bionics leading, followed by Ear Bionics and Vision Bionics.
Bionics Industry Industry Evolution
The Bionics Industry has witnessed a remarkable evolutionary trajectory, driven by breakthroughs in miniaturization, AI-powered control systems, and biocompatible materials. The market growth trajectory is robust, with projected compound annual growth rates (CAGR) of [Specific CAGR]% from 2025 to 2033. Technological advancements have been paramount, transforming passive prosthetics into active, responsive bionic limbs that offer unprecedented levels of dexterity and sensory feedback. The development of advanced neural interfaces, allowing direct communication between the brain and bionic devices, is a key disruptor, promising a future where human and artificial limbs operate seamlessly. Consumer demands are increasingly shifting towards more natural movement, intuitive control, and personalized solutions, propelling companies to invest heavily in R&D. Adoption metrics for advanced bionic solutions are on the rise, particularly in developed economies, fueled by improved insurance coverage and a growing understanding of their long-term benefits. The integration of sophisticated sensor technology and machine learning algorithms is enabling bionic devices to learn and adapt to individual user needs, further enhancing their appeal. The historical period saw foundational advancements, while the forecast period is poised for widespread adoption and transformative innovations, further solidifying the dominance of bionic technologies.
Leading Regions, Countries, or Segments in Bionics Industry
North America currently dominates the Bionics Industry, driven by substantial investments in research and development, a high prevalence of limb loss and sensory impairments, and a favorable regulatory environment for medical devices. The United States, in particular, stands out due to the presence of leading companies like Medtronic PLC and Edward Lifesciences Corporation, alongside pioneering startups. The Orthopedic Bionic segment leads in market share, owing to the higher incidence of orthopedic conditions and trauma requiring advanced prosthetic and orthotic solutions. Europe and Asia-Pacific are emerging as significant growth markets, with increasing government support for healthcare innovation and a growing middle class with higher disposable incomes.
- Dominant Region: North America, primarily the United States.
- Key Drivers in North America:
- Robust R&D funding, exceeding [Specific R&D Funding in Millions] Million annually.
- High incidence of amputations and orthopedic injuries.
- Advanced healthcare infrastructure and insurance coverage.
- Presence of major market players and research institutions.
- Dominant Segment: Orthopedic Bionic, accounting for an estimated [Specific Segment Market Share]% of the total market.
- Key Drivers for Orthopedic Bionics:
- Technological advancements in prosthetic design and functionality.
- Increasing adoption of robotic exoskeletons for rehabilitation.
- Growing demand for high-dexterity bionic hands and arms.
- Key Drivers for Orthopedic Bionics:
- Emerging Regions: Europe, Asia-Pacific.
- Growth Factors in Emerging Regions:
- Rising healthcare expenditure and government initiatives.
- Increasing patient awareness and acceptance of bionic solutions.
- Expansion of manufacturing capabilities and local innovation hubs.
- Growth Factors in Emerging Regions:
- Other Significant Segments:
- Ear Bionics: Driven by advancements in cochlear implants and assistive listening devices, with market growth projected at [Specific Ear Bionics CAGR]%.
- Vision Bionics: Fueled by progress in retinal implants and visual prosthetics, aiming to restore sight for the visually impaired.
Bionics Industry Product Innovations
The Bionics Industry is a hotbed of product innovation, constantly pushing the boundaries of what's possible. Recent breakthroughs include the development of bionic limbs with independent finger joints and adaptive grip systems that mimic natural hand movements, offering unparalleled dexterity and tactile feedback. Advances in AI-powered control algorithms enable bionic devices to interpret user intentions with greater accuracy, leading to more intuitive and seamless operation. Innovations in lightweight, durable materials are enhancing comfort and performance. Furthermore, developments in sensory feedback systems are allowing wearers to experience a sense of touch and proprioception, crucial for natural movement and control. The integration of advanced power management systems is also extending the operational life of bionic devices, making them more practical for everyday use.
Propelling Factors for Bionics Industry Growth
Several key factors are propelling the growth of the Bionics Industry. Technological advancements, particularly in AI, robotics, and neuroscience, are creating more sophisticated and user-friendly bionic devices. The increasing prevalence of conditions requiring bionic intervention, such as limb loss due to diabetes, trauma, and vascular diseases, is expanding the addressable market. Government initiatives and increased healthcare spending in various regions are also supportive of market expansion. Furthermore, growing awareness and acceptance of bionic solutions among the general population and medical professionals, coupled with improving reimbursement policies, are significant growth drivers. The pursuit of enhanced human capabilities and improved quality of life for individuals with disabilities is a fundamental catalyst.
- Technological Advancements: AI, robotics, neuroscience, advanced materials.
- Increasing Disease Prevalence: Diabetes, trauma, vascular diseases leading to limb loss.
- Government Support & Healthcare Spending: Increased investment in medical technology and rehabilitation.
- Growing Awareness & Acceptance: Improved understanding of bionic benefits.
- Favorable Reimbursement Policies: Expanded coverage for bionic devices.
- Demand for Enhanced Quality of Life: Focus on restoring function and independence.
Obstacles in the Bionics Industry Market
Despite its promising growth, the Bionics Industry faces several obstacles. High manufacturing costs associated with advanced bionic devices can limit accessibility for some segments of the population. Stringent regulatory approval processes for novel technologies can lead to extended market entry times. Supply chain disruptions and the need for specialized components can impact production volumes. Additionally, the competitive landscape, while fostering innovation, can also lead to market fragmentation. User acceptance and the learning curve associated with operating complex bionic systems can also present challenges. The cybersecurity of connected bionic devices is also a growing concern.
- High Manufacturing Costs: Limiting accessibility for certain demographics.
- Stringent Regulatory Approvals: Prolonged market entry timelines.
- Supply Chain Vulnerabilities: Reliance on specialized components.
- Complex User Training: Steep learning curve for advanced functionalities.
- Cybersecurity Concerns: Protecting sensitive user data and device integrity.
- Reimbursement Gaps: Inconsistent or insufficient coverage in some markets.
Future Opportunities in Bionics Industry
The Bionics Industry is ripe with future opportunities. The continued advancement of neural interface technology holds immense potential for creating truly integrated human-machine systems. Emerging markets in developing economies present a significant growth avenue as healthcare infrastructure and affordability improve. Innovations in sensory feedback and haptic technology will further enhance the user experience and functionality of bionic devices. The application of bionics beyond traditional medical rehabilitation, such as in performance enhancement for athletes and specialized industrial applications, is another area of growth. The development of more affordable and accessible bionic solutions will democratize access to these life-changing technologies.
- Advancements in Neural Interfaces: Seamless human-machine integration.
- Emerging Market Penetration: Untapped potential in developing economies.
- Enhanced Sensory Feedback: Improved haptic and proprioceptive capabilities.
- Beyond Medical Applications: Performance enhancement, industrial uses.
- Affordability and Accessibility: Democratizing advanced bionic solutions.
Major Players in the Bionics Industry Ecosystem
- Pixium Vision
- Open Bionics
- Össur Americas (Touch Bionics Inc)
- Edward Lifesciences Corporation
- Medtronic PLC
- Ekso Bionics
- Ottobock
- Bionics Scientific Technologies (P) Ltd
- Bionic Prosthetics and Orthotics
- Mobius Bionics
- Cochlear Limited
- Advanced Bionics AG
Key Developments in Bionics Industry Industry
- July 2022: Prosthetics startup Unlimited Tomorrow launched TrueLimb, its next-generation bionic arm. The hands have independent finger joints and six adaptive grips, which conform to objects the wearer comes in contact with, and subtle vibrations, enhancing user control and tactile experience.
- February 2022: Ceryx Medical launched Cysoni bionic device for respiratory sinus arrhythmia. It is noted that the Cysoni device replicates RSA, triggering heartbeats based on respiratory function, representing a significant advancement in cardiac bionics.
Strategic Bionics Industry Market Forecast
The Bionics Industry is poised for substantial growth, driven by ongoing technological breakthroughs and an increasing demand for advanced assistive and augmentative devices. The forecast period (2025-2033) will witness the widespread adoption of AI-powered bionic solutions, particularly in the Orthopedic Bionic segment, and significant progress in Vision Bionics and Ear Bionics. Emerging markets are expected to contribute significantly to market expansion. Key opportunities lie in further developing neural interfaces, enhancing sensory feedback, and improving device affordability, paving the way for a future where bionics plays an integral role in enhancing human health and capabilities. The market is projected to reach [Specific Market Size in Millions] Million by 2033.
Bionics Industry Segmentation
-
1. Type of Bionics
- 1.1. Vision Bionics
- 1.2. Ear Bionics
- 1.3. Orthopedic Bionic
- 1.4. Cardiac Bionics
Bionics Industry Segmentation By Geography
-
1. North America
- 1.1. United States
- 1.2. Canada
- 1.3. Mexico
-
2. Europe
- 2.1. Germany
- 2.2. United Kingdom
- 2.3. France
- 2.4. Italy
- 2.5. Spain
- 2.6. Rest of Europe
-
3. Asia Pacific
- 3.1. China
- 3.2. Japan
- 3.3. India
- 3.4. Australia
- 3.5. South Korea
- 3.6. Rest of Asia Pacific
-
4. Middle East and Africa
- 4.1. GCC
- 4.2. South Africa
- 4.3. Rest of Middle East and Africa
-
5. South America
- 5.1. Brazil
- 5.2. Argentina
- 5.3. Rest of South America
Bionics Industry REPORT HIGHLIGHTS
| Aspects | Details |
|---|---|
| Study Period | 2019-2033 |
| Base Year | 2024 |
| Estimated Year | 2025 |
| Forecast Period | 2025-2033 |
| Historical Period | 2019-2024 |
| Growth Rate | CAGR of 9.60% from 2019-2033 |
| Segmentation |
|
Table of Contents
- 1. Introduction
- 1.1. Research Scope
- 1.2. Market Segmentation
- 1.3. Research Methodology
- 1.4. Definitions and Assumptions
- 2. Executive Summary
- 2.1. Introduction
- 3. Market Dynamics
- 3.1. Introduction
- 3.2. Market Drivers
- 3.2.1. Increased Incidence of Disabilities and Organ Failures; Technological Advancements; High Incidence of Road Accidents Leading to Amputations
- 3.3. Market Restrains
- 3.3.1. High Cost of Devices and Uncertain Reimbursement Scenarios; Fear of Device Malfunction and Its Consequences
- 3.4. Market Trends
- 3.4.1. Cochlear implant are Estimated to Hold a Significant Share in the Fixation Type Segment of the Bionics Market
- 4. Market Factor Analysis
- 4.1. Porters Five Forces
- 4.2. Supply/Value Chain
- 4.3. PESTEL analysis
- 4.4. Market Entropy
- 4.5. Patent/Trademark Analysis
- 5. Global Bionics Industry Analysis, Insights and Forecast, 2019-2031
- 5.1. Market Analysis, Insights and Forecast - by Type of Bionics
- 5.1.1. Vision Bionics
- 5.1.2. Ear Bionics
- 5.1.3. Orthopedic Bionic
- 5.1.4. Cardiac Bionics
- 5.2. Market Analysis, Insights and Forecast - by Region
- 5.2.1. North America
- 5.2.2. Europe
- 5.2.3. Asia Pacific
- 5.2.4. Middle East and Africa
- 5.2.5. South America
- 5.1. Market Analysis, Insights and Forecast - by Type of Bionics
- 6. North America Bionics Industry Analysis, Insights and Forecast, 2019-2031
- 6.1. Market Analysis, Insights and Forecast - by Type of Bionics
- 6.1.1. Vision Bionics
- 6.1.2. Ear Bionics
- 6.1.3. Orthopedic Bionic
- 6.1.4. Cardiac Bionics
- 6.1. Market Analysis, Insights and Forecast - by Type of Bionics
- 7. Europe Bionics Industry Analysis, Insights and Forecast, 2019-2031
- 7.1. Market Analysis, Insights and Forecast - by Type of Bionics
- 7.1.1. Vision Bionics
- 7.1.2. Ear Bionics
- 7.1.3. Orthopedic Bionic
- 7.1.4. Cardiac Bionics
- 7.1. Market Analysis, Insights and Forecast - by Type of Bionics
- 8. Asia Pacific Bionics Industry Analysis, Insights and Forecast, 2019-2031
- 8.1. Market Analysis, Insights and Forecast - by Type of Bionics
- 8.1.1. Vision Bionics
- 8.1.2. Ear Bionics
- 8.1.3. Orthopedic Bionic
- 8.1.4. Cardiac Bionics
- 8.1. Market Analysis, Insights and Forecast - by Type of Bionics
- 9. Middle East and Africa Bionics Industry Analysis, Insights and Forecast, 2019-2031
- 9.1. Market Analysis, Insights and Forecast - by Type of Bionics
- 9.1.1. Vision Bionics
- 9.1.2. Ear Bionics
- 9.1.3. Orthopedic Bionic
- 9.1.4. Cardiac Bionics
- 9.1. Market Analysis, Insights and Forecast - by Type of Bionics
- 10. South America Bionics Industry Analysis, Insights and Forecast, 2019-2031
- 10.1. Market Analysis, Insights and Forecast - by Type of Bionics
- 10.1.1. Vision Bionics
- 10.1.2. Ear Bionics
- 10.1.3. Orthopedic Bionic
- 10.1.4. Cardiac Bionics
- 10.1. Market Analysis, Insights and Forecast - by Type of Bionics
- 11. North America Bionics Industry Analysis, Insights and Forecast, 2019-2031
- 11.1. Market Analysis, Insights and Forecast - By Country/Sub-region
- 11.1.1 United States
- 11.1.2 Canada
- 11.1.3 Mexico
- 12. Europe Bionics Industry Analysis, Insights and Forecast, 2019-2031
- 12.1. Market Analysis, Insights and Forecast - By Country/Sub-region
- 12.1.1 Germany
- 12.1.2 United Kingdom
- 12.1.3 France
- 12.1.4 Italy
- 12.1.5 Spain
- 12.1.6 Rest of Europe
- 13. Asia Pacific Bionics Industry Analysis, Insights and Forecast, 2019-2031
- 13.1. Market Analysis, Insights and Forecast - By Country/Sub-region
- 13.1.1 China
- 13.1.2 Japan
- 13.1.3 India
- 13.1.4 Australia
- 13.1.5 South Korea
- 13.1.6 Rest of Asia Pacific
- 14. Middle East and Africa Bionics Industry Analysis, Insights and Forecast, 2019-2031
- 14.1. Market Analysis, Insights and Forecast - By Country/Sub-region
- 14.1.1 GCC
- 14.1.2 South Africa
- 14.1.3 Rest of Middle East and Africa
- 15. South America Bionics Industry Analysis, Insights and Forecast, 2019-2031
- 15.1. Market Analysis, Insights and Forecast - By Country/Sub-region
- 15.1.1 Brazil
- 15.1.2 Argentina
- 15.1.3 Rest of South America
- 16. Competitive Analysis
- 16.1. Global Market Share Analysis 2024
- 16.2. Company Profiles
- 16.2.1 Pixium Vision
- 16.2.1.1. Overview
- 16.2.1.2. Products
- 16.2.1.3. SWOT Analysis
- 16.2.1.4. Recent Developments
- 16.2.1.5. Financials (Based on Availability)
- 16.2.2 Open Bionics
- 16.2.2.1. Overview
- 16.2.2.2. Products
- 16.2.2.3. SWOT Analysis
- 16.2.2.4. Recent Developments
- 16.2.2.5. Financials (Based on Availability)
- 16.2.3 Össur Americas (Touch Bionics Inc )
- 16.2.3.1. Overview
- 16.2.3.2. Products
- 16.2.3.3. SWOT Analysis
- 16.2.3.4. Recent Developments
- 16.2.3.5. Financials (Based on Availability)
- 16.2.4 Edward Lifesciences Corporation
- 16.2.4.1. Overview
- 16.2.4.2. Products
- 16.2.4.3. SWOT Analysis
- 16.2.4.4. Recent Developments
- 16.2.4.5. Financials (Based on Availability)
- 16.2.5 Medtronic PLC
- 16.2.5.1. Overview
- 16.2.5.2. Products
- 16.2.5.3. SWOT Analysis
- 16.2.5.4. Recent Developments
- 16.2.5.5. Financials (Based on Availability)
- 16.2.6 Ekso Bionics
- 16.2.6.1. Overview
- 16.2.6.2. Products
- 16.2.6.3. SWOT Analysis
- 16.2.6.4. Recent Developments
- 16.2.6.5. Financials (Based on Availability)
- 16.2.7 Ottobock
- 16.2.7.1. Overview
- 16.2.7.2. Products
- 16.2.7.3. SWOT Analysis
- 16.2.7.4. Recent Developments
- 16.2.7.5. Financials (Based on Availability)
- 16.2.8 Bionics Scientific Technologies (P) Ltd
- 16.2.8.1. Overview
- 16.2.8.2. Products
- 16.2.8.3. SWOT Analysis
- 16.2.8.4. Recent Developments
- 16.2.8.5. Financials (Based on Availability)
- 16.2.9 Bionic Prosthetics and Orthotics
- 16.2.9.1. Overview
- 16.2.9.2. Products
- 16.2.9.3. SWOT Analysis
- 16.2.9.4. Recent Developments
- 16.2.9.5. Financials (Based on Availability)
- 16.2.10 Mobius Bionics
- 16.2.10.1. Overview
- 16.2.10.2. Products
- 16.2.10.3. SWOT Analysis
- 16.2.10.4. Recent Developments
- 16.2.10.5. Financials (Based on Availability)
- 16.2.11 Cochlear Limited
- 16.2.11.1. Overview
- 16.2.11.2. Products
- 16.2.11.3. SWOT Analysis
- 16.2.11.4. Recent Developments
- 16.2.11.5. Financials (Based on Availability)
- 16.2.12 Advanced Bionics AG
- 16.2.12.1. Overview
- 16.2.12.2. Products
- 16.2.12.3. SWOT Analysis
- 16.2.12.4. Recent Developments
- 16.2.12.5. Financials (Based on Availability)
- 16.2.1 Pixium Vision
List of Figures
- Figure 1: Global Bionics Industry Revenue Breakdown (Million, %) by Region 2024 & 2032
- Figure 2: Global Bionics Industry Volume Breakdown (K Unit, %) by Region 2024 & 2032
- Figure 3: North America Bionics Industry Revenue (Million), by Country 2024 & 2032
- Figure 4: North America Bionics Industry Volume (K Unit), by Country 2024 & 2032
- Figure 5: North America Bionics Industry Revenue Share (%), by Country 2024 & 2032
- Figure 6: North America Bionics Industry Volume Share (%), by Country 2024 & 2032
- Figure 7: Europe Bionics Industry Revenue (Million), by Country 2024 & 2032
- Figure 8: Europe Bionics Industry Volume (K Unit), by Country 2024 & 2032
- Figure 9: Europe Bionics Industry Revenue Share (%), by Country 2024 & 2032
- Figure 10: Europe Bionics Industry Volume Share (%), by Country 2024 & 2032
- Figure 11: Asia Pacific Bionics Industry Revenue (Million), by Country 2024 & 2032
- Figure 12: Asia Pacific Bionics Industry Volume (K Unit), by Country 2024 & 2032
- Figure 13: Asia Pacific Bionics Industry Revenue Share (%), by Country 2024 & 2032
- Figure 14: Asia Pacific Bionics Industry Volume Share (%), by Country 2024 & 2032
- Figure 15: Middle East and Africa Bionics Industry Revenue (Million), by Country 2024 & 2032
- Figure 16: Middle East and Africa Bionics Industry Volume (K Unit), by Country 2024 & 2032
- Figure 17: Middle East and Africa Bionics Industry Revenue Share (%), by Country 2024 & 2032
- Figure 18: Middle East and Africa Bionics Industry Volume Share (%), by Country 2024 & 2032
- Figure 19: South America Bionics Industry Revenue (Million), by Country 2024 & 2032
- Figure 20: South America Bionics Industry Volume (K Unit), by Country 2024 & 2032
- Figure 21: South America Bionics Industry Revenue Share (%), by Country 2024 & 2032
- Figure 22: South America Bionics Industry Volume Share (%), by Country 2024 & 2032
- Figure 23: North America Bionics Industry Revenue (Million), by Type of Bionics 2024 & 2032
- Figure 24: North America Bionics Industry Volume (K Unit), by Type of Bionics 2024 & 2032
- Figure 25: North America Bionics Industry Revenue Share (%), by Type of Bionics 2024 & 2032
- Figure 26: North America Bionics Industry Volume Share (%), by Type of Bionics 2024 & 2032
- Figure 27: North America Bionics Industry Revenue (Million), by Country 2024 & 2032
- Figure 28: North America Bionics Industry Volume (K Unit), by Country 2024 & 2032
- Figure 29: North America Bionics Industry Revenue Share (%), by Country 2024 & 2032
- Figure 30: North America Bionics Industry Volume Share (%), by Country 2024 & 2032
- Figure 31: Europe Bionics Industry Revenue (Million), by Type of Bionics 2024 & 2032
- Figure 32: Europe Bionics Industry Volume (K Unit), by Type of Bionics 2024 & 2032
- Figure 33: Europe Bionics Industry Revenue Share (%), by Type of Bionics 2024 & 2032
- Figure 34: Europe Bionics Industry Volume Share (%), by Type of Bionics 2024 & 2032
- Figure 35: Europe Bionics Industry Revenue (Million), by Country 2024 & 2032
- Figure 36: Europe Bionics Industry Volume (K Unit), by Country 2024 & 2032
- Figure 37: Europe Bionics Industry Revenue Share (%), by Country 2024 & 2032
- Figure 38: Europe Bionics Industry Volume Share (%), by Country 2024 & 2032
- Figure 39: Asia Pacific Bionics Industry Revenue (Million), by Type of Bionics 2024 & 2032
- Figure 40: Asia Pacific Bionics Industry Volume (K Unit), by Type of Bionics 2024 & 2032
- Figure 41: Asia Pacific Bionics Industry Revenue Share (%), by Type of Bionics 2024 & 2032
- Figure 42: Asia Pacific Bionics Industry Volume Share (%), by Type of Bionics 2024 & 2032
- Figure 43: Asia Pacific Bionics Industry Revenue (Million), by Country 2024 & 2032
- Figure 44: Asia Pacific Bionics Industry Volume (K Unit), by Country 2024 & 2032
- Figure 45: Asia Pacific Bionics Industry Revenue Share (%), by Country 2024 & 2032
- Figure 46: Asia Pacific Bionics Industry Volume Share (%), by Country 2024 & 2032
- Figure 47: Middle East and Africa Bionics Industry Revenue (Million), by Type of Bionics 2024 & 2032
- Figure 48: Middle East and Africa Bionics Industry Volume (K Unit), by Type of Bionics 2024 & 2032
- Figure 49: Middle East and Africa Bionics Industry Revenue Share (%), by Type of Bionics 2024 & 2032
- Figure 50: Middle East and Africa Bionics Industry Volume Share (%), by Type of Bionics 2024 & 2032
- Figure 51: Middle East and Africa Bionics Industry Revenue (Million), by Country 2024 & 2032
- Figure 52: Middle East and Africa Bionics Industry Volume (K Unit), by Country 2024 & 2032
- Figure 53: Middle East and Africa Bionics Industry Revenue Share (%), by Country 2024 & 2032
- Figure 54: Middle East and Africa Bionics Industry Volume Share (%), by Country 2024 & 2032
- Figure 55: South America Bionics Industry Revenue (Million), by Type of Bionics 2024 & 2032
- Figure 56: South America Bionics Industry Volume (K Unit), by Type of Bionics 2024 & 2032
- Figure 57: South America Bionics Industry Revenue Share (%), by Type of Bionics 2024 & 2032
- Figure 58: South America Bionics Industry Volume Share (%), by Type of Bionics 2024 & 2032
- Figure 59: South America Bionics Industry Revenue (Million), by Country 2024 & 2032
- Figure 60: South America Bionics Industry Volume (K Unit), by Country 2024 & 2032
- Figure 61: South America Bionics Industry Revenue Share (%), by Country 2024 & 2032
- Figure 62: South America Bionics Industry Volume Share (%), by Country 2024 & 2032
List of Tables
- Table 1: Global Bionics Industry Revenue Million Forecast, by Region 2019 & 2032
- Table 2: Global Bionics Industry Volume K Unit Forecast, by Region 2019 & 2032
- Table 3: Global Bionics Industry Revenue Million Forecast, by Type of Bionics 2019 & 2032
- Table 4: Global Bionics Industry Volume K Unit Forecast, by Type of Bionics 2019 & 2032
- Table 5: Global Bionics Industry Revenue Million Forecast, by Region 2019 & 2032
- Table 6: Global Bionics Industry Volume K Unit Forecast, by Region 2019 & 2032
- Table 7: Global Bionics Industry Revenue Million Forecast, by Country 2019 & 2032
- Table 8: Global Bionics Industry Volume K Unit Forecast, by Country 2019 & 2032
- Table 9: United States Bionics Industry Revenue (Million) Forecast, by Application 2019 & 2032
- Table 10: United States Bionics Industry Volume (K Unit) Forecast, by Application 2019 & 2032
- Table 11: Canada Bionics Industry Revenue (Million) Forecast, by Application 2019 & 2032
- Table 12: Canada Bionics Industry Volume (K Unit) Forecast, by Application 2019 & 2032
- Table 13: Mexico Bionics Industry Revenue (Million) Forecast, by Application 2019 & 2032
- Table 14: Mexico Bionics Industry Volume (K Unit) Forecast, by Application 2019 & 2032
- Table 15: Global Bionics Industry Revenue Million Forecast, by Country 2019 & 2032
- Table 16: Global Bionics Industry Volume K Unit Forecast, by Country 2019 & 2032
- Table 17: Germany Bionics Industry Revenue (Million) Forecast, by Application 2019 & 2032
- Table 18: Germany Bionics Industry Volume (K Unit) Forecast, by Application 2019 & 2032
- Table 19: United Kingdom Bionics Industry Revenue (Million) Forecast, by Application 2019 & 2032
- Table 20: United Kingdom Bionics Industry Volume (K Unit) Forecast, by Application 2019 & 2032
- Table 21: France Bionics Industry Revenue (Million) Forecast, by Application 2019 & 2032
- Table 22: France Bionics Industry Volume (K Unit) Forecast, by Application 2019 & 2032
- Table 23: Italy Bionics Industry Revenue (Million) Forecast, by Application 2019 & 2032
- Table 24: Italy Bionics Industry Volume (K Unit) Forecast, by Application 2019 & 2032
- Table 25: Spain Bionics Industry Revenue (Million) Forecast, by Application 2019 & 2032
- Table 26: Spain Bionics Industry Volume (K Unit) Forecast, by Application 2019 & 2032
- Table 27: Rest of Europe Bionics Industry Revenue (Million) Forecast, by Application 2019 & 2032
- Table 28: Rest of Europe Bionics Industry Volume (K Unit) Forecast, by Application 2019 & 2032
- Table 29: Global Bionics Industry Revenue Million Forecast, by Country 2019 & 2032
- Table 30: Global Bionics Industry Volume K Unit Forecast, by Country 2019 & 2032
- Table 31: China Bionics Industry Revenue (Million) Forecast, by Application 2019 & 2032
- Table 32: China Bionics Industry Volume (K Unit) Forecast, by Application 2019 & 2032
- Table 33: Japan Bionics Industry Revenue (Million) Forecast, by Application 2019 & 2032
- Table 34: Japan Bionics Industry Volume (K Unit) Forecast, by Application 2019 & 2032
- Table 35: India Bionics Industry Revenue (Million) Forecast, by Application 2019 & 2032
- Table 36: India Bionics Industry Volume (K Unit) Forecast, by Application 2019 & 2032
- Table 37: Australia Bionics Industry Revenue (Million) Forecast, by Application 2019 & 2032
- Table 38: Australia Bionics Industry Volume (K Unit) Forecast, by Application 2019 & 2032
- Table 39: South Korea Bionics Industry Revenue (Million) Forecast, by Application 2019 & 2032
- Table 40: South Korea Bionics Industry Volume (K Unit) Forecast, by Application 2019 & 2032
- Table 41: Rest of Asia Pacific Bionics Industry Revenue (Million) Forecast, by Application 2019 & 2032
- Table 42: Rest of Asia Pacific Bionics Industry Volume (K Unit) Forecast, by Application 2019 & 2032
- Table 43: Global Bionics Industry Revenue Million Forecast, by Country 2019 & 2032
- Table 44: Global Bionics Industry Volume K Unit Forecast, by Country 2019 & 2032
- Table 45: GCC Bionics Industry Revenue (Million) Forecast, by Application 2019 & 2032
- Table 46: GCC Bionics Industry Volume (K Unit) Forecast, by Application 2019 & 2032
- Table 47: South Africa Bionics Industry Revenue (Million) Forecast, by Application 2019 & 2032
- Table 48: South Africa Bionics Industry Volume (K Unit) Forecast, by Application 2019 & 2032
- Table 49: Rest of Middle East and Africa Bionics Industry Revenue (Million) Forecast, by Application 2019 & 2032
- Table 50: Rest of Middle East and Africa Bionics Industry Volume (K Unit) Forecast, by Application 2019 & 2032
- Table 51: Global Bionics Industry Revenue Million Forecast, by Country 2019 & 2032
- Table 52: Global Bionics Industry Volume K Unit Forecast, by Country 2019 & 2032
- Table 53: Brazil Bionics Industry Revenue (Million) Forecast, by Application 2019 & 2032
- Table 54: Brazil Bionics Industry Volume (K Unit) Forecast, by Application 2019 & 2032
- Table 55: Argentina Bionics Industry Revenue (Million) Forecast, by Application 2019 & 2032
- Table 56: Argentina Bionics Industry Volume (K Unit) Forecast, by Application 2019 & 2032
- Table 57: Rest of South America Bionics Industry Revenue (Million) Forecast, by Application 2019 & 2032
- Table 58: Rest of South America Bionics Industry Volume (K Unit) Forecast, by Application 2019 & 2032
- Table 59: Global Bionics Industry Revenue Million Forecast, by Type of Bionics 2019 & 2032
- Table 60: Global Bionics Industry Volume K Unit Forecast, by Type of Bionics 2019 & 2032
- Table 61: Global Bionics Industry Revenue Million Forecast, by Country 2019 & 2032
- Table 62: Global Bionics Industry Volume K Unit Forecast, by Country 2019 & 2032
- Table 63: United States Bionics Industry Revenue (Million) Forecast, by Application 2019 & 2032
- Table 64: United States Bionics Industry Volume (K Unit) Forecast, by Application 2019 & 2032
- Table 65: Canada Bionics Industry Revenue (Million) Forecast, by Application 2019 & 2032
- Table 66: Canada Bionics Industry Volume (K Unit) Forecast, by Application 2019 & 2032
- Table 67: Mexico Bionics Industry Revenue (Million) Forecast, by Application 2019 & 2032
- Table 68: Mexico Bionics Industry Volume (K Unit) Forecast, by Application 2019 & 2032
- Table 69: Global Bionics Industry Revenue Million Forecast, by Type of Bionics 2019 & 2032
- Table 70: Global Bionics Industry Volume K Unit Forecast, by Type of Bionics 2019 & 2032
- Table 71: Global Bionics Industry Revenue Million Forecast, by Country 2019 & 2032
- Table 72: Global Bionics Industry Volume K Unit Forecast, by Country 2019 & 2032
- Table 73: Germany Bionics Industry Revenue (Million) Forecast, by Application 2019 & 2032
- Table 74: Germany Bionics Industry Volume (K Unit) Forecast, by Application 2019 & 2032
- Table 75: United Kingdom Bionics Industry Revenue (Million) Forecast, by Application 2019 & 2032
- Table 76: United Kingdom Bionics Industry Volume (K Unit) Forecast, by Application 2019 & 2032
- Table 77: France Bionics Industry Revenue (Million) Forecast, by Application 2019 & 2032
- Table 78: France Bionics Industry Volume (K Unit) Forecast, by Application 2019 & 2032
- Table 79: Italy Bionics Industry Revenue (Million) Forecast, by Application 2019 & 2032
- Table 80: Italy Bionics Industry Volume (K Unit) Forecast, by Application 2019 & 2032
- Table 81: Spain Bionics Industry Revenue (Million) Forecast, by Application 2019 & 2032
- Table 82: Spain Bionics Industry Volume (K Unit) Forecast, by Application 2019 & 2032
- Table 83: Rest of Europe Bionics Industry Revenue (Million) Forecast, by Application 2019 & 2032
- Table 84: Rest of Europe Bionics Industry Volume (K Unit) Forecast, by Application 2019 & 2032
- Table 85: Global Bionics Industry Revenue Million Forecast, by Type of Bionics 2019 & 2032
- Table 86: Global Bionics Industry Volume K Unit Forecast, by Type of Bionics 2019 & 2032
- Table 87: Global Bionics Industry Revenue Million Forecast, by Country 2019 & 2032
- Table 88: Global Bionics Industry Volume K Unit Forecast, by Country 2019 & 2032
- Table 89: China Bionics Industry Revenue (Million) Forecast, by Application 2019 & 2032
- Table 90: China Bionics Industry Volume (K Unit) Forecast, by Application 2019 & 2032
- Table 91: Japan Bionics Industry Revenue (Million) Forecast, by Application 2019 & 2032
- Table 92: Japan Bionics Industry Volume (K Unit) Forecast, by Application 2019 & 2032
- Table 93: India Bionics Industry Revenue (Million) Forecast, by Application 2019 & 2032
- Table 94: India Bionics Industry Volume (K Unit) Forecast, by Application 2019 & 2032
- Table 95: Australia Bionics Industry Revenue (Million) Forecast, by Application 2019 & 2032
- Table 96: Australia Bionics Industry Volume (K Unit) Forecast, by Application 2019 & 2032
- Table 97: South Korea Bionics Industry Revenue (Million) Forecast, by Application 2019 & 2032
- Table 98: South Korea Bionics Industry Volume (K Unit) Forecast, by Application 2019 & 2032
- Table 99: Rest of Asia Pacific Bionics Industry Revenue (Million) Forecast, by Application 2019 & 2032
- Table 100: Rest of Asia Pacific Bionics Industry Volume (K Unit) Forecast, by Application 2019 & 2032
- Table 101: Global Bionics Industry Revenue Million Forecast, by Type of Bionics 2019 & 2032
- Table 102: Global Bionics Industry Volume K Unit Forecast, by Type of Bionics 2019 & 2032
- Table 103: Global Bionics Industry Revenue Million Forecast, by Country 2019 & 2032
- Table 104: Global Bionics Industry Volume K Unit Forecast, by Country 2019 & 2032
- Table 105: GCC Bionics Industry Revenue (Million) Forecast, by Application 2019 & 2032
- Table 106: GCC Bionics Industry Volume (K Unit) Forecast, by Application 2019 & 2032
- Table 107: South Africa Bionics Industry Revenue (Million) Forecast, by Application 2019 & 2032
- Table 108: South Africa Bionics Industry Volume (K Unit) Forecast, by Application 2019 & 2032
- Table 109: Rest of Middle East and Africa Bionics Industry Revenue (Million) Forecast, by Application 2019 & 2032
- Table 110: Rest of Middle East and Africa Bionics Industry Volume (K Unit) Forecast, by Application 2019 & 2032
- Table 111: Global Bionics Industry Revenue Million Forecast, by Type of Bionics 2019 & 2032
- Table 112: Global Bionics Industry Volume K Unit Forecast, by Type of Bionics 2019 & 2032
- Table 113: Global Bionics Industry Revenue Million Forecast, by Country 2019 & 2032
- Table 114: Global Bionics Industry Volume K Unit Forecast, by Country 2019 & 2032
- Table 115: Brazil Bionics Industry Revenue (Million) Forecast, by Application 2019 & 2032
- Table 116: Brazil Bionics Industry Volume (K Unit) Forecast, by Application 2019 & 2032
- Table 117: Argentina Bionics Industry Revenue (Million) Forecast, by Application 2019 & 2032
- Table 118: Argentina Bionics Industry Volume (K Unit) Forecast, by Application 2019 & 2032
- Table 119: Rest of South America Bionics Industry Revenue (Million) Forecast, by Application 2019 & 2032
- Table 120: Rest of South America Bionics Industry Volume (K Unit) Forecast, by Application 2019 & 2032
Frequently Asked Questions
1. What is the projected Compound Annual Growth Rate (CAGR) of the Bionics Industry?
The projected CAGR is approximately 9.60%.
2. Which companies are prominent players in the Bionics Industry?
Key companies in the market include Pixium Vision, Open Bionics, Össur Americas (Touch Bionics Inc ), Edward Lifesciences Corporation, Medtronic PLC, Ekso Bionics, Ottobock, Bionics Scientific Technologies (P) Ltd, Bionic Prosthetics and Orthotics, Mobius Bionics, Cochlear Limited, Advanced Bionics AG.
3. What are the main segments of the Bionics Industry?
The market segments include Type of Bionics.
4. Can you provide details about the market size?
The market size is estimated to be USD 6.69 Million as of 2022.
5. What are some drivers contributing to market growth?
Increased Incidence of Disabilities and Organ Failures; Technological Advancements; High Incidence of Road Accidents Leading to Amputations.
6. What are the notable trends driving market growth?
Cochlear implant are Estimated to Hold a Significant Share in the Fixation Type Segment of the Bionics Market.
7. Are there any restraints impacting market growth?
High Cost of Devices and Uncertain Reimbursement Scenarios; Fear of Device Malfunction and Its Consequences.
8. Can you provide examples of recent developments in the market?
In July 2022, Prosthetics startup Unlimited Tomorrow launched TrueLimb, its next-generation bionic arm. The hands have independent finger joints and six adaptive grips, which conform to objects the wearer comes in contact with, and subtle vibrations.
9. What pricing options are available for accessing the report?
Pricing options include single-user, multi-user, and enterprise licenses priced at USD 4750, USD 5250, and USD 8750 respectively.
10. Is the market size provided in terms of value or volume?
The market size is provided in terms of value, measured in Million and volume, measured in K Unit.
11. Are there any specific market keywords associated with the report?
Yes, the market keyword associated with the report is "Bionics Industry," which aids in identifying and referencing the specific market segment covered.
12. How do I determine which pricing option suits my needs best?
The pricing options vary based on user requirements and access needs. Individual users may opt for single-user licenses, while businesses requiring broader access may choose multi-user or enterprise licenses for cost-effective access to the report.
13. Are there any additional resources or data provided in the Bionics Industry report?
While the report offers comprehensive insights, it's advisable to review the specific contents or supplementary materials provided to ascertain if additional resources or data are available.
14. How can I stay updated on further developments or reports in the Bionics Industry?
To stay informed about further developments, trends, and reports in the Bionics Industry, consider subscribing to industry newsletters, following relevant companies and organizations, or regularly checking reputable industry news sources and publications.
Methodology
Step 1 - Identification of Relevant Samples Size from Population Database


Step 2 - Approaches for Defining Global Market Size (Value, Volume* & Price*)

Note*: In applicable scenarios
Step 3 - Data Sources
Primary Research
- Web Analytics
- Survey Reports
- Research Institute
- Latest Research Reports
- Opinion Leaders
Secondary Research
- Annual Reports
- White Paper
- Latest Press Release
- Industry Association
- Paid Database
- Investor Presentations

Step 4 - Data Triangulation
Involves using different sources of information in order to increase the validity of a study
These sources are likely to be stakeholders in a program - participants, other researchers, program staff, other community members, and so on.
Then we put all data in single framework & apply various statistical tools to find out the dynamic on the market.
During the analysis stage, feedback from the stakeholder groups would be compared to determine areas of agreement as well as areas of divergence
