

Key Insights
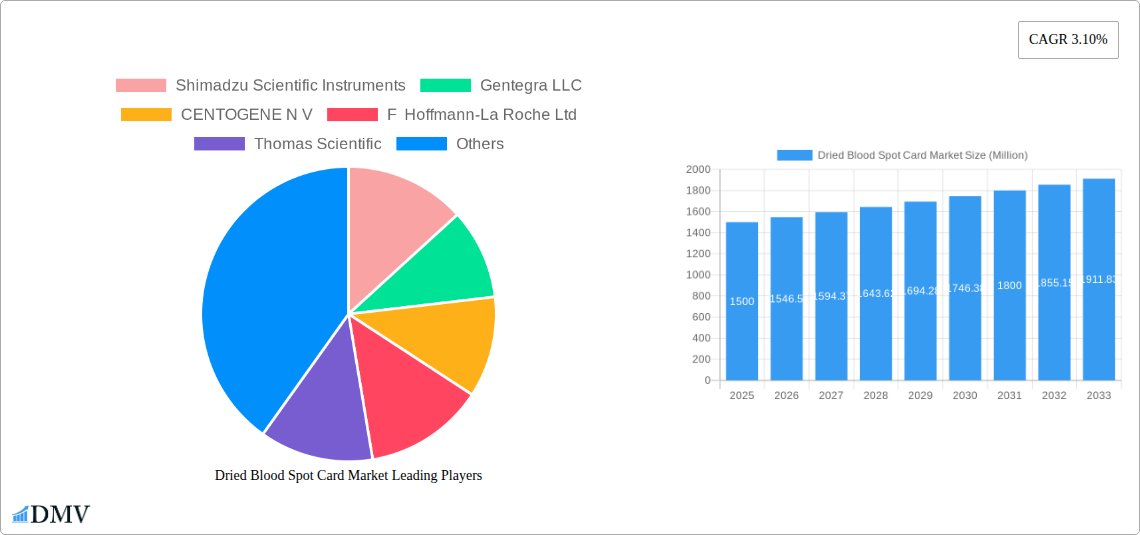
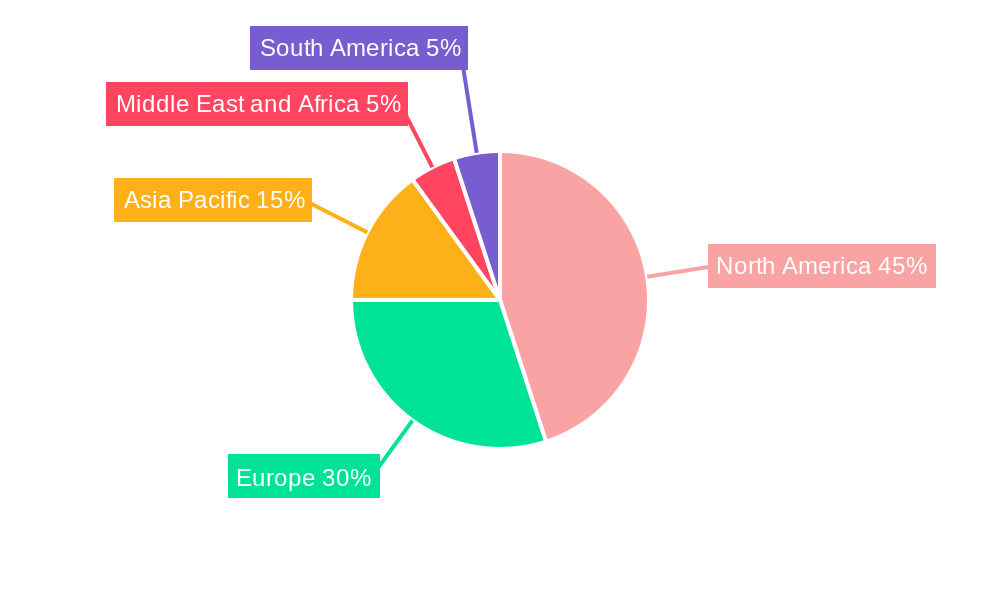
The Dried Blood Spot (DBS) card market is experiencing steady growth, driven by the increasing adoption of DBS technology in various applications, particularly in infectious disease testing, newborn screening, and therapeutic drug monitoring. The market's expansion is fueled by the numerous advantages of DBS cards, including their ease of use, cost-effectiveness, non-invasive nature, and suitability for remote sample collection and transportation. This makes them particularly valuable in resource-limited settings and for large-scale screening programs. The market is segmented by card type (Ahlstrom, Whatman, FTA, and others) and application, with infectious disease testing currently holding a significant share. Competition among manufacturers like Shimadzu Scientific Instruments, QIAGEN, and PerkinElmer is driving innovation and the development of improved card designs and functionalities. While the market faces certain restraints, such as the need for skilled personnel for accurate sample collection and analysis, and potential challenges in maintaining sample integrity during transportation, these are being addressed through advancements in card technology and standardized protocols. The North American region currently dominates the market, largely due to the advanced healthcare infrastructure and high adoption rates of DBS technology. However, Asia Pacific is expected to witness significant growth in the coming years, driven by increasing healthcare spending and rising prevalence of infectious diseases in the region. The overall market is projected to maintain a moderate but consistent growth rate over the forecast period (2025-2033), indicating a positive outlook for this essential tool in diagnostic testing.
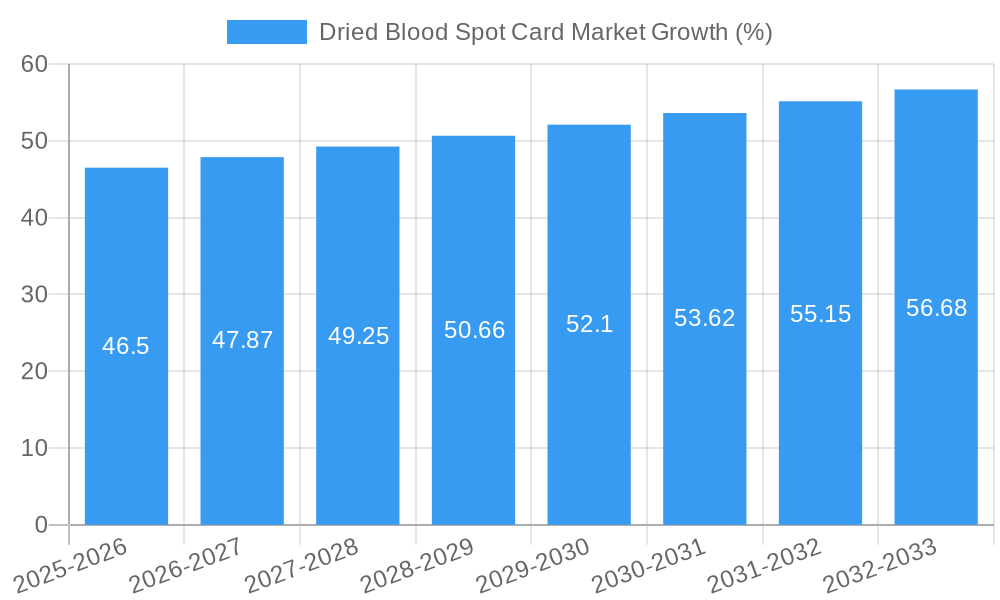
The projected Compound Annual Growth Rate (CAGR) of 3.10% suggests a consistent expansion of the DBS card market. This growth is expected to be influenced by several factors, including the increasing demand for point-of-care diagnostics, the growing need for efficient and cost-effective sample collection methods, and the rising prevalence of chronic diseases necessitating regular monitoring. Technological advancements in DBS card manufacturing, leading to improved sample stability and reduced errors, will further contribute to market expansion. While regional disparities exist, the global reach of major players and increasing healthcare investments in emerging economies ensure a diversified and expanding market landscape. The forecast period of 2025-2033 offers significant opportunities for market players to leverage advancements in technology and expand their product portfolio to cater to the diverse needs of various applications.
Dried Blood Spot Card Market: A Comprehensive Report (2019-2033)
This insightful report provides a detailed analysis of the Dried Blood Spot (DBS) Card market, offering a comprehensive overview of its current state, future trajectory, and key players. Covering the period from 2019 to 2033, with a base year of 2025 and a forecast period from 2025 to 2033, this report is an indispensable resource for stakeholders seeking to understand and capitalize on the growth opportunities within this dynamic market. The market is estimated to be worth xx Million in 2025.
Dried Blood Spot Card Market Market Composition & Trends
The Dried Blood Spot Card market is characterized by a moderately consolidated landscape, with key players vying for market share. Market concentration is influenced by factors including technological advancements, regulatory approvals, and the strategic adoption of M&A activities. While precise market share distribution is complex and varies across segments, some key players such as Shimadzu Scientific Instruments, QIAGEN, and PerkinElmer hold significant positions. The value of M&A deals in this sector has fluctuated in recent years, with deals ranging from xx Million to xx Million, reflecting strategic acquisitions to enhance product portfolios and market reach.
- Market Concentration: Moderately consolidated, with several large players and numerous smaller niche players.
- Innovation Catalysts: Advancements in molecular diagnostics, automation technologies, and miniaturization.
- Regulatory Landscape: Stringent regulatory approvals required for diagnostic applications, impacting market entry.
- Substitute Products: While DBS cards offer advantages, alternative sampling methods exist, posing competitive pressure.
- End-User Profiles: Primarily clinical diagnostic labs, research institutions, pharmaceutical companies, and forensic laboratories.
- M&A Activities: Strategic acquisitions driving market consolidation and expansion into new segments.
Dried Blood Spot Card Market Industry Evolution
The DBS card market has witnessed significant growth driven by increasing adoption in diverse applications. The historical period (2019-2024) saw a Compound Annual Growth Rate (CAGR) of xx%, fueled by technological advancements in molecular diagnostics and the rising demand for point-of-care testing. The forecast period (2025-2033) is projected to experience a CAGR of xx%, driven by factors such as increasing prevalence of infectious diseases, expanding newborn screening programs, and the growing adoption of DBS in therapeutic drug monitoring and forensic science. This growth reflects a broader shift towards non-invasive sampling techniques and cost-effective diagnostics. The adoption rate of DBS cards is projected to increase by xx% by 2033, with a significant portion driven by the infectious disease testing segment.
Leading Regions, Countries, or Segments in Dried Blood Spot Card Market
The North American region currently holds a dominant position in the DBS card market, driven by factors such as robust healthcare infrastructure, high research and development investments, and early adoption of advanced diagnostic technologies. Within the card types, Whatman and FTA cards hold significant market share due to their established reputation and widespread acceptance. In terms of application, infectious disease testing and newborn screening represent the largest market segments, fueled by increasing disease prevalence and government initiatives for population health management.
- Key Drivers (North America):
- High healthcare expenditure and advanced diagnostic infrastructure.
- Strong regulatory support for new diagnostic technologies.
- Significant R&D investments in molecular diagnostics.
- Key Drivers (Infectious Disease Testing):
- Rising prevalence of infectious diseases globally.
- Growing need for rapid and cost-effective diagnostic tools.
- Increased adoption of point-of-care testing strategies.
- Key Drivers (Newborn Screening):
- Government mandates for expanded newborn screening programs.
- Increased awareness of the importance of early disease detection.
- Development of improved diagnostic assays for various conditions.
The dominance of North America is projected to continue throughout the forecast period, although other regions such as Europe and Asia-Pacific are expected to experience significant growth, albeit at a slower rate.
Dried Blood Spot Card Market Product Innovations
Recent innovations in DBS card technology have focused on improving sample collection, storage, and transportation. This includes the development of cards with enhanced stability features, reducing the need for cold chain transportation and enhancing the accuracy of diagnostic tests. Furthermore, the integration of advanced material science and microfluidic technologies has led to the development of cards with improved sensitivity and specificity for specific analytes.
Propelling Factors for Dried Blood Spot Card Market Growth
Technological advancements in molecular diagnostics and automation are key drivers, enabling more sensitive and accurate testing. Economic factors such as rising healthcare costs and the need for cost-effective solutions are also propelling the market. Additionally, supportive regulatory frameworks are encouraging the development and adoption of new DBS-based diagnostic tests. For example, the growing number of government initiatives focusing on newborn screening and infectious disease control significantly contributes to the growth.
Obstacles in the Dried Blood Spot Card Market Market
Regulatory hurdles in gaining approvals for new diagnostic applications present a significant challenge. Supply chain disruptions, particularly regarding raw materials, can also impact production and availability. The competitive landscape, with several established players, creates price pressures and limits the profit margins for individual companies. These factors can collectively reduce the overall market growth if not properly addressed.
Future Opportunities in Dried Blood Spot Card Market
Emerging markets in developing countries present substantial growth potential. Advancements in digital technologies, like remote diagnostic capabilities, offer new opportunities for remote testing and data analysis. The development of novel applications for DBS cards in areas like personalized medicine and veterinary diagnostics also holds significant promise for expansion.
Major Players in the Dried Blood Spot Card Market Ecosystem
- Shimadzu Scientific Instruments
- Gentegra LLC
- CENTOGENE N V
- F Hoffmann-La Roche Ltd
- Thomas Scientific
- Hemaxis
- Lipomic Healthcare
- Eastern Business Forms Inc
- ARCHIMEDlife
- QIAGEN
- PerkinElmer
- Ahlstrom-Munksjö
Key Developments in Dried Blood Spot Card Market Industry
- August 2022: Boston Heart Diagnostics Corporation launched a broad range of tests using dried blood spot collection, covering cardiovascular risk factors, type 2 diabetes, and various wellness assessments. This significantly broadened the applicability of DBS technology.
- June 2022: A study showcased the effectiveness and cost-efficiency of Whatman FTA cards in detecting Yellow Fever Virus (YFV) using molecular diagnostics, highlighting the versatility and potential of existing products.
Strategic Dried Blood Spot Card Market Market Forecast
The future of the DBS card market is promising, driven by ongoing technological advancements, increasing adoption across diverse applications, and the expansion into new geographical markets. The market is poised for sustained growth, offering significant opportunities for established players and new entrants alike. Continued innovation and strategic partnerships will be crucial for success in this dynamic and rapidly evolving sector.
Dried Blood Spot Card Market Segmentation
-
1. Card Type
- 1.1. Ahlstrom 226
- 1.2. Whatman 903
- 1.3. FTA
- 1.4. Others
-
2. Application
- 2.1. Infectious Disease Testing
- 2.2. Newborn Screening
- 2.3. Forensics
- 2.4. Therapeutic Drug Monitoring
- 2.5. Others
Dried Blood Spot Card Market Segmentation By Geography
-
1. North America
- 1.1. United States
- 1.2. Canada
- 1.3. Mexico
-
2. Europe
- 2.1. Germany
- 2.2. United Kingdom
- 2.3. France
- 2.4. Italy
- 2.5. Spain
- 2.6. Rest of Europe
-
3. Asia Pacific
- 3.1. China
- 3.2. Japan
- 3.3. India
- 3.4. Australia
- 3.5. South Korea
- 3.6. Rest of Asia Pacific
-
4. Middle East and Africa
- 4.1. GCC
- 4.2. South Africa
- 4.3. Rest of Middle East and Africa
-
5. South America
- 5.1. Brazil
- 5.2. Argentina
- 5.3. Rest of South America
Dried Blood Spot Card Market REPORT HIGHLIGHTS
| Aspects | Details |
|---|---|
| Study Period | 2019-2033 |
| Base Year | 2024 |
| Estimated Year | 2025 |
| Forecast Period | 2025-2033 |
| Historical Period | 2019-2024 |
| Growth Rate | CAGR of 3.10% from 2019-2033 |
| Segmentation |
|
Table of Contents
- 1. Introduction
- 1.1. Research Scope
- 1.2. Market Segmentation
- 1.3. Research Methodology
- 1.4. Definitions and Assumptions
- 2. Executive Summary
- 2.1. Introduction
- 3. Market Dynamics
- 3.1. Introduction
- 3.2. Market Drivers
- 3.2.1. Increasing Use of DBS Cards in Diagnostic Testing; Rise of Forensic Toxicology Applications
- 3.3. Market Restrains
- 3.3.1. Contamination Caused in DBS Collection Cards
- 3.4. Market Trends
- 3.4.1. Newborn Screening Segment is Expected to Witness Considerable Growth Over the Forecast Period
- 4. Market Factor Analysis
- 4.1. Porters Five Forces
- 4.2. Supply/Value Chain
- 4.3. PESTEL analysis
- 4.4. Market Entropy
- 4.5. Patent/Trademark Analysis
- 5. Global Dried Blood Spot Card Market Analysis, Insights and Forecast, 2019-2031
- 5.1. Market Analysis, Insights and Forecast - by Card Type
- 5.1.1. Ahlstrom 226
- 5.1.2. Whatman 903
- 5.1.3. FTA
- 5.1.4. Others
- 5.2. Market Analysis, Insights and Forecast - by Application
- 5.2.1. Infectious Disease Testing
- 5.2.2. Newborn Screening
- 5.2.3. Forensics
- 5.2.4. Therapeutic Drug Monitoring
- 5.2.5. Others
- 5.3. Market Analysis, Insights and Forecast - by Region
- 5.3.1. North America
- 5.3.2. Europe
- 5.3.3. Asia Pacific
- 5.3.4. Middle East and Africa
- 5.3.5. South America
- 5.1. Market Analysis, Insights and Forecast - by Card Type
- 6. North America Dried Blood Spot Card Market Analysis, Insights and Forecast, 2019-2031
- 6.1. Market Analysis, Insights and Forecast - by Card Type
- 6.1.1. Ahlstrom 226
- 6.1.2. Whatman 903
- 6.1.3. FTA
- 6.1.4. Others
- 6.2. Market Analysis, Insights and Forecast - by Application
- 6.2.1. Infectious Disease Testing
- 6.2.2. Newborn Screening
- 6.2.3. Forensics
- 6.2.4. Therapeutic Drug Monitoring
- 6.2.5. Others
- 6.1. Market Analysis, Insights and Forecast - by Card Type
- 7. Europe Dried Blood Spot Card Market Analysis, Insights and Forecast, 2019-2031
- 7.1. Market Analysis, Insights and Forecast - by Card Type
- 7.1.1. Ahlstrom 226
- 7.1.2. Whatman 903
- 7.1.3. FTA
- 7.1.4. Others
- 7.2. Market Analysis, Insights and Forecast - by Application
- 7.2.1. Infectious Disease Testing
- 7.2.2. Newborn Screening
- 7.2.3. Forensics
- 7.2.4. Therapeutic Drug Monitoring
- 7.2.5. Others
- 7.1. Market Analysis, Insights and Forecast - by Card Type
- 8. Asia Pacific Dried Blood Spot Card Market Analysis, Insights and Forecast, 2019-2031
- 8.1. Market Analysis, Insights and Forecast - by Card Type
- 8.1.1. Ahlstrom 226
- 8.1.2. Whatman 903
- 8.1.3. FTA
- 8.1.4. Others
- 8.2. Market Analysis, Insights and Forecast - by Application
- 8.2.1. Infectious Disease Testing
- 8.2.2. Newborn Screening
- 8.2.3. Forensics
- 8.2.4. Therapeutic Drug Monitoring
- 8.2.5. Others
- 8.1. Market Analysis, Insights and Forecast - by Card Type
- 9. Middle East and Africa Dried Blood Spot Card Market Analysis, Insights and Forecast, 2019-2031
- 9.1. Market Analysis, Insights and Forecast - by Card Type
- 9.1.1. Ahlstrom 226
- 9.1.2. Whatman 903
- 9.1.3. FTA
- 9.1.4. Others
- 9.2. Market Analysis, Insights and Forecast - by Application
- 9.2.1. Infectious Disease Testing
- 9.2.2. Newborn Screening
- 9.2.3. Forensics
- 9.2.4. Therapeutic Drug Monitoring
- 9.2.5. Others
- 9.1. Market Analysis, Insights and Forecast - by Card Type
- 10. South America Dried Blood Spot Card Market Analysis, Insights and Forecast, 2019-2031
- 10.1. Market Analysis, Insights and Forecast - by Card Type
- 10.1.1. Ahlstrom 226
- 10.1.2. Whatman 903
- 10.1.3. FTA
- 10.1.4. Others
- 10.2. Market Analysis, Insights and Forecast - by Application
- 10.2.1. Infectious Disease Testing
- 10.2.2. Newborn Screening
- 10.2.3. Forensics
- 10.2.4. Therapeutic Drug Monitoring
- 10.2.5. Others
- 10.1. Market Analysis, Insights and Forecast - by Card Type
- 11. North America Dried Blood Spot Card Market Analysis, Insights and Forecast, 2019-2031
- 11.1. Market Analysis, Insights and Forecast - By Country/Sub-region
- 11.1.1 United States
- 11.1.2 Canada
- 11.1.3 Mexico
- 12. Europe Dried Blood Spot Card Market Analysis, Insights and Forecast, 2019-2031
- 12.1. Market Analysis, Insights and Forecast - By Country/Sub-region
- 12.1.1 Germany
- 12.1.2 United Kingdom
- 12.1.3 France
- 12.1.4 Italy
- 12.1.5 Spain
- 12.1.6 Rest of Europe
- 13. Asia Pacific Dried Blood Spot Card Market Analysis, Insights and Forecast, 2019-2031
- 13.1. Market Analysis, Insights and Forecast - By Country/Sub-region
- 13.1.1 China
- 13.1.2 Japan
- 13.1.3 India
- 13.1.4 Australia
- 13.1.5 South Korea
- 13.1.6 Rest of Asia Pacific
- 14. Middle East and Africa Dried Blood Spot Card Market Analysis, Insights and Forecast, 2019-2031
- 14.1. Market Analysis, Insights and Forecast - By Country/Sub-region
- 14.1.1 GCC
- 14.1.2 South Africa
- 14.1.3 Rest of Middle East and Africa
- 15. South America Dried Blood Spot Card Market Analysis, Insights and Forecast, 2019-2031
- 15.1. Market Analysis, Insights and Forecast - By Country/Sub-region
- 15.1.1 Brazil
- 15.1.2 Argentina
- 15.1.3 Rest of South America
- 16. Competitive Analysis
- 16.1. Global Market Share Analysis 2024
- 16.2. Company Profiles
- 16.2.1 Shimadzu Scientific Instruments
- 16.2.1.1. Overview
- 16.2.1.2. Products
- 16.2.1.3. SWOT Analysis
- 16.2.1.4. Recent Developments
- 16.2.1.5. Financials (Based on Availability)
- 16.2.2 Gentegra LLC
- 16.2.2.1. Overview
- 16.2.2.2. Products
- 16.2.2.3. SWOT Analysis
- 16.2.2.4. Recent Developments
- 16.2.2.5. Financials (Based on Availability)
- 16.2.3 CENTOGENE N V
- 16.2.3.1. Overview
- 16.2.3.2. Products
- 16.2.3.3. SWOT Analysis
- 16.2.3.4. Recent Developments
- 16.2.3.5. Financials (Based on Availability)
- 16.2.4 F Hoffmann-La Roche Ltd
- 16.2.4.1. Overview
- 16.2.4.2. Products
- 16.2.4.3. SWOT Analysis
- 16.2.4.4. Recent Developments
- 16.2.4.5. Financials (Based on Availability)
- 16.2.5 Thomas Scientific
- 16.2.5.1. Overview
- 16.2.5.2. Products
- 16.2.5.3. SWOT Analysis
- 16.2.5.4. Recent Developments
- 16.2.5.5. Financials (Based on Availability)
- 16.2.6 Hemaxis
- 16.2.6.1. Overview
- 16.2.6.2. Products
- 16.2.6.3. SWOT Analysis
- 16.2.6.4. Recent Developments
- 16.2.6.5. Financials (Based on Availability)
- 16.2.7 Lipomic Healthcare
- 16.2.7.1. Overview
- 16.2.7.2. Products
- 16.2.7.3. SWOT Analysis
- 16.2.7.4. Recent Developments
- 16.2.7.5. Financials (Based on Availability)
- 16.2.8 Eastern Business Forms Inc
- 16.2.8.1. Overview
- 16.2.8.2. Products
- 16.2.8.3. SWOT Analysis
- 16.2.8.4. Recent Developments
- 16.2.8.5. Financials (Based on Availability)
- 16.2.9 ARCHIMEDlife
- 16.2.9.1. Overview
- 16.2.9.2. Products
- 16.2.9.3. SWOT Analysis
- 16.2.9.4. Recent Developments
- 16.2.9.5. Financials (Based on Availability)
- 16.2.10 QIAGEN
- 16.2.10.1. Overview
- 16.2.10.2. Products
- 16.2.10.3. SWOT Analysis
- 16.2.10.4. Recent Developments
- 16.2.10.5. Financials (Based on Availability)
- 16.2.11 PerkinElmer
- 16.2.11.1. Overview
- 16.2.11.2. Products
- 16.2.11.3. SWOT Analysis
- 16.2.11.4. Recent Developments
- 16.2.11.5. Financials (Based on Availability)
- 16.2.12 Ahlstrom-Munksjö
- 16.2.12.1. Overview
- 16.2.12.2. Products
- 16.2.12.3. SWOT Analysis
- 16.2.12.4. Recent Developments
- 16.2.12.5. Financials (Based on Availability)
- 16.2.1 Shimadzu Scientific Instruments
List of Figures
- Figure 1: Global Dried Blood Spot Card Market Revenue Breakdown (Million, %) by Region 2024 & 2032
- Figure 2: Global Dried Blood Spot Card Market Volume Breakdown (K Unit, %) by Region 2024 & 2032
- Figure 3: North America Dried Blood Spot Card Market Revenue (Million), by Country 2024 & 2032
- Figure 4: North America Dried Blood Spot Card Market Volume (K Unit), by Country 2024 & 2032
- Figure 5: North America Dried Blood Spot Card Market Revenue Share (%), by Country 2024 & 2032
- Figure 6: North America Dried Blood Spot Card Market Volume Share (%), by Country 2024 & 2032
- Figure 7: Europe Dried Blood Spot Card Market Revenue (Million), by Country 2024 & 2032
- Figure 8: Europe Dried Blood Spot Card Market Volume (K Unit), by Country 2024 & 2032
- Figure 9: Europe Dried Blood Spot Card Market Revenue Share (%), by Country 2024 & 2032
- Figure 10: Europe Dried Blood Spot Card Market Volume Share (%), by Country 2024 & 2032
- Figure 11: Asia Pacific Dried Blood Spot Card Market Revenue (Million), by Country 2024 & 2032
- Figure 12: Asia Pacific Dried Blood Spot Card Market Volume (K Unit), by Country 2024 & 2032
- Figure 13: Asia Pacific Dried Blood Spot Card Market Revenue Share (%), by Country 2024 & 2032
- Figure 14: Asia Pacific Dried Blood Spot Card Market Volume Share (%), by Country 2024 & 2032
- Figure 15: Middle East and Africa Dried Blood Spot Card Market Revenue (Million), by Country 2024 & 2032
- Figure 16: Middle East and Africa Dried Blood Spot Card Market Volume (K Unit), by Country 2024 & 2032
- Figure 17: Middle East and Africa Dried Blood Spot Card Market Revenue Share (%), by Country 2024 & 2032
- Figure 18: Middle East and Africa Dried Blood Spot Card Market Volume Share (%), by Country 2024 & 2032
- Figure 19: South America Dried Blood Spot Card Market Revenue (Million), by Country 2024 & 2032
- Figure 20: South America Dried Blood Spot Card Market Volume (K Unit), by Country 2024 & 2032
- Figure 21: South America Dried Blood Spot Card Market Revenue Share (%), by Country 2024 & 2032
- Figure 22: South America Dried Blood Spot Card Market Volume Share (%), by Country 2024 & 2032
- Figure 23: North America Dried Blood Spot Card Market Revenue (Million), by Card Type 2024 & 2032
- Figure 24: North America Dried Blood Spot Card Market Volume (K Unit), by Card Type 2024 & 2032
- Figure 25: North America Dried Blood Spot Card Market Revenue Share (%), by Card Type 2024 & 2032
- Figure 26: North America Dried Blood Spot Card Market Volume Share (%), by Card Type 2024 & 2032
- Figure 27: North America Dried Blood Spot Card Market Revenue (Million), by Application 2024 & 2032
- Figure 28: North America Dried Blood Spot Card Market Volume (K Unit), by Application 2024 & 2032
- Figure 29: North America Dried Blood Spot Card Market Revenue Share (%), by Application 2024 & 2032
- Figure 30: North America Dried Blood Spot Card Market Volume Share (%), by Application 2024 & 2032
- Figure 31: North America Dried Blood Spot Card Market Revenue (Million), by Country 2024 & 2032
- Figure 32: North America Dried Blood Spot Card Market Volume (K Unit), by Country 2024 & 2032
- Figure 33: North America Dried Blood Spot Card Market Revenue Share (%), by Country 2024 & 2032
- Figure 34: North America Dried Blood Spot Card Market Volume Share (%), by Country 2024 & 2032
- Figure 35: Europe Dried Blood Spot Card Market Revenue (Million), by Card Type 2024 & 2032
- Figure 36: Europe Dried Blood Spot Card Market Volume (K Unit), by Card Type 2024 & 2032
- Figure 37: Europe Dried Blood Spot Card Market Revenue Share (%), by Card Type 2024 & 2032
- Figure 38: Europe Dried Blood Spot Card Market Volume Share (%), by Card Type 2024 & 2032
- Figure 39: Europe Dried Blood Spot Card Market Revenue (Million), by Application 2024 & 2032
- Figure 40: Europe Dried Blood Spot Card Market Volume (K Unit), by Application 2024 & 2032
- Figure 41: Europe Dried Blood Spot Card Market Revenue Share (%), by Application 2024 & 2032
- Figure 42: Europe Dried Blood Spot Card Market Volume Share (%), by Application 2024 & 2032
- Figure 43: Europe Dried Blood Spot Card Market Revenue (Million), by Country 2024 & 2032
- Figure 44: Europe Dried Blood Spot Card Market Volume (K Unit), by Country 2024 & 2032
- Figure 45: Europe Dried Blood Spot Card Market Revenue Share (%), by Country 2024 & 2032
- Figure 46: Europe Dried Blood Spot Card Market Volume Share (%), by Country 2024 & 2032
- Figure 47: Asia Pacific Dried Blood Spot Card Market Revenue (Million), by Card Type 2024 & 2032
- Figure 48: Asia Pacific Dried Blood Spot Card Market Volume (K Unit), by Card Type 2024 & 2032
- Figure 49: Asia Pacific Dried Blood Spot Card Market Revenue Share (%), by Card Type 2024 & 2032
- Figure 50: Asia Pacific Dried Blood Spot Card Market Volume Share (%), by Card Type 2024 & 2032
- Figure 51: Asia Pacific Dried Blood Spot Card Market Revenue (Million), by Application 2024 & 2032
- Figure 52: Asia Pacific Dried Blood Spot Card Market Volume (K Unit), by Application 2024 & 2032
- Figure 53: Asia Pacific Dried Blood Spot Card Market Revenue Share (%), by Application 2024 & 2032
- Figure 54: Asia Pacific Dried Blood Spot Card Market Volume Share (%), by Application 2024 & 2032
- Figure 55: Asia Pacific Dried Blood Spot Card Market Revenue (Million), by Country 2024 & 2032
- Figure 56: Asia Pacific Dried Blood Spot Card Market Volume (K Unit), by Country 2024 & 2032
- Figure 57: Asia Pacific Dried Blood Spot Card Market Revenue Share (%), by Country 2024 & 2032
- Figure 58: Asia Pacific Dried Blood Spot Card Market Volume Share (%), by Country 2024 & 2032
- Figure 59: Middle East and Africa Dried Blood Spot Card Market Revenue (Million), by Card Type 2024 & 2032
- Figure 60: Middle East and Africa Dried Blood Spot Card Market Volume (K Unit), by Card Type 2024 & 2032
- Figure 61: Middle East and Africa Dried Blood Spot Card Market Revenue Share (%), by Card Type 2024 & 2032
- Figure 62: Middle East and Africa Dried Blood Spot Card Market Volume Share (%), by Card Type 2024 & 2032
- Figure 63: Middle East and Africa Dried Blood Spot Card Market Revenue (Million), by Application 2024 & 2032
- Figure 64: Middle East and Africa Dried Blood Spot Card Market Volume (K Unit), by Application 2024 & 2032
- Figure 65: Middle East and Africa Dried Blood Spot Card Market Revenue Share (%), by Application 2024 & 2032
- Figure 66: Middle East and Africa Dried Blood Spot Card Market Volume Share (%), by Application 2024 & 2032
- Figure 67: Middle East and Africa Dried Blood Spot Card Market Revenue (Million), by Country 2024 & 2032
- Figure 68: Middle East and Africa Dried Blood Spot Card Market Volume (K Unit), by Country 2024 & 2032
- Figure 69: Middle East and Africa Dried Blood Spot Card Market Revenue Share (%), by Country 2024 & 2032
- Figure 70: Middle East and Africa Dried Blood Spot Card Market Volume Share (%), by Country 2024 & 2032
- Figure 71: South America Dried Blood Spot Card Market Revenue (Million), by Card Type 2024 & 2032
- Figure 72: South America Dried Blood Spot Card Market Volume (K Unit), by Card Type 2024 & 2032
- Figure 73: South America Dried Blood Spot Card Market Revenue Share (%), by Card Type 2024 & 2032
- Figure 74: South America Dried Blood Spot Card Market Volume Share (%), by Card Type 2024 & 2032
- Figure 75: South America Dried Blood Spot Card Market Revenue (Million), by Application 2024 & 2032
- Figure 76: South America Dried Blood Spot Card Market Volume (K Unit), by Application 2024 & 2032
- Figure 77: South America Dried Blood Spot Card Market Revenue Share (%), by Application 2024 & 2032
- Figure 78: South America Dried Blood Spot Card Market Volume Share (%), by Application 2024 & 2032
- Figure 79: South America Dried Blood Spot Card Market Revenue (Million), by Country 2024 & 2032
- Figure 80: South America Dried Blood Spot Card Market Volume (K Unit), by Country 2024 & 2032
- Figure 81: South America Dried Blood Spot Card Market Revenue Share (%), by Country 2024 & 2032
- Figure 82: South America Dried Blood Spot Card Market Volume Share (%), by Country 2024 & 2032
List of Tables
- Table 1: Global Dried Blood Spot Card Market Revenue Million Forecast, by Region 2019 & 2032
- Table 2: Global Dried Blood Spot Card Market Volume K Unit Forecast, by Region 2019 & 2032
- Table 3: Global Dried Blood Spot Card Market Revenue Million Forecast, by Card Type 2019 & 2032
- Table 4: Global Dried Blood Spot Card Market Volume K Unit Forecast, by Card Type 2019 & 2032
- Table 5: Global Dried Blood Spot Card Market Revenue Million Forecast, by Application 2019 & 2032
- Table 6: Global Dried Blood Spot Card Market Volume K Unit Forecast, by Application 2019 & 2032
- Table 7: Global Dried Blood Spot Card Market Revenue Million Forecast, by Region 2019 & 2032
- Table 8: Global Dried Blood Spot Card Market Volume K Unit Forecast, by Region 2019 & 2032
- Table 9: Global Dried Blood Spot Card Market Revenue Million Forecast, by Country 2019 & 2032
- Table 10: Global Dried Blood Spot Card Market Volume K Unit Forecast, by Country 2019 & 2032
- Table 11: United States Dried Blood Spot Card Market Revenue (Million) Forecast, by Application 2019 & 2032
- Table 12: United States Dried Blood Spot Card Market Volume (K Unit) Forecast, by Application 2019 & 2032
- Table 13: Canada Dried Blood Spot Card Market Revenue (Million) Forecast, by Application 2019 & 2032
- Table 14: Canada Dried Blood Spot Card Market Volume (K Unit) Forecast, by Application 2019 & 2032
- Table 15: Mexico Dried Blood Spot Card Market Revenue (Million) Forecast, by Application 2019 & 2032
- Table 16: Mexico Dried Blood Spot Card Market Volume (K Unit) Forecast, by Application 2019 & 2032
- Table 17: Global Dried Blood Spot Card Market Revenue Million Forecast, by Country 2019 & 2032
- Table 18: Global Dried Blood Spot Card Market Volume K Unit Forecast, by Country 2019 & 2032
- Table 19: Germany Dried Blood Spot Card Market Revenue (Million) Forecast, by Application 2019 & 2032
- Table 20: Germany Dried Blood Spot Card Market Volume (K Unit) Forecast, by Application 2019 & 2032
- Table 21: United Kingdom Dried Blood Spot Card Market Revenue (Million) Forecast, by Application 2019 & 2032
- Table 22: United Kingdom Dried Blood Spot Card Market Volume (K Unit) Forecast, by Application 2019 & 2032
- Table 23: France Dried Blood Spot Card Market Revenue (Million) Forecast, by Application 2019 & 2032
- Table 24: France Dried Blood Spot Card Market Volume (K Unit) Forecast, by Application 2019 & 2032
- Table 25: Italy Dried Blood Spot Card Market Revenue (Million) Forecast, by Application 2019 & 2032
- Table 26: Italy Dried Blood Spot Card Market Volume (K Unit) Forecast, by Application 2019 & 2032
- Table 27: Spain Dried Blood Spot Card Market Revenue (Million) Forecast, by Application 2019 & 2032
- Table 28: Spain Dried Blood Spot Card Market Volume (K Unit) Forecast, by Application 2019 & 2032
- Table 29: Rest of Europe Dried Blood Spot Card Market Revenue (Million) Forecast, by Application 2019 & 2032
- Table 30: Rest of Europe Dried Blood Spot Card Market Volume (K Unit) Forecast, by Application 2019 & 2032
- Table 31: Global Dried Blood Spot Card Market Revenue Million Forecast, by Country 2019 & 2032
- Table 32: Global Dried Blood Spot Card Market Volume K Unit Forecast, by Country 2019 & 2032
- Table 33: China Dried Blood Spot Card Market Revenue (Million) Forecast, by Application 2019 & 2032
- Table 34: China Dried Blood Spot Card Market Volume (K Unit) Forecast, by Application 2019 & 2032
- Table 35: Japan Dried Blood Spot Card Market Revenue (Million) Forecast, by Application 2019 & 2032
- Table 36: Japan Dried Blood Spot Card Market Volume (K Unit) Forecast, by Application 2019 & 2032
- Table 37: India Dried Blood Spot Card Market Revenue (Million) Forecast, by Application 2019 & 2032
- Table 38: India Dried Blood Spot Card Market Volume (K Unit) Forecast, by Application 2019 & 2032
- Table 39: Australia Dried Blood Spot Card Market Revenue (Million) Forecast, by Application 2019 & 2032
- Table 40: Australia Dried Blood Spot Card Market Volume (K Unit) Forecast, by Application 2019 & 2032
- Table 41: South Korea Dried Blood Spot Card Market Revenue (Million) Forecast, by Application 2019 & 2032
- Table 42: South Korea Dried Blood Spot Card Market Volume (K Unit) Forecast, by Application 2019 & 2032
- Table 43: Rest of Asia Pacific Dried Blood Spot Card Market Revenue (Million) Forecast, by Application 2019 & 2032
- Table 44: Rest of Asia Pacific Dried Blood Spot Card Market Volume (K Unit) Forecast, by Application 2019 & 2032
- Table 45: Global Dried Blood Spot Card Market Revenue Million Forecast, by Country 2019 & 2032
- Table 46: Global Dried Blood Spot Card Market Volume K Unit Forecast, by Country 2019 & 2032
- Table 47: GCC Dried Blood Spot Card Market Revenue (Million) Forecast, by Application 2019 & 2032
- Table 48: GCC Dried Blood Spot Card Market Volume (K Unit) Forecast, by Application 2019 & 2032
- Table 49: South Africa Dried Blood Spot Card Market Revenue (Million) Forecast, by Application 2019 & 2032
- Table 50: South Africa Dried Blood Spot Card Market Volume (K Unit) Forecast, by Application 2019 & 2032
- Table 51: Rest of Middle East and Africa Dried Blood Spot Card Market Revenue (Million) Forecast, by Application 2019 & 2032
- Table 52: Rest of Middle East and Africa Dried Blood Spot Card Market Volume (K Unit) Forecast, by Application 2019 & 2032
- Table 53: Global Dried Blood Spot Card Market Revenue Million Forecast, by Country 2019 & 2032
- Table 54: Global Dried Blood Spot Card Market Volume K Unit Forecast, by Country 2019 & 2032
- Table 55: Brazil Dried Blood Spot Card Market Revenue (Million) Forecast, by Application 2019 & 2032
- Table 56: Brazil Dried Blood Spot Card Market Volume (K Unit) Forecast, by Application 2019 & 2032
- Table 57: Argentina Dried Blood Spot Card Market Revenue (Million) Forecast, by Application 2019 & 2032
- Table 58: Argentina Dried Blood Spot Card Market Volume (K Unit) Forecast, by Application 2019 & 2032
- Table 59: Rest of South America Dried Blood Spot Card Market Revenue (Million) Forecast, by Application 2019 & 2032
- Table 60: Rest of South America Dried Blood Spot Card Market Volume (K Unit) Forecast, by Application 2019 & 2032
- Table 61: Global Dried Blood Spot Card Market Revenue Million Forecast, by Card Type 2019 & 2032
- Table 62: Global Dried Blood Spot Card Market Volume K Unit Forecast, by Card Type 2019 & 2032
- Table 63: Global Dried Blood Spot Card Market Revenue Million Forecast, by Application 2019 & 2032
- Table 64: Global Dried Blood Spot Card Market Volume K Unit Forecast, by Application 2019 & 2032
- Table 65: Global Dried Blood Spot Card Market Revenue Million Forecast, by Country 2019 & 2032
- Table 66: Global Dried Blood Spot Card Market Volume K Unit Forecast, by Country 2019 & 2032
- Table 67: United States Dried Blood Spot Card Market Revenue (Million) Forecast, by Application 2019 & 2032
- Table 68: United States Dried Blood Spot Card Market Volume (K Unit) Forecast, by Application 2019 & 2032
- Table 69: Canada Dried Blood Spot Card Market Revenue (Million) Forecast, by Application 2019 & 2032
- Table 70: Canada Dried Blood Spot Card Market Volume (K Unit) Forecast, by Application 2019 & 2032
- Table 71: Mexico Dried Blood Spot Card Market Revenue (Million) Forecast, by Application 2019 & 2032
- Table 72: Mexico Dried Blood Spot Card Market Volume (K Unit) Forecast, by Application 2019 & 2032
- Table 73: Global Dried Blood Spot Card Market Revenue Million Forecast, by Card Type 2019 & 2032
- Table 74: Global Dried Blood Spot Card Market Volume K Unit Forecast, by Card Type 2019 & 2032
- Table 75: Global Dried Blood Spot Card Market Revenue Million Forecast, by Application 2019 & 2032
- Table 76: Global Dried Blood Spot Card Market Volume K Unit Forecast, by Application 2019 & 2032
- Table 77: Global Dried Blood Spot Card Market Revenue Million Forecast, by Country 2019 & 2032
- Table 78: Global Dried Blood Spot Card Market Volume K Unit Forecast, by Country 2019 & 2032
- Table 79: Germany Dried Blood Spot Card Market Revenue (Million) Forecast, by Application 2019 & 2032
- Table 80: Germany Dried Blood Spot Card Market Volume (K Unit) Forecast, by Application 2019 & 2032
- Table 81: United Kingdom Dried Blood Spot Card Market Revenue (Million) Forecast, by Application 2019 & 2032
- Table 82: United Kingdom Dried Blood Spot Card Market Volume (K Unit) Forecast, by Application 2019 & 2032
- Table 83: France Dried Blood Spot Card Market Revenue (Million) Forecast, by Application 2019 & 2032
- Table 84: France Dried Blood Spot Card Market Volume (K Unit) Forecast, by Application 2019 & 2032
- Table 85: Italy Dried Blood Spot Card Market Revenue (Million) Forecast, by Application 2019 & 2032
- Table 86: Italy Dried Blood Spot Card Market Volume (K Unit) Forecast, by Application 2019 & 2032
- Table 87: Spain Dried Blood Spot Card Market Revenue (Million) Forecast, by Application 2019 & 2032
- Table 88: Spain Dried Blood Spot Card Market Volume (K Unit) Forecast, by Application 2019 & 2032
- Table 89: Rest of Europe Dried Blood Spot Card Market Revenue (Million) Forecast, by Application 2019 & 2032
- Table 90: Rest of Europe Dried Blood Spot Card Market Volume (K Unit) Forecast, by Application 2019 & 2032
- Table 91: Global Dried Blood Spot Card Market Revenue Million Forecast, by Card Type 2019 & 2032
- Table 92: Global Dried Blood Spot Card Market Volume K Unit Forecast, by Card Type 2019 & 2032
- Table 93: Global Dried Blood Spot Card Market Revenue Million Forecast, by Application 2019 & 2032
- Table 94: Global Dried Blood Spot Card Market Volume K Unit Forecast, by Application 2019 & 2032
- Table 95: Global Dried Blood Spot Card Market Revenue Million Forecast, by Country 2019 & 2032
- Table 96: Global Dried Blood Spot Card Market Volume K Unit Forecast, by Country 2019 & 2032
- Table 97: China Dried Blood Spot Card Market Revenue (Million) Forecast, by Application 2019 & 2032
- Table 98: China Dried Blood Spot Card Market Volume (K Unit) Forecast, by Application 2019 & 2032
- Table 99: Japan Dried Blood Spot Card Market Revenue (Million) Forecast, by Application 2019 & 2032
- Table 100: Japan Dried Blood Spot Card Market Volume (K Unit) Forecast, by Application 2019 & 2032
- Table 101: India Dried Blood Spot Card Market Revenue (Million) Forecast, by Application 2019 & 2032
- Table 102: India Dried Blood Spot Card Market Volume (K Unit) Forecast, by Application 2019 & 2032
- Table 103: Australia Dried Blood Spot Card Market Revenue (Million) Forecast, by Application 2019 & 2032
- Table 104: Australia Dried Blood Spot Card Market Volume (K Unit) Forecast, by Application 2019 & 2032
- Table 105: South Korea Dried Blood Spot Card Market Revenue (Million) Forecast, by Application 2019 & 2032
- Table 106: South Korea Dried Blood Spot Card Market Volume (K Unit) Forecast, by Application 2019 & 2032
- Table 107: Rest of Asia Pacific Dried Blood Spot Card Market Revenue (Million) Forecast, by Application 2019 & 2032
- Table 108: Rest of Asia Pacific Dried Blood Spot Card Market Volume (K Unit) Forecast, by Application 2019 & 2032
- Table 109: Global Dried Blood Spot Card Market Revenue Million Forecast, by Card Type 2019 & 2032
- Table 110: Global Dried Blood Spot Card Market Volume K Unit Forecast, by Card Type 2019 & 2032
- Table 111: Global Dried Blood Spot Card Market Revenue Million Forecast, by Application 2019 & 2032
- Table 112: Global Dried Blood Spot Card Market Volume K Unit Forecast, by Application 2019 & 2032
- Table 113: Global Dried Blood Spot Card Market Revenue Million Forecast, by Country 2019 & 2032
- Table 114: Global Dried Blood Spot Card Market Volume K Unit Forecast, by Country 2019 & 2032
- Table 115: GCC Dried Blood Spot Card Market Revenue (Million) Forecast, by Application 2019 & 2032
- Table 116: GCC Dried Blood Spot Card Market Volume (K Unit) Forecast, by Application 2019 & 2032
- Table 117: South Africa Dried Blood Spot Card Market Revenue (Million) Forecast, by Application 2019 & 2032
- Table 118: South Africa Dried Blood Spot Card Market Volume (K Unit) Forecast, by Application 2019 & 2032
- Table 119: Rest of Middle East and Africa Dried Blood Spot Card Market Revenue (Million) Forecast, by Application 2019 & 2032
- Table 120: Rest of Middle East and Africa Dried Blood Spot Card Market Volume (K Unit) Forecast, by Application 2019 & 2032
- Table 121: Global Dried Blood Spot Card Market Revenue Million Forecast, by Card Type 2019 & 2032
- Table 122: Global Dried Blood Spot Card Market Volume K Unit Forecast, by Card Type 2019 & 2032
- Table 123: Global Dried Blood Spot Card Market Revenue Million Forecast, by Application 2019 & 2032
- Table 124: Global Dried Blood Spot Card Market Volume K Unit Forecast, by Application 2019 & 2032
- Table 125: Global Dried Blood Spot Card Market Revenue Million Forecast, by Country 2019 & 2032
- Table 126: Global Dried Blood Spot Card Market Volume K Unit Forecast, by Country 2019 & 2032
- Table 127: Brazil Dried Blood Spot Card Market Revenue (Million) Forecast, by Application 2019 & 2032
- Table 128: Brazil Dried Blood Spot Card Market Volume (K Unit) Forecast, by Application 2019 & 2032
- Table 129: Argentina Dried Blood Spot Card Market Revenue (Million) Forecast, by Application 2019 & 2032
- Table 130: Argentina Dried Blood Spot Card Market Volume (K Unit) Forecast, by Application 2019 & 2032
- Table 131: Rest of South America Dried Blood Spot Card Market Revenue (Million) Forecast, by Application 2019 & 2032
- Table 132: Rest of South America Dried Blood Spot Card Market Volume (K Unit) Forecast, by Application 2019 & 2032
Frequently Asked Questions
1. What is the projected Compound Annual Growth Rate (CAGR) of the Dried Blood Spot Card Market?
The projected CAGR is approximately 3.10%.
2. Which companies are prominent players in the Dried Blood Spot Card Market?
Key companies in the market include Shimadzu Scientific Instruments, Gentegra LLC, CENTOGENE N V, F Hoffmann-La Roche Ltd, Thomas Scientific, Hemaxis, Lipomic Healthcare, Eastern Business Forms Inc, ARCHIMEDlife, QIAGEN, PerkinElmer, Ahlstrom-Munksjö.
3. What are the main segments of the Dried Blood Spot Card Market?
The market segments include Card Type, Application.
4. Can you provide details about the market size?
The market size is estimated to be USD XX Million as of 2022.
5. What are some drivers contributing to market growth?
Increasing Use of DBS Cards in Diagnostic Testing; Rise of Forensic Toxicology Applications.
6. What are the notable trends driving market growth?
Newborn Screening Segment is Expected to Witness Considerable Growth Over the Forecast Period.
7. Are there any restraints impacting market growth?
Contamination Caused in DBS Collection Cards.
8. Can you provide examples of recent developments in the market?
In August 2022, Boston Heart Diagnostics Corporation launched a broad range of tests with a dried blood spot collection for a broad range of applications including cardiovascular risk factors, type 2 diabetes, and wellness assessments for cognitive, nutritional, women's, and men's health.
9. What pricing options are available for accessing the report?
Pricing options include single-user, multi-user, and enterprise licenses priced at USD 4750, USD 5250, and USD 8750 respectively.
10. Is the market size provided in terms of value or volume?
The market size is provided in terms of value, measured in Million and volume, measured in K Unit.
11. Are there any specific market keywords associated with the report?
Yes, the market keyword associated with the report is "Dried Blood Spot Card Market," which aids in identifying and referencing the specific market segment covered.
12. How do I determine which pricing option suits my needs best?
The pricing options vary based on user requirements and access needs. Individual users may opt for single-user licenses, while businesses requiring broader access may choose multi-user or enterprise licenses for cost-effective access to the report.
13. Are there any additional resources or data provided in the Dried Blood Spot Card Market report?
While the report offers comprehensive insights, it's advisable to review the specific contents or supplementary materials provided to ascertain if additional resources or data are available.
14. How can I stay updated on further developments or reports in the Dried Blood Spot Card Market?
To stay informed about further developments, trends, and reports in the Dried Blood Spot Card Market, consider subscribing to industry newsletters, following relevant companies and organizations, or regularly checking reputable industry news sources and publications.
Methodology
Step 1 - Identification of Relevant Samples Size from Population Database


Step 2 - Approaches for Defining Global Market Size (Value, Volume* & Price*)

Note*: In applicable scenarios
Step 3 - Data Sources
Primary Research
- Web Analytics
- Survey Reports
- Research Institute
- Latest Research Reports
- Opinion Leaders
Secondary Research
- Annual Reports
- White Paper
- Latest Press Release
- Industry Association
- Paid Database
- Investor Presentations

Step 4 - Data Triangulation
Involves using different sources of information in order to increase the validity of a study
These sources are likely to be stakeholders in a program - participants, other researchers, program staff, other community members, and so on.
Then we put all data in single framework & apply various statistical tools to find out the dynamic on the market.
During the analysis stage, feedback from the stakeholder groups would be compared to determine areas of agreement as well as areas of divergence
