

Key Insights
The dissolved CO2 sensor market is experiencing robust growth, driven by increasing demand across diverse sectors. The market's expansion is fueled by several key factors, including the rising need for precise CO2 monitoring in environmental applications (water quality monitoring, oceanography, climate change research), the growing adoption of advanced sensors in industrial processes (fermentation, beverage production, aquaculture) for quality control and optimization, and the increasing awareness of CO2's impact on human health and productivity in indoor environments (HVAC systems, greenhouses). Technological advancements, such as the development of miniaturized, low-power, and cost-effective sensors, are further bolstering market growth. This trend is complemented by the emergence of wireless sensor networks and improved data analytics capabilities, facilitating real-time monitoring and remote management. While the market faces some challenges including the high initial investment costs associated with advanced sensor technology and the need for ongoing calibration and maintenance, the overall outlook remains positive, projecting strong growth over the forecast period.
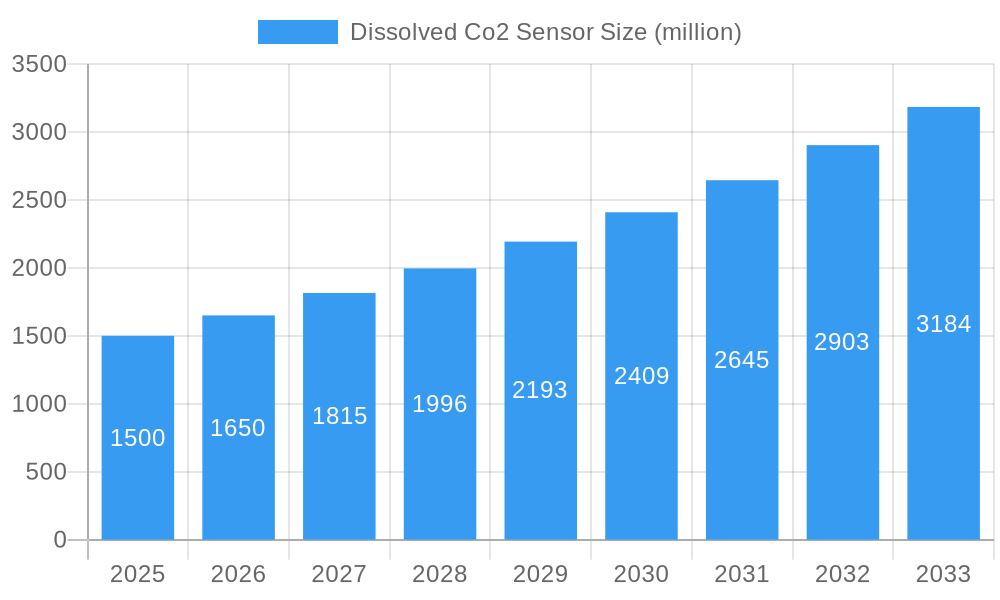
Dissolved Co2 Sensor Market Size (In Billion)
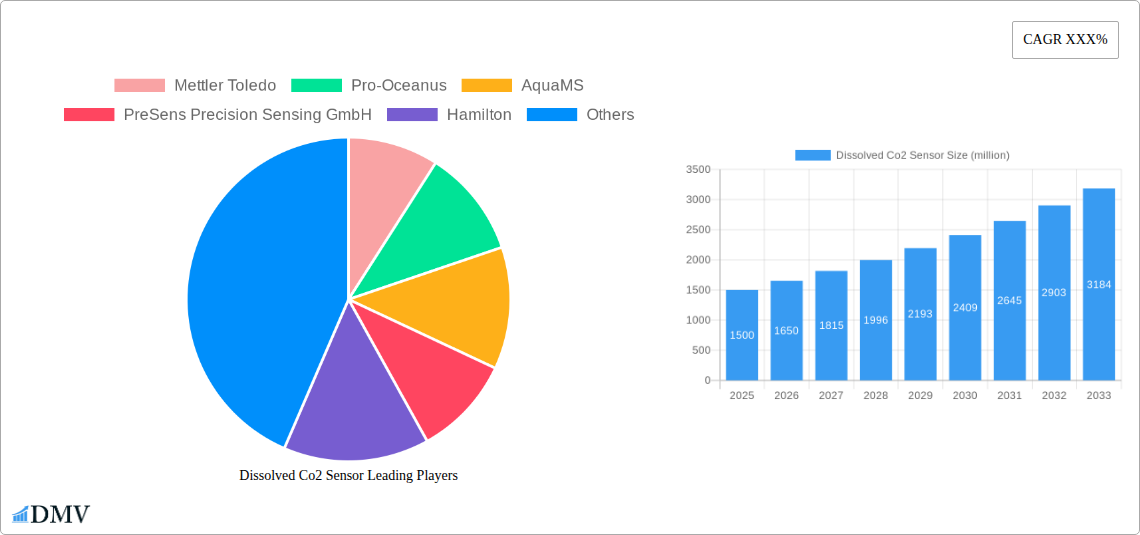
Competition in the dissolved CO2 sensor market is relatively fragmented, with several established players and emerging companies vying for market share. Companies like Mettler Toledo, Pro-Oceanus, AquaMS, PreSens Precision Sensing GmbH, Hamilton, Jiangsu SWR Science & Technology, and Vernier are key participants, offering a range of sensor technologies and solutions tailored to specific applications. The market is characterized by ongoing innovation in sensor design, materials, and data processing techniques. The focus is shifting towards developing more accurate, reliable, and user-friendly devices capable of integrating seamlessly with existing monitoring systems. Future growth will likely be influenced by the adoption of new regulations concerning water quality and environmental monitoring, along with the continued expansion of the Internet of Things (IoT) and smart agriculture. These factors will propel the demand for sophisticated, networked dissolved CO2 sensors capable of delivering real-time data for informed decision-making across various industries.
Dissolved Co2 Sensor Company Market Share
Dissolved CO2 Sensor Market Report: A Comprehensive Analysis (2019-2033)
This insightful report delivers a comprehensive analysis of the global dissolved CO2 sensor market, projecting a market valuation exceeding $XX million by 2033. The study covers the historical period (2019-2024), the base year (2025), and forecasts the market's trajectory from 2025 to 2033. Key players like Mettler Toledo, Pro-Oceanus, AquaMS, PreSens Precision Sensing GmbH, Hamilton, Jiangsu SWR Science & Technology, and Vernier are analyzed, revealing market dynamics, growth drivers, and emerging opportunities within this rapidly evolving sector.
Dissolved CO2 Sensor Market Composition & Trends
This section provides a detailed overview of the dissolved CO2 sensor market, examining its current state and future projections. The market is characterized by a moderately concentrated landscape, with the top five players holding an estimated XX% market share in 2025. However, the emergence of innovative technologies and new entrants is anticipated to increase competition in the coming years.
Market Concentration & Innovation:
- Market concentration (2025): Top 5 players hold XX% market share.
- Innovation catalysts: Miniaturization, improved accuracy, wireless connectivity, and integration with IoT platforms.
- Regulatory landscape: Stringent environmental regulations driving adoption, particularly in water treatment and environmental monitoring sectors.
- Substitute products: Limited viable substitutes; the unique capabilities of dissolved CO2 sensors solidify market demand.
- End-user profiles: Predominantly industrial (water treatment, brewing, beverage), scientific research, and environmental monitoring sectors. The healthcare segment is also showing increasing adoption.
- M&A activities: Significant M&A activity observed during the historical period (2019-2024), totaling approximately $XX million in deal value. This activity is predicted to continue, driving consolidation within the market.
Dissolved CO2 Sensor Industry Evolution
The dissolved CO2 sensor market has experienced robust growth over the past five years, exhibiting a Compound Annual Growth Rate (CAGR) of XX% from 2019 to 2024. This growth is primarily attributed to several key factors: increasing demand from diverse end-user industries, technological advancements leading to enhanced sensor performance and affordability, and rising environmental concerns driving stricter regulations for CO2 monitoring. The market is expected to maintain a significant growth trajectory during the forecast period (2025-2033), driven by the increasing adoption of advanced sensors in various sectors. We project a CAGR of XX% for the forecast period, reaching a market value exceeding $XX million by 2033. The adoption rate of advanced features like wireless connectivity and IoT integration is expected to increase by XX% annually during the forecast period.
Leading Regions, Countries, or Segments in Dissolved CO2 Sensor
The North American region currently dominates the global dissolved CO2 sensor market, driven by robust investments in research and development, stringent environmental regulations, and the presence of key market players.
Key Drivers for North American Dominance:
- High investments in environmental monitoring and water treatment infrastructure.
- Strong government support and favorable regulatory frameworks.
- Presence of established players and significant R&D activity.
Other Regions:
While North America leads, the Asia-Pacific region is projected to experience the fastest growth in the coming years, driven by rapid industrialization, increasing environmental awareness, and burgeoning economies. Europe also exhibits steady growth, particularly within the chemical and beverage industries.
Dissolved CO2 Sensor Product Innovations
Recent innovations in dissolved CO2 sensor technology have focused on enhancing accuracy, miniaturization, and ease of use. Advances in micro-electromechanical systems (MEMS) technology have enabled the development of smaller, more cost-effective sensors. The integration of wireless connectivity and cloud-based data analysis platforms is transforming data management and real-time monitoring capabilities. These innovations are driving broader adoption across various sectors. New sensor designs incorporating advanced materials and signal processing techniques have significantly improved measurement accuracy and reduced response time.
Propelling Factors for Dissolved Co2 Sensor Growth
The growth of the dissolved CO2 sensor market is propelled by a confluence of factors. Stringent environmental regulations worldwide are mandating CO2 monitoring in various industries. The rising demand for precise CO2 measurement in industrial processes (e.g., fermentation, brewing, water treatment) is driving market expansion. Technological advancements in sensor design are leading to increased accuracy, improved durability, and reduced costs, further fueling market growth. Furthermore, the increasing integration of these sensors with IoT platforms offers improved data management and remote monitoring capabilities.
Obstacles in the Dissolved Co2 Sensor Market
Despite considerable growth potential, the market faces challenges. The high initial investment costs associated with advanced sensors can be a barrier to entry for smaller companies. Supply chain disruptions related to raw materials can impact sensor production and availability. Intense competition among established players and the emergence of new technologies can exert pressure on profit margins. Furthermore, variations in regulatory frameworks across different regions could create complexities for manufacturers aiming for global market penetration.
Future Opportunities in Dissolved Co2 Sensor
Emerging opportunities lie in the development of miniaturized and low-cost sensors for widespread applications. The integration of dissolved CO2 sensors with other environmental sensors, creating comprehensive monitoring systems, holds significant potential. Expansion into new markets, including healthcare and precision agriculture, presents lucrative avenues for growth. The growing need for real-time monitoring solutions in various industrial settings is likely to drive innovation and adoption of advanced sensor technologies.
Major Players in the Dissolved Co2 Sensor Ecosystem
- Mettler Toledo
- Pro-Oceanus
- AquaMS
- PreSens Precision Sensing GmbH
- Hamilton
- Jiangsu SWR Science & Technology
- Vernier
Key Developments in Dissolved Co2 Sensor Industry
- 2022 Q3: Mettler Toledo launched a new line of high-precision dissolved CO2 sensors with improved accuracy and stability.
- 2023 Q1: PreSens Precision Sensing GmbH announced a partnership with a major water treatment company to integrate its sensors into a large-scale water purification project.
- 2024 Q4: A significant merger between two smaller dissolved CO2 sensor manufacturers resulted in increased market consolidation. (Further details of mergers and acquisitions will be available in the full report)
Strategic Dissolved Co2 Sensor Market Forecast
The dissolved CO2 sensor market is poised for substantial growth in the coming years. Driven by technological advancements, rising environmental awareness, and increasing demand from various sectors, the market is projected to experience robust expansion. The integration of IoT, AI and advanced analytics will further enhance the value proposition of these sensors and accelerate market growth. The continued development of miniaturized, cost-effective, and high-precision sensors will unlock new applications and further expand the market's reach, solidifying its importance in numerous sectors.
Dissolved Co2 Sensor Segmentation
-
1. Application
- 1.1. Pharmaceutical
- 1.2. Life Sciences
- 1.3. Food and Drink
- 1.4. Aquaculture
- 1.5. Scientific Research
- 1.6. Others
-
2. Type
- 2.1. Potentiometric
- 2.2. Thermal Conductivity
- 2.3. Infrared Optics
Dissolved Co2 Sensor Segmentation By Geography
-
1. North America
- 1.1. United States
- 1.2. Canada
- 1.3. Mexico
-
2. South America
- 2.1. Brazil
- 2.2. Argentina
- 2.3. Rest of South America
-
3. Europe
- 3.1. United Kingdom
- 3.2. Germany
- 3.3. France
- 3.4. Italy
- 3.5. Spain
- 3.6. Russia
- 3.7. Benelux
- 3.8. Nordics
- 3.9. Rest of Europe
-
4. Middle East & Africa
- 4.1. Turkey
- 4.2. Israel
- 4.3. GCC
- 4.4. North Africa
- 4.5. South Africa
- 4.6. Rest of Middle East & Africa
-
5. Asia Pacific
- 5.1. China
- 5.2. India
- 5.3. Japan
- 5.4. South Korea
- 5.5. ASEAN
- 5.6. Oceania
- 5.7. Rest of Asia Pacific

Dissolved Co2 Sensor Regional Market Share
Geographic Coverage of Dissolved Co2 Sensor
Dissolved Co2 Sensor REPORT HIGHLIGHTS
| Aspects | Details |
|---|---|
| Study Period | 2020-2034 |
| Base Year | 2025 |
| Estimated Year | 2026 |
| Forecast Period | 2026-2034 |
| Historical Period | 2020-2025 |
| Growth Rate | CAGR of XXX% from 2020-2034 |
| Segmentation |
|
Table of Contents
- 1. Introduction
- 1.1. Research Scope
- 1.2. Market Segmentation
- 1.3. Research Objective
- 1.4. Definitions and Assumptions
- 2. Executive Summary
- 2.1. Market Snapshot
- 3. Market Dynamics
- 3.1. Market Drivers
- 3.2. Market Restrains
- 3.3. Market Trends
- 3.4. Market Opportunities
- 4. Market Factor Analysis
- 4.1. Porters Five Forces
- 4.1.1. Bargaining Power of Suppliers
- 4.1.2. Bargaining Power of Buyers
- 4.1.3. Threat of New Entrants
- 4.1.4. Threat of Substitutes
- 4.1.5. Competitive Rivalry
- 4.2. PESTEL analysis
- 4.3. BCG Analysis
- 4.3.1. Stars (High Growth, High Market Share)
- 4.3.2. Cash Cows (Low Growth, High Market Share)
- 4.3.3. Question Mark (High Growth, Low Market Share)
- 4.3.4. Dogs (Low Growth, Low Market Share)
- 4.4. Ansoff Matrix Analysis
- 4.5. Supply Chain Analysis
- 4.6. Regulatory Landscape
- 4.7. Current Market Potential and Opportunity Assessment (TAM–SAM–SOM Framework)
- 4.8. DMV Analyst Note
- 4.1. Porters Five Forces
- 5. Market Analysis, Insights and Forecast 2021-2033
- 5.1. Market Analysis, Insights and Forecast - by Application
- 5.1.1. Pharmaceutical
- 5.1.2. Life Sciences
- 5.1.3. Food and Drink
- 5.1.4. Aquaculture
- 5.1.5. Scientific Research
- 5.1.6. Others
- 5.2. Market Analysis, Insights and Forecast - by Type
- 5.2.1. Potentiometric
- 5.2.2. Thermal Conductivity
- 5.2.3. Infrared Optics
- 5.3. Market Analysis, Insights and Forecast - by Region
- 5.3.1. North America
- 5.3.2. South America
- 5.3.3. Europe
- 5.3.4. Middle East & Africa
- 5.3.5. Asia Pacific
- 5.1. Market Analysis, Insights and Forecast - by Application
- 6. Global Dissolved Co2 Sensor Analysis, Insights and Forecast, 2021-2033
- 6.1. Market Analysis, Insights and Forecast - by Application
- 6.1.1. Pharmaceutical
- 6.1.2. Life Sciences
- 6.1.3. Food and Drink
- 6.1.4. Aquaculture
- 6.1.5. Scientific Research
- 6.1.6. Others
- 6.2. Market Analysis, Insights and Forecast - by Type
- 6.2.1. Potentiometric
- 6.2.2. Thermal Conductivity
- 6.2.3. Infrared Optics
- 6.1. Market Analysis, Insights and Forecast - by Application
- 7. North America Dissolved Co2 Sensor Analysis, Insights and Forecast, 2020-2032
- 7.1. Market Analysis, Insights and Forecast - by Application
- 7.1.1. Pharmaceutical
- 7.1.2. Life Sciences
- 7.1.3. Food and Drink
- 7.1.4. Aquaculture
- 7.1.5. Scientific Research
- 7.1.6. Others
- 7.2. Market Analysis, Insights and Forecast - by Type
- 7.2.1. Potentiometric
- 7.2.2. Thermal Conductivity
- 7.2.3. Infrared Optics
- 7.1. Market Analysis, Insights and Forecast - by Application
- 8. South America Dissolved Co2 Sensor Analysis, Insights and Forecast, 2020-2032
- 8.1. Market Analysis, Insights and Forecast - by Application
- 8.1.1. Pharmaceutical
- 8.1.2. Life Sciences
- 8.1.3. Food and Drink
- 8.1.4. Aquaculture
- 8.1.5. Scientific Research
- 8.1.6. Others
- 8.2. Market Analysis, Insights and Forecast - by Type
- 8.2.1. Potentiometric
- 8.2.2. Thermal Conductivity
- 8.2.3. Infrared Optics
- 8.1. Market Analysis, Insights and Forecast - by Application
- 9. Europe Dissolved Co2 Sensor Analysis, Insights and Forecast, 2020-2032
- 9.1. Market Analysis, Insights and Forecast - by Application
- 9.1.1. Pharmaceutical
- 9.1.2. Life Sciences
- 9.1.3. Food and Drink
- 9.1.4. Aquaculture
- 9.1.5. Scientific Research
- 9.1.6. Others
- 9.2. Market Analysis, Insights and Forecast - by Type
- 9.2.1. Potentiometric
- 9.2.2. Thermal Conductivity
- 9.2.3. Infrared Optics
- 9.1. Market Analysis, Insights and Forecast - by Application
- 10. Middle East & Africa Dissolved Co2 Sensor Analysis, Insights and Forecast, 2020-2032
- 10.1. Market Analysis, Insights and Forecast - by Application
- 10.1.1. Pharmaceutical
- 10.1.2. Life Sciences
- 10.1.3. Food and Drink
- 10.1.4. Aquaculture
- 10.1.5. Scientific Research
- 10.1.6. Others
- 10.2. Market Analysis, Insights and Forecast - by Type
- 10.2.1. Potentiometric
- 10.2.2. Thermal Conductivity
- 10.2.3. Infrared Optics
- 10.1. Market Analysis, Insights and Forecast - by Application
- 11. Asia Pacific Dissolved Co2 Sensor Analysis, Insights and Forecast, 2020-2032
- 11.1. Market Analysis, Insights and Forecast - by Application
- 11.1.1. Pharmaceutical
- 11.1.2. Life Sciences
- 11.1.3. Food and Drink
- 11.1.4. Aquaculture
- 11.1.5. Scientific Research
- 11.1.6. Others
- 11.2. Market Analysis, Insights and Forecast - by Type
- 11.2.1. Potentiometric
- 11.2.2. Thermal Conductivity
- 11.2.3. Infrared Optics
- 11.1. Market Analysis, Insights and Forecast - by Application
- 12. Competitive Analysis
- 12.1. Company Profiles
- 12.1.1 Mettler Toledo
- 12.1.1.1. Company Overview
- 12.1.1.2. Products
- 12.1.1.3. Company Financials
- 12.1.1.4. SWOT Analysis
- 12.1.2 Pro-Oceanus
- 12.1.2.1. Company Overview
- 12.1.2.2. Products
- 12.1.2.3. Company Financials
- 12.1.2.4. SWOT Analysis
- 12.1.3 AquaMS
- 12.1.3.1. Company Overview
- 12.1.3.2. Products
- 12.1.3.3. Company Financials
- 12.1.3.4. SWOT Analysis
- 12.1.4 PreSens Precision Sensing GmbH
- 12.1.4.1. Company Overview
- 12.1.4.2. Products
- 12.1.4.3. Company Financials
- 12.1.4.4. SWOT Analysis
- 12.1.5 Hamilton
- 12.1.5.1. Company Overview
- 12.1.5.2. Products
- 12.1.5.3. Company Financials
- 12.1.5.4. SWOT Analysis
- 12.1.6 Jiangsu SWR Science & Technology
- 12.1.6.1. Company Overview
- 12.1.6.2. Products
- 12.1.6.3. Company Financials
- 12.1.6.4. SWOT Analysis
- 12.1.7 Vernier
- 12.1.7.1. Company Overview
- 12.1.7.2. Products
- 12.1.7.3. Company Financials
- 12.1.7.4. SWOT Analysis
- 12.1.1 Mettler Toledo
- 12.2. Market Entropy
- 12.2.1 Company's Key Areas Served
- 12.2.2 Recent Developments
- 12.3. Company Market Share Analysis 2025
- 12.3.1 Top 5 Companies Market Share Analysis
- 12.3.2 Top 3 Companies Market Share Analysis
- 12.4. List of Potential Customers
- 13. Research Methodology
List of Figures
- Figure 1: Global Dissolved Co2 Sensor Revenue Breakdown (million, %) by Region 2025 & 2033
- Figure 2: Global Dissolved Co2 Sensor Volume Breakdown (K, %) by Region 2025 & 2033
- Figure 3: North America Dissolved Co2 Sensor Revenue (million), by Application 2025 & 2033
- Figure 4: North America Dissolved Co2 Sensor Volume (K), by Application 2025 & 2033
- Figure 5: North America Dissolved Co2 Sensor Revenue Share (%), by Application 2025 & 2033
- Figure 6: North America Dissolved Co2 Sensor Volume Share (%), by Application 2025 & 2033
- Figure 7: North America Dissolved Co2 Sensor Revenue (million), by Type 2025 & 2033
- Figure 8: North America Dissolved Co2 Sensor Volume (K), by Type 2025 & 2033
- Figure 9: North America Dissolved Co2 Sensor Revenue Share (%), by Type 2025 & 2033
- Figure 10: North America Dissolved Co2 Sensor Volume Share (%), by Type 2025 & 2033
- Figure 11: North America Dissolved Co2 Sensor Revenue (million), by Country 2025 & 2033
- Figure 12: North America Dissolved Co2 Sensor Volume (K), by Country 2025 & 2033
- Figure 13: North America Dissolved Co2 Sensor Revenue Share (%), by Country 2025 & 2033
- Figure 14: North America Dissolved Co2 Sensor Volume Share (%), by Country 2025 & 2033
- Figure 15: South America Dissolved Co2 Sensor Revenue (million), by Application 2025 & 2033
- Figure 16: South America Dissolved Co2 Sensor Volume (K), by Application 2025 & 2033
- Figure 17: South America Dissolved Co2 Sensor Revenue Share (%), by Application 2025 & 2033
- Figure 18: South America Dissolved Co2 Sensor Volume Share (%), by Application 2025 & 2033
- Figure 19: South America Dissolved Co2 Sensor Revenue (million), by Type 2025 & 2033
- Figure 20: South America Dissolved Co2 Sensor Volume (K), by Type 2025 & 2033
- Figure 21: South America Dissolved Co2 Sensor Revenue Share (%), by Type 2025 & 2033
- Figure 22: South America Dissolved Co2 Sensor Volume Share (%), by Type 2025 & 2033
- Figure 23: South America Dissolved Co2 Sensor Revenue (million), by Country 2025 & 2033
- Figure 24: South America Dissolved Co2 Sensor Volume (K), by Country 2025 & 2033
- Figure 25: South America Dissolved Co2 Sensor Revenue Share (%), by Country 2025 & 2033
- Figure 26: South America Dissolved Co2 Sensor Volume Share (%), by Country 2025 & 2033
- Figure 27: Europe Dissolved Co2 Sensor Revenue (million), by Application 2025 & 2033
- Figure 28: Europe Dissolved Co2 Sensor Volume (K), by Application 2025 & 2033
- Figure 29: Europe Dissolved Co2 Sensor Revenue Share (%), by Application 2025 & 2033
- Figure 30: Europe Dissolved Co2 Sensor Volume Share (%), by Application 2025 & 2033
- Figure 31: Europe Dissolved Co2 Sensor Revenue (million), by Type 2025 & 2033
- Figure 32: Europe Dissolved Co2 Sensor Volume (K), by Type 2025 & 2033
- Figure 33: Europe Dissolved Co2 Sensor Revenue Share (%), by Type 2025 & 2033
- Figure 34: Europe Dissolved Co2 Sensor Volume Share (%), by Type 2025 & 2033
- Figure 35: Europe Dissolved Co2 Sensor Revenue (million), by Country 2025 & 2033
- Figure 36: Europe Dissolved Co2 Sensor Volume (K), by Country 2025 & 2033
- Figure 37: Europe Dissolved Co2 Sensor Revenue Share (%), by Country 2025 & 2033
- Figure 38: Europe Dissolved Co2 Sensor Volume Share (%), by Country 2025 & 2033
- Figure 39: Middle East & Africa Dissolved Co2 Sensor Revenue (million), by Application 2025 & 2033
- Figure 40: Middle East & Africa Dissolved Co2 Sensor Volume (K), by Application 2025 & 2033
- Figure 41: Middle East & Africa Dissolved Co2 Sensor Revenue Share (%), by Application 2025 & 2033
- Figure 42: Middle East & Africa Dissolved Co2 Sensor Volume Share (%), by Application 2025 & 2033
- Figure 43: Middle East & Africa Dissolved Co2 Sensor Revenue (million), by Type 2025 & 2033
- Figure 44: Middle East & Africa Dissolved Co2 Sensor Volume (K), by Type 2025 & 2033
- Figure 45: Middle East & Africa Dissolved Co2 Sensor Revenue Share (%), by Type 2025 & 2033
- Figure 46: Middle East & Africa Dissolved Co2 Sensor Volume Share (%), by Type 2025 & 2033
- Figure 47: Middle East & Africa Dissolved Co2 Sensor Revenue (million), by Country 2025 & 2033
- Figure 48: Middle East & Africa Dissolved Co2 Sensor Volume (K), by Country 2025 & 2033
- Figure 49: Middle East & Africa Dissolved Co2 Sensor Revenue Share (%), by Country 2025 & 2033
- Figure 50: Middle East & Africa Dissolved Co2 Sensor Volume Share (%), by Country 2025 & 2033
- Figure 51: Asia Pacific Dissolved Co2 Sensor Revenue (million), by Application 2025 & 2033
- Figure 52: Asia Pacific Dissolved Co2 Sensor Volume (K), by Application 2025 & 2033
- Figure 53: Asia Pacific Dissolved Co2 Sensor Revenue Share (%), by Application 2025 & 2033
- Figure 54: Asia Pacific Dissolved Co2 Sensor Volume Share (%), by Application 2025 & 2033
- Figure 55: Asia Pacific Dissolved Co2 Sensor Revenue (million), by Type 2025 & 2033
- Figure 56: Asia Pacific Dissolved Co2 Sensor Volume (K), by Type 2025 & 2033
- Figure 57: Asia Pacific Dissolved Co2 Sensor Revenue Share (%), by Type 2025 & 2033
- Figure 58: Asia Pacific Dissolved Co2 Sensor Volume Share (%), by Type 2025 & 2033
- Figure 59: Asia Pacific Dissolved Co2 Sensor Revenue (million), by Country 2025 & 2033
- Figure 60: Asia Pacific Dissolved Co2 Sensor Volume (K), by Country 2025 & 2033
- Figure 61: Asia Pacific Dissolved Co2 Sensor Revenue Share (%), by Country 2025 & 2033
- Figure 62: Asia Pacific Dissolved Co2 Sensor Volume Share (%), by Country 2025 & 2033
List of Tables
- Table 1: Global Dissolved Co2 Sensor Revenue million Forecast, by Application 2020 & 2033
- Table 2: Global Dissolved Co2 Sensor Volume K Forecast, by Application 2020 & 2033
- Table 3: Global Dissolved Co2 Sensor Revenue million Forecast, by Type 2020 & 2033
- Table 4: Global Dissolved Co2 Sensor Volume K Forecast, by Type 2020 & 2033
- Table 5: Global Dissolved Co2 Sensor Revenue million Forecast, by Region 2020 & 2033
- Table 6: Global Dissolved Co2 Sensor Volume K Forecast, by Region 2020 & 2033
- Table 7: Global Dissolved Co2 Sensor Revenue million Forecast, by Application 2020 & 2033
- Table 8: Global Dissolved Co2 Sensor Volume K Forecast, by Application 2020 & 2033
- Table 9: Global Dissolved Co2 Sensor Revenue million Forecast, by Type 2020 & 2033
- Table 10: Global Dissolved Co2 Sensor Volume K Forecast, by Type 2020 & 2033
- Table 11: Global Dissolved Co2 Sensor Revenue million Forecast, by Country 2020 & 2033
- Table 12: Global Dissolved Co2 Sensor Volume K Forecast, by Country 2020 & 2033
- Table 13: United States Dissolved Co2 Sensor Revenue (million) Forecast, by Application 2020 & 2033
- Table 14: United States Dissolved Co2 Sensor Volume (K) Forecast, by Application 2020 & 2033
- Table 15: Canada Dissolved Co2 Sensor Revenue (million) Forecast, by Application 2020 & 2033
- Table 16: Canada Dissolved Co2 Sensor Volume (K) Forecast, by Application 2020 & 2033
- Table 17: Mexico Dissolved Co2 Sensor Revenue (million) Forecast, by Application 2020 & 2033
- Table 18: Mexico Dissolved Co2 Sensor Volume (K) Forecast, by Application 2020 & 2033
- Table 19: Global Dissolved Co2 Sensor Revenue million Forecast, by Application 2020 & 2033
- Table 20: Global Dissolved Co2 Sensor Volume K Forecast, by Application 2020 & 2033
- Table 21: Global Dissolved Co2 Sensor Revenue million Forecast, by Type 2020 & 2033
- Table 22: Global Dissolved Co2 Sensor Volume K Forecast, by Type 2020 & 2033
- Table 23: Global Dissolved Co2 Sensor Revenue million Forecast, by Country 2020 & 2033
- Table 24: Global Dissolved Co2 Sensor Volume K Forecast, by Country 2020 & 2033
- Table 25: Brazil Dissolved Co2 Sensor Revenue (million) Forecast, by Application 2020 & 2033
- Table 26: Brazil Dissolved Co2 Sensor Volume (K) Forecast, by Application 2020 & 2033
- Table 27: Argentina Dissolved Co2 Sensor Revenue (million) Forecast, by Application 2020 & 2033
- Table 28: Argentina Dissolved Co2 Sensor Volume (K) Forecast, by Application 2020 & 2033
- Table 29: Rest of South America Dissolved Co2 Sensor Revenue (million) Forecast, by Application 2020 & 2033
- Table 30: Rest of South America Dissolved Co2 Sensor Volume (K) Forecast, by Application 2020 & 2033
- Table 31: Global Dissolved Co2 Sensor Revenue million Forecast, by Application 2020 & 2033
- Table 32: Global Dissolved Co2 Sensor Volume K Forecast, by Application 2020 & 2033
- Table 33: Global Dissolved Co2 Sensor Revenue million Forecast, by Type 2020 & 2033
- Table 34: Global Dissolved Co2 Sensor Volume K Forecast, by Type 2020 & 2033
- Table 35: Global Dissolved Co2 Sensor Revenue million Forecast, by Country 2020 & 2033
- Table 36: Global Dissolved Co2 Sensor Volume K Forecast, by Country 2020 & 2033
- Table 37: United Kingdom Dissolved Co2 Sensor Revenue (million) Forecast, by Application 2020 & 2033
- Table 38: United Kingdom Dissolved Co2 Sensor Volume (K) Forecast, by Application 2020 & 2033
- Table 39: Germany Dissolved Co2 Sensor Revenue (million) Forecast, by Application 2020 & 2033
- Table 40: Germany Dissolved Co2 Sensor Volume (K) Forecast, by Application 2020 & 2033
- Table 41: France Dissolved Co2 Sensor Revenue (million) Forecast, by Application 2020 & 2033
- Table 42: France Dissolved Co2 Sensor Volume (K) Forecast, by Application 2020 & 2033
- Table 43: Italy Dissolved Co2 Sensor Revenue (million) Forecast, by Application 2020 & 2033
- Table 44: Italy Dissolved Co2 Sensor Volume (K) Forecast, by Application 2020 & 2033
- Table 45: Spain Dissolved Co2 Sensor Revenue (million) Forecast, by Application 2020 & 2033
- Table 46: Spain Dissolved Co2 Sensor Volume (K) Forecast, by Application 2020 & 2033
- Table 47: Russia Dissolved Co2 Sensor Revenue (million) Forecast, by Application 2020 & 2033
- Table 48: Russia Dissolved Co2 Sensor Volume (K) Forecast, by Application 2020 & 2033
- Table 49: Benelux Dissolved Co2 Sensor Revenue (million) Forecast, by Application 2020 & 2033
- Table 50: Benelux Dissolved Co2 Sensor Volume (K) Forecast, by Application 2020 & 2033
- Table 51: Nordics Dissolved Co2 Sensor Revenue (million) Forecast, by Application 2020 & 2033
- Table 52: Nordics Dissolved Co2 Sensor Volume (K) Forecast, by Application 2020 & 2033
- Table 53: Rest of Europe Dissolved Co2 Sensor Revenue (million) Forecast, by Application 2020 & 2033
- Table 54: Rest of Europe Dissolved Co2 Sensor Volume (K) Forecast, by Application 2020 & 2033
- Table 55: Global Dissolved Co2 Sensor Revenue million Forecast, by Application 2020 & 2033
- Table 56: Global Dissolved Co2 Sensor Volume K Forecast, by Application 2020 & 2033
- Table 57: Global Dissolved Co2 Sensor Revenue million Forecast, by Type 2020 & 2033
- Table 58: Global Dissolved Co2 Sensor Volume K Forecast, by Type 2020 & 2033
- Table 59: Global Dissolved Co2 Sensor Revenue million Forecast, by Country 2020 & 2033
- Table 60: Global Dissolved Co2 Sensor Volume K Forecast, by Country 2020 & 2033
- Table 61: Turkey Dissolved Co2 Sensor Revenue (million) Forecast, by Application 2020 & 2033
- Table 62: Turkey Dissolved Co2 Sensor Volume (K) Forecast, by Application 2020 & 2033
- Table 63: Israel Dissolved Co2 Sensor Revenue (million) Forecast, by Application 2020 & 2033
- Table 64: Israel Dissolved Co2 Sensor Volume (K) Forecast, by Application 2020 & 2033
- Table 65: GCC Dissolved Co2 Sensor Revenue (million) Forecast, by Application 2020 & 2033
- Table 66: GCC Dissolved Co2 Sensor Volume (K) Forecast, by Application 2020 & 2033
- Table 67: North Africa Dissolved Co2 Sensor Revenue (million) Forecast, by Application 2020 & 2033
- Table 68: North Africa Dissolved Co2 Sensor Volume (K) Forecast, by Application 2020 & 2033
- Table 69: South Africa Dissolved Co2 Sensor Revenue (million) Forecast, by Application 2020 & 2033
- Table 70: South Africa Dissolved Co2 Sensor Volume (K) Forecast, by Application 2020 & 2033
- Table 71: Rest of Middle East & Africa Dissolved Co2 Sensor Revenue (million) Forecast, by Application 2020 & 2033
- Table 72: Rest of Middle East & Africa Dissolved Co2 Sensor Volume (K) Forecast, by Application 2020 & 2033
- Table 73: Global Dissolved Co2 Sensor Revenue million Forecast, by Application 2020 & 2033
- Table 74: Global Dissolved Co2 Sensor Volume K Forecast, by Application 2020 & 2033
- Table 75: Global Dissolved Co2 Sensor Revenue million Forecast, by Type 2020 & 2033
- Table 76: Global Dissolved Co2 Sensor Volume K Forecast, by Type 2020 & 2033
- Table 77: Global Dissolved Co2 Sensor Revenue million Forecast, by Country 2020 & 2033
- Table 78: Global Dissolved Co2 Sensor Volume K Forecast, by Country 2020 & 2033
- Table 79: China Dissolved Co2 Sensor Revenue (million) Forecast, by Application 2020 & 2033
- Table 80: China Dissolved Co2 Sensor Volume (K) Forecast, by Application 2020 & 2033
- Table 81: India Dissolved Co2 Sensor Revenue (million) Forecast, by Application 2020 & 2033
- Table 82: India Dissolved Co2 Sensor Volume (K) Forecast, by Application 2020 & 2033
- Table 83: Japan Dissolved Co2 Sensor Revenue (million) Forecast, by Application 2020 & 2033
- Table 84: Japan Dissolved Co2 Sensor Volume (K) Forecast, by Application 2020 & 2033
- Table 85: South Korea Dissolved Co2 Sensor Revenue (million) Forecast, by Application 2020 & 2033
- Table 86: South Korea Dissolved Co2 Sensor Volume (K) Forecast, by Application 2020 & 2033
- Table 87: ASEAN Dissolved Co2 Sensor Revenue (million) Forecast, by Application 2020 & 2033
- Table 88: ASEAN Dissolved Co2 Sensor Volume (K) Forecast, by Application 2020 & 2033
- Table 89: Oceania Dissolved Co2 Sensor Revenue (million) Forecast, by Application 2020 & 2033
- Table 90: Oceania Dissolved Co2 Sensor Volume (K) Forecast, by Application 2020 & 2033
- Table 91: Rest of Asia Pacific Dissolved Co2 Sensor Revenue (million) Forecast, by Application 2020 & 2033
- Table 92: Rest of Asia Pacific Dissolved Co2 Sensor Volume (K) Forecast, by Application 2020 & 2033
Frequently Asked Questions
1. What is the projected Compound Annual Growth Rate (CAGR) of the Dissolved Co2 Sensor?
The projected CAGR is approximately XXX%.
2. Which companies are prominent players in the Dissolved Co2 Sensor?
Key companies in the market include Mettler Toledo, Pro-Oceanus, AquaMS, PreSens Precision Sensing GmbH, Hamilton, Jiangsu SWR Science & Technology, Vernier.
3. What are the main segments of the Dissolved Co2 Sensor?
The market segments include Application, Type.
4. Can you provide details about the market size?
The market size is estimated to be USD XXX million as of 2022.
5. What are some drivers contributing to market growth?
N/A
6. What are the notable trends driving market growth?
N/A
7. Are there any restraints impacting market growth?
N/A
8. Can you provide examples of recent developments in the market?
N/A
9. What pricing options are available for accessing the report?
Pricing options include single-user, multi-user, and enterprise licenses priced at USD 3950.00, USD 5925.00, and USD 7900.00 respectively.
10. Is the market size provided in terms of value or volume?
The market size is provided in terms of value, measured in million and volume, measured in K.
11. Are there any specific market keywords associated with the report?
Yes, the market keyword associated with the report is "Dissolved Co2 Sensor," which aids in identifying and referencing the specific market segment covered.
12. How do I determine which pricing option suits my needs best?
The pricing options vary based on user requirements and access needs. Individual users may opt for single-user licenses, while businesses requiring broader access may choose multi-user or enterprise licenses for cost-effective access to the report.
13. Are there any additional resources or data provided in the Dissolved Co2 Sensor report?
While the report offers comprehensive insights, it's advisable to review the specific contents or supplementary materials provided to ascertain if additional resources or data are available.
14. How can I stay updated on further developments or reports in the Dissolved Co2 Sensor?
To stay informed about further developments, trends, and reports in the Dissolved Co2 Sensor, consider subscribing to industry newsletters, following relevant companies and organizations, or regularly checking reputable industry news sources and publications.
Methodology
Step 1 - Identification of Relevant Samples Size from Population Database


Step 2 - Approaches for Defining Global Market Size (Value, Volume* & Price*)

Note*: In applicable scenarios
Step 3 - Data Sources
Primary Research
- Web Analytics
- Survey Reports
- Research Institute
- Latest Research Reports
- Opinion Leaders
Secondary Research
- Annual Reports
- White Paper
- Latest Press Release
- Industry Association
- Paid Database
- Investor Presentations

Step 4 - Data Triangulation
Involves using different sources of information in order to increase the validity of a study
These sources are likely to be stakeholders in a program - participants, other researchers, program staff, other community members, and so on.
Then we put all data in single framework & apply various statistical tools to find out the dynamic on the market.
During the analysis stage, feedback from the stakeholder groups would be compared to determine areas of agreement as well as areas of divergence