

Key Insights
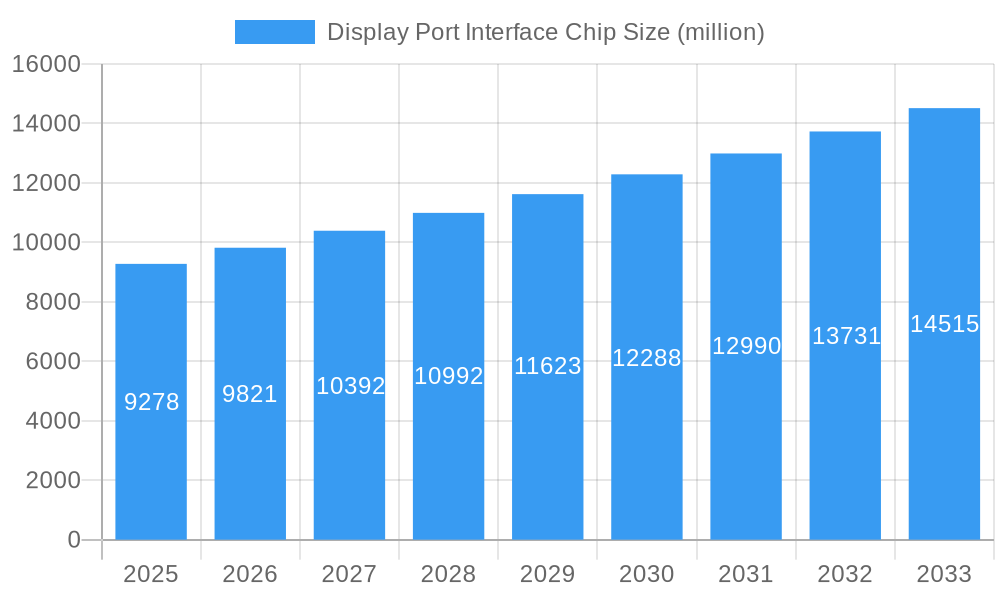
The DisplayPort interface chip market is poised for substantial growth, projected to reach an estimated USD 9,278 million by 2025 and expand at a Compound Annual Growth Rate (CAGR) of 5.9% during the forecast period of 2025-2033. This robust expansion is primarily fueled by the escalating demand for higher resolution displays and increased data transfer speeds across a wide array of electronic devices. The burgeoning automotive electronics sector, with its integration of advanced infotainment systems and digital cockpits, represents a significant driver, alongside the persistent innovation in consumer electronics like high-definition televisions, gaming consoles, and virtual reality headsets. Furthermore, the rapidly growing new energy industry, encompassing electric vehicles and advanced energy management systems, is increasingly leveraging DisplayPort technology for efficient data transmission and display integration, contributing to market acceleration. The automation control industry is also a key benefactor, requiring high-bandwidth, reliable video interfaces for industrial displays and control panels.
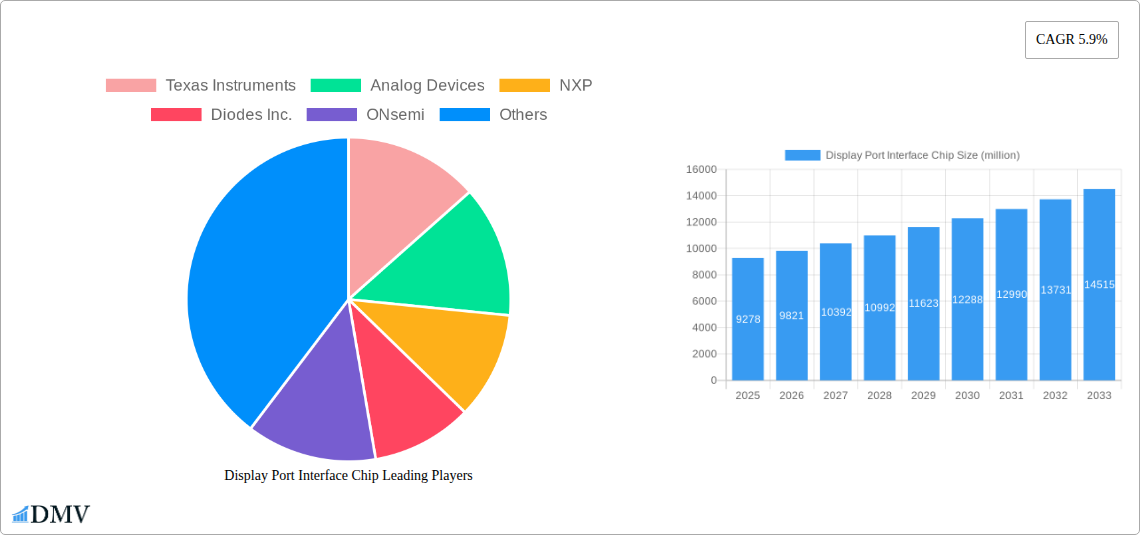
Display Port Interface Chip Market Size (In Billion)
The market is segmented by type, with a notable emphasis on chips featuring 10-100 pins, indicating a strong demand for versatile connectivity solutions that balance performance with integration complexity. The Above 100 Pins segment is expected to see considerable growth, driven by sophisticated applications requiring extensive data bandwidth and multiple display outputs. Conversely, chips with Below 10 Pins will likely cater to more specialized, lower-bandwidth applications. Geographically, Asia Pacific, particularly China and Japan, is anticipated to dominate the market due to its expansive manufacturing base for consumer electronics and automotive components, coupled with significant investments in new energy technologies. North America and Europe are also expected to exhibit strong growth, driven by technological advancements in automotive and consumer sectors, and a focus on high-performance computing and advanced visualization. While the market enjoys strong growth drivers, potential restraints such as the high cost of advanced chip manufacturing and the increasing complexity of integration could pose challenges, necessitating continuous innovation in cost-effectiveness and ease of implementation.
Display Port Interface Chip Company Market Share
Display Port Interface Chip Market Composition & Trends
The Display Port Interface Chip market exhibits a dynamic competitive landscape, characterized by the presence of established semiconductor giants and agile innovators. Market concentration is moderate, with key players like Texas Instruments, Analog Devices, NXP, Diodes Inc., ONsemi, Nexperia, CYPRESS, and CAPSTONE vying for market share. Innovation catalysts are primarily driven by the increasing demand for higher resolution displays, faster refresh rates, and enhanced power efficiency across a multitude of applications. The regulatory landscape, while not overly restrictive, emphasizes standardization and interoperability, ensuring seamless integration of DisplayPort technology. Substitute products, such as HDMI and USB-C with DisplayPort Alternate Mode, pose a competitive challenge, but DisplayPort's superior bandwidth and feature set continue to maintain its stronghold in professional and high-performance segments. End-user profiles range from gaming enthusiasts and professional content creators to automotive manufacturers and industrial automation specialists. Mergers and acquisitions (M&A) activity, while not at an unprecedented level, plays a role in consolidating market presence and acquiring key technologies. M&A deal values are estimated to be in the hundreds of million to low billions of dollars for significant acquisitions, contributing to market evolution. The market share distribution reveals a healthy competition, with leading players holding substantial portions but ample room for emerging entities.
Display Port Interface Chip Industry Evolution
The Display Port Interface Chip industry has witnessed a remarkable evolution, fundamentally reshaping how visual data is transmitted and experienced. From its inception, the industry has been on a trajectory of consistent growth, driven by an insatiable consumer and professional demand for richer, more immersive visual experiences. The study period, spanning from 2019 to 2033, with a base year of 2025, provides a comprehensive outlook on this dynamic transformation. Throughout the historical period (2019-2024), we observed a steady increase in the adoption of higher resolution displays, such as 4K and 8K, necessitating more robust and efficient interface solutions. This demand was further fueled by the proliferation of high-performance computing, advanced gaming consoles, and professional visual workstations.
Technological advancements have been the bedrock of this evolution. The introduction and refinement of DisplayPort standards, such as DisplayPort 1.4 and the upcoming DisplayPort 2.0, have been pivotal. These advancements have unlocked unprecedented bandwidth, enabling higher refresh rates, HDR content delivery, and the support for multiple high-resolution displays through a single connection. For instance, DisplayPort 2.0, with its potential bandwidth of up to 80 Gbps, represents a significant leap forward, far exceeding previous iterations. Adoption metrics for these advanced standards have shown a consistent upward trend, with an estimated adoption rate of 40% for DisplayPort 1.4 by the end of 2024, projected to climb to over 60% by 2025.
Shifting consumer demands have also played a critical role. The desire for thinner, lighter, and more integrated electronic devices has pushed for miniaturization and higher power efficiency in display interface chips. This has led to the development of smaller form factors and reduced power consumption, making DisplayPort interface chips ideal for a wide range of portable and embedded systems. The rise of remote work and immersive entertainment has further amplified the need for high-quality visual output, driving the demand for monitors, laptops, and graphics cards equipped with advanced DisplayPort capabilities. The market growth trajectory has been consistently positive, with an average annual growth rate estimated to be between 10% and 15% over the historical and forecast periods, reflecting the sustained innovation and increasing application of DisplayPort technology. The forecast period (2025-2033) is expected to witness continued innovation, with emerging technologies like virtual reality (VR) and augmented reality (AR) further demanding the high bandwidth and low latency that DisplayPort excels at providing. This sustained demand, coupled with ongoing technological refinements, ensures a robust future for the Display Port Interface Chip industry.
Leading Regions, Countries, or Segments in Display Port Interface Chip
The Display Port Interface Chip market’s leadership is currently best understood by examining its dominant segments across key applications and technical classifications. Within the Application segment, Consumer Electronics stands out as a primary driver of demand. This dominance is fueled by the ubiquitous adoption of high-definition displays in televisions, laptops, gaming consoles, and smartphones. The relentless consumer pursuit of enhanced visual fidelity, higher refresh rates for gaming, and seamless connectivity for entertainment systems directly translates into a substantial market for DisplayPort interface chips. For example, the global market for 4K televisions alone is projected to exceed 200 million units by 2025, each requiring sophisticated display interface solutions.
Parallel to consumer electronics, Automotive Electronics is rapidly emerging as a significant growth frontier. Modern vehicles are increasingly equipped with sophisticated in-car infotainment systems, digital dashboards, and rear-seat entertainment displays. These applications demand high-resolution, reliable, and low-latency video transmission, making DisplayPort interface chips increasingly indispensable. The integration of advanced driver-assistance systems (ADAS) and autonomous driving technologies further necessitates high-bandwidth video processing and display capabilities. Investment trends in the automotive sector, with an estimated global spend of over $100 billion annually on advanced electronics, directly support the growth of DisplayPort adoption in this segment. Regulatory support for in-car safety features and advanced user interfaces also indirectly bolsters this trend.
Considering the Type of interface chip, the 10-100 Pins category currently holds a leading position. This segment offers a balance of functionality and miniaturization, making it suitable for a broad spectrum of devices. Chips within this pin count range often provide advanced features necessary for high-resolution display output while remaining cost-effective and manageable for integration into diverse electronic products. The Above100 Pins category is gaining traction, particularly in high-performance computing and professional visualization applications, where extensive connectivity and advanced signal integrity are paramount. However, the widespread adoption across consumer and mid-range automotive applications keeps the 10-100 pins segment in the lead for volume. The New Energy Industry and Automation Control Industry, while growing, represent niche but rapidly expanding applications, driven by specialized display needs in areas like solar inverter monitoring and industrial automation interfaces. The Consumer Electronics segment's sheer volume and the automotive sector's increasing sophistication are the twin pillars supporting the current market leadership.
Display Port Interface Chip Product Innovations
Recent product innovations in Display Port Interface Chips are pushing the boundaries of visual performance and connectivity. Companies are focusing on developing chips that support the latest DisplayPort standards, enabling higher resolutions like 8K and beyond, coupled with ultra-high refresh rates exceeding 240Hz, crucial for immersive gaming and professional content creation. Innovations include advanced power management features, reducing energy consumption significantly for mobile devices and edge computing applications, with power draw dropping by as much as 30% in some next-generation chips. Furthermore, enhanced signal integrity and robustness are being engineered to ensure reliable data transmission over longer cable lengths and in electromagnetically noisy environments, crucial for automotive and industrial settings. The integration of new functionalities, such as advanced adaptive sync technologies and HDR (High Dynamic Range) support, further elevates the user experience, offering more vibrant colors and deeper contrast ratios. These advancements are designed to be backward compatible, ensuring a smoother transition for existing infrastructure.
Propelling Factors for Display Port Interface Chip Growth
Several key factors are propelling the growth of the Display Port Interface Chip market. The insatiable demand for higher visual fidelity across consumer electronics, including ultra-high definition (UHD) televisions and advanced gaming monitors, is a primary catalyst. Technological advancements, particularly the evolution of the DisplayPort standard itself to higher bandwidths (e.g., DP 2.0), enable more data transmission for superior resolution and refresh rates. The increasing integration of advanced displays in the automotive sector for infotainment and driver information systems is another significant driver, with an estimated market value of over ten billion dollars for automotive displays alone. Furthermore, the burgeoning virtual and augmented reality markets require the high bandwidth and low latency offered by DisplayPort technology. Government initiatives promoting digital transformation and smart infrastructure also contribute to the growing need for sophisticated display connectivity solutions.
Obstacles in the Display Port Interface Chip Market
Despite robust growth, the Display Port Interface Chip market faces certain obstacles. Supply chain disruptions, exacerbated by geopolitical factors and the ongoing global semiconductor shortage, can lead to production delays and increased component costs, impacting manufacturers' ability to meet demand. Intense competition from alternative connectivity standards, such as advanced HDMI versions and USB-C with DisplayPort Alternate Mode, poses a constant threat, especially in price-sensitive consumer segments. While DisplayPort offers superior bandwidth, the broader ecosystem and familiarity of HDMI can sometimes sway purchasing decisions. Regulatory complexities and the need for interoperability certifications across different regions can also add to development timelines and costs for manufacturers. Furthermore, the high research and development costs associated with staying at the forefront of evolving DisplayPort standards can be a barrier for smaller players.
Future Opportunities in Display Port Interface Chip
The future for Display Port Interface Chips is rich with opportunities. The rapid expansion of the Internet of Things (IoT) and smart home devices will necessitate advanced display connectivity for user interfaces and monitoring systems, presenting a significant growth avenue. The continued evolution of virtual and augmented reality technologies promises a substantial demand for high-bandwidth, low-latency interfaces, a sweet spot for DisplayPort. Emerging markets, particularly in developing regions experiencing increasing disposable income, will drive adoption of consumer electronics with advanced display capabilities. Furthermore, the automotive industry's ongoing transition towards more digitized cockpits and sophisticated infotainment systems offers substantial long-term potential. Innovations in foldable displays and flexible screen technologies will also require specialized interface solutions that DisplayPort can address.
Major Players in the Display Port Interface Chip Ecosystem
- Texas Instruments
- Analog Devices
- NXP
- Diodes Inc.
- ONsemi
- Nexperia
- CYPRESS
- CAPSTONE
Key Developments in Display Port Interface Chip Industry
- January 2024: Launch of next-generation DisplayPort 2.1 certified chips, offering enhanced bandwidth of up to 80 Gbps, catering to the increasing demand for 8K and high-refresh-rate displays.
- November 2023: Texas Instruments announces a new family of DisplayPort re-timers with improved power efficiency and signal integrity, targeting automotive applications.
- July 2023: Analog Devices showcases innovative DisplayPort solutions for AR/VR headsets, emphasizing miniaturization and low power consumption.
- April 2023: NXP Semiconductors secures a significant contract to supply DisplayPort interface chips for leading automotive manufacturers, highlighting the growing automotive segment.
- December 2022: Diodes Incorporated introduces cost-effective DisplayPort 1.4 switches, broadening accessibility for mid-range consumer electronics.
- September 2022: ONsemi releases advanced DisplayPort level-shifters designed for extreme temperature environments, crucial for industrial automation.
- May 2022: CYPRESS (now part of Infineon) patents a novel technology for enhanced DisplayPort signal conditioning, promising improved performance over longer distances.
- February 2022: CAPSTONE unveils a compact DisplayPort transmitter chip with integrated video processing capabilities for portable devices.
Strategic Display Port Interface Chip Market Forecast
The Display Port Interface Chip market is poised for continued strategic growth, driven by an confluence of technological advancements and expanding application horizons. The forecast period (2025-2033) is expected to witness sustained demand for higher bandwidth and enhanced visual capabilities, fueled by the proliferation of 8K displays, advanced gaming, and the burgeoning AR/VR sectors. The automotive industry's increasing reliance on sophisticated in-car displays and the New Energy Industry's need for reliable monitoring interfaces present significant untapped potential. Strategic investments in research and development by key players, focusing on power efficiency and miniaturization, will further unlock new market segments. The market's trajectory indicates a strong upward trend, with opportunities for innovation and expansion remaining abundant.
Display Port Interface Chip Segmentation
-
1. Application
- 1.1. Automotive Electronics
- 1.2. Home Appliances
- 1.3. Consumer Electronics
- 1.4. New Energy Industry
- 1.5. Automation Control Industry
-
2. Type
- 2.1. Below10 Pins
- 2.2. 10-100 Pins
- 2.3. Above100 Pins
Display Port Interface Chip Segmentation By Geography
-
1. North America
- 1.1. United States
- 1.2. Canada
- 1.3. Mexico
-
2. South America
- 2.1. Brazil
- 2.2. Argentina
- 2.3. Rest of South America
-
3. Europe
- 3.1. United Kingdom
- 3.2. Germany
- 3.3. France
- 3.4. Italy
- 3.5. Spain
- 3.6. Russia
- 3.7. Benelux
- 3.8. Nordics
- 3.9. Rest of Europe
-
4. Middle East & Africa
- 4.1. Turkey
- 4.2. Israel
- 4.3. GCC
- 4.4. North Africa
- 4.5. South Africa
- 4.6. Rest of Middle East & Africa
-
5. Asia Pacific
- 5.1. China
- 5.2. India
- 5.3. Japan
- 5.4. South Korea
- 5.5. ASEAN
- 5.6. Oceania
- 5.7. Rest of Asia Pacific
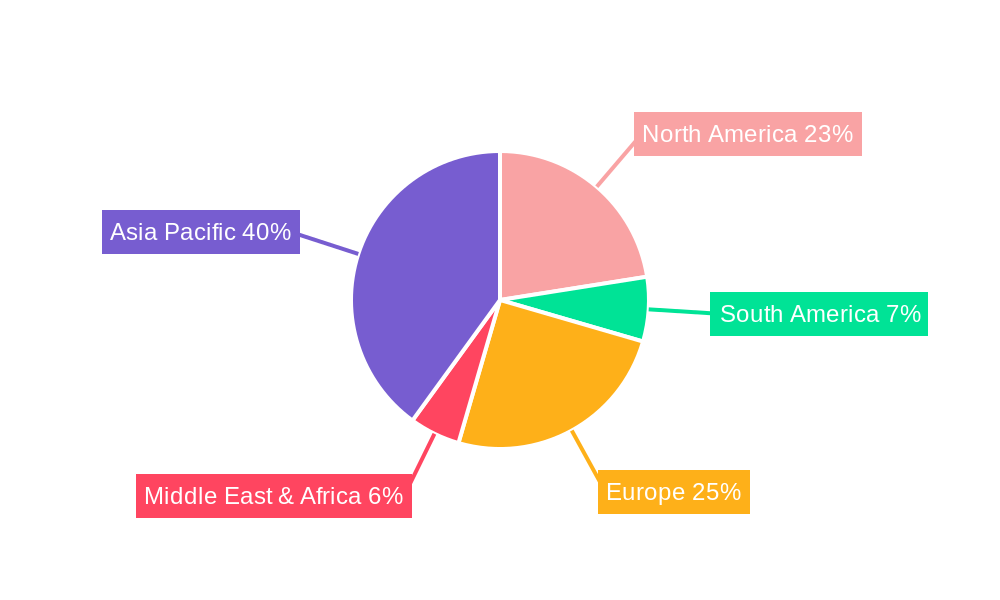
Display Port Interface Chip Regional Market Share
Geographic Coverage of Display Port Interface Chip
Display Port Interface Chip REPORT HIGHLIGHTS
| Aspects | Details |
|---|---|
| Study Period | 2020-2034 |
| Base Year | 2025 |
| Estimated Year | 2026 |
| Forecast Period | 2026-2034 |
| Historical Period | 2020-2025 |
| Growth Rate | CAGR of 5.9% from 2020-2034 |
| Segmentation |
|
Table of Contents
- 1. Introduction
- 1.1. Research Scope
- 1.2. Market Segmentation
- 1.3. Research Objective
- 1.4. Definitions and Assumptions
- 2. Executive Summary
- 2.1. Market Snapshot
- 3. Market Dynamics
- 3.1. Market Drivers
- 3.2. Market Restrains
- 3.3. Market Trends
- 3.4. Market Opportunities
- 4. Market Factor Analysis
- 4.1. Porters Five Forces
- 4.1.1. Bargaining Power of Suppliers
- 4.1.2. Bargaining Power of Buyers
- 4.1.3. Threat of New Entrants
- 4.1.4. Threat of Substitutes
- 4.1.5. Competitive Rivalry
- 4.2. PESTEL analysis
- 4.3. BCG Analysis
- 4.3.1. Stars (High Growth, High Market Share)
- 4.3.2. Cash Cows (Low Growth, High Market Share)
- 4.3.3. Question Mark (High Growth, Low Market Share)
- 4.3.4. Dogs (Low Growth, Low Market Share)
- 4.4. Ansoff Matrix Analysis
- 4.5. Supply Chain Analysis
- 4.6. Regulatory Landscape
- 4.7. Current Market Potential and Opportunity Assessment (TAM–SAM–SOM Framework)
- 4.8. DMV Analyst Note
- 4.1. Porters Five Forces
- 5. Market Analysis, Insights and Forecast 2021-2033
- 5.1. Market Analysis, Insights and Forecast - by Application
- 5.1.1. Automotive Electronics
- 5.1.2. Home Appliances
- 5.1.3. Consumer Electronics
- 5.1.4. New Energy Industry
- 5.1.5. Automation Control Industry
- 5.2. Market Analysis, Insights and Forecast - by Type
- 5.2.1. Below10 Pins
- 5.2.2. 10-100 Pins
- 5.2.3. Above100 Pins
- 5.3. Market Analysis, Insights and Forecast - by Region
- 5.3.1. North America
- 5.3.2. South America
- 5.3.3. Europe
- 5.3.4. Middle East & Africa
- 5.3.5. Asia Pacific
- 5.1. Market Analysis, Insights and Forecast - by Application
- 6. Global Display Port Interface Chip Analysis, Insights and Forecast, 2021-2033
- 6.1. Market Analysis, Insights and Forecast - by Application
- 6.1.1. Automotive Electronics
- 6.1.2. Home Appliances
- 6.1.3. Consumer Electronics
- 6.1.4. New Energy Industry
- 6.1.5. Automation Control Industry
- 6.2. Market Analysis, Insights and Forecast - by Type
- 6.2.1. Below10 Pins
- 6.2.2. 10-100 Pins
- 6.2.3. Above100 Pins
- 6.1. Market Analysis, Insights and Forecast - by Application
- 7. North America Display Port Interface Chip Analysis, Insights and Forecast, 2020-2032
- 7.1. Market Analysis, Insights and Forecast - by Application
- 7.1.1. Automotive Electronics
- 7.1.2. Home Appliances
- 7.1.3. Consumer Electronics
- 7.1.4. New Energy Industry
- 7.1.5. Automation Control Industry
- 7.2. Market Analysis, Insights and Forecast - by Type
- 7.2.1. Below10 Pins
- 7.2.2. 10-100 Pins
- 7.2.3. Above100 Pins
- 7.1. Market Analysis, Insights and Forecast - by Application
- 8. South America Display Port Interface Chip Analysis, Insights and Forecast, 2020-2032
- 8.1. Market Analysis, Insights and Forecast - by Application
- 8.1.1. Automotive Electronics
- 8.1.2. Home Appliances
- 8.1.3. Consumer Electronics
- 8.1.4. New Energy Industry
- 8.1.5. Automation Control Industry
- 8.2. Market Analysis, Insights and Forecast - by Type
- 8.2.1. Below10 Pins
- 8.2.2. 10-100 Pins
- 8.2.3. Above100 Pins
- 8.1. Market Analysis, Insights and Forecast - by Application
- 9. Europe Display Port Interface Chip Analysis, Insights and Forecast, 2020-2032
- 9.1. Market Analysis, Insights and Forecast - by Application
- 9.1.1. Automotive Electronics
- 9.1.2. Home Appliances
- 9.1.3. Consumer Electronics
- 9.1.4. New Energy Industry
- 9.1.5. Automation Control Industry
- 9.2. Market Analysis, Insights and Forecast - by Type
- 9.2.1. Below10 Pins
- 9.2.2. 10-100 Pins
- 9.2.3. Above100 Pins
- 9.1. Market Analysis, Insights and Forecast - by Application
- 10. Middle East & Africa Display Port Interface Chip Analysis, Insights and Forecast, 2020-2032
- 10.1. Market Analysis, Insights and Forecast - by Application
- 10.1.1. Automotive Electronics
- 10.1.2. Home Appliances
- 10.1.3. Consumer Electronics
- 10.1.4. New Energy Industry
- 10.1.5. Automation Control Industry
- 10.2. Market Analysis, Insights and Forecast - by Type
- 10.2.1. Below10 Pins
- 10.2.2. 10-100 Pins
- 10.2.3. Above100 Pins
- 10.1. Market Analysis, Insights and Forecast - by Application
- 11. Asia Pacific Display Port Interface Chip Analysis, Insights and Forecast, 2020-2032
- 11.1. Market Analysis, Insights and Forecast - by Application
- 11.1.1. Automotive Electronics
- 11.1.2. Home Appliances
- 11.1.3. Consumer Electronics
- 11.1.4. New Energy Industry
- 11.1.5. Automation Control Industry
- 11.2. Market Analysis, Insights and Forecast - by Type
- 11.2.1. Below10 Pins
- 11.2.2. 10-100 Pins
- 11.2.3. Above100 Pins
- 11.1. Market Analysis, Insights and Forecast - by Application
- 12. Competitive Analysis
- 12.1. Company Profiles
- 12.1.1 Texas Instruments
- 12.1.1.1. Company Overview
- 12.1.1.2. Products
- 12.1.1.3. Company Financials
- 12.1.1.4. SWOT Analysis
- 12.1.2 Analog Devices
- 12.1.2.1. Company Overview
- 12.1.2.2. Products
- 12.1.2.3. Company Financials
- 12.1.2.4. SWOT Analysis
- 12.1.3 NXP
- 12.1.3.1. Company Overview
- 12.1.3.2. Products
- 12.1.3.3. Company Financials
- 12.1.3.4. SWOT Analysis
- 12.1.4 Diodes Inc.
- 12.1.4.1. Company Overview
- 12.1.4.2. Products
- 12.1.4.3. Company Financials
- 12.1.4.4. SWOT Analysis
- 12.1.5 ONsemi
- 12.1.5.1. Company Overview
- 12.1.5.2. Products
- 12.1.5.3. Company Financials
- 12.1.5.4. SWOT Analysis
- 12.1.6 Nexperia
- 12.1.6.1. Company Overview
- 12.1.6.2. Products
- 12.1.6.3. Company Financials
- 12.1.6.4. SWOT Analysis
- 12.1.7 CYPRESS
- 12.1.7.1. Company Overview
- 12.1.7.2. Products
- 12.1.7.3. Company Financials
- 12.1.7.4. SWOT Analysis
- 12.1.8 CAPSTONE
- 12.1.8.1. Company Overview
- 12.1.8.2. Products
- 12.1.8.3. Company Financials
- 12.1.8.4. SWOT Analysis
- 12.1.1 Texas Instruments
- 12.2. Market Entropy
- 12.2.1 Company's Key Areas Served
- 12.2.2 Recent Developments
- 12.3. Company Market Share Analysis 2025
- 12.3.1 Top 5 Companies Market Share Analysis
- 12.3.2 Top 3 Companies Market Share Analysis
- 12.4. List of Potential Customers
- 13. Research Methodology
List of Figures
- Figure 1: Global Display Port Interface Chip Revenue Breakdown (million, %) by Region 2025 & 2033
- Figure 2: Global Display Port Interface Chip Volume Breakdown (K, %) by Region 2025 & 2033
- Figure 3: North America Display Port Interface Chip Revenue (million), by Application 2025 & 2033
- Figure 4: North America Display Port Interface Chip Volume (K), by Application 2025 & 2033
- Figure 5: North America Display Port Interface Chip Revenue Share (%), by Application 2025 & 2033
- Figure 6: North America Display Port Interface Chip Volume Share (%), by Application 2025 & 2033
- Figure 7: North America Display Port Interface Chip Revenue (million), by Type 2025 & 2033
- Figure 8: North America Display Port Interface Chip Volume (K), by Type 2025 & 2033
- Figure 9: North America Display Port Interface Chip Revenue Share (%), by Type 2025 & 2033
- Figure 10: North America Display Port Interface Chip Volume Share (%), by Type 2025 & 2033
- Figure 11: North America Display Port Interface Chip Revenue (million), by Country 2025 & 2033
- Figure 12: North America Display Port Interface Chip Volume (K), by Country 2025 & 2033
- Figure 13: North America Display Port Interface Chip Revenue Share (%), by Country 2025 & 2033
- Figure 14: North America Display Port Interface Chip Volume Share (%), by Country 2025 & 2033
- Figure 15: South America Display Port Interface Chip Revenue (million), by Application 2025 & 2033
- Figure 16: South America Display Port Interface Chip Volume (K), by Application 2025 & 2033
- Figure 17: South America Display Port Interface Chip Revenue Share (%), by Application 2025 & 2033
- Figure 18: South America Display Port Interface Chip Volume Share (%), by Application 2025 & 2033
- Figure 19: South America Display Port Interface Chip Revenue (million), by Type 2025 & 2033
- Figure 20: South America Display Port Interface Chip Volume (K), by Type 2025 & 2033
- Figure 21: South America Display Port Interface Chip Revenue Share (%), by Type 2025 & 2033
- Figure 22: South America Display Port Interface Chip Volume Share (%), by Type 2025 & 2033
- Figure 23: South America Display Port Interface Chip Revenue (million), by Country 2025 & 2033
- Figure 24: South America Display Port Interface Chip Volume (K), by Country 2025 & 2033
- Figure 25: South America Display Port Interface Chip Revenue Share (%), by Country 2025 & 2033
- Figure 26: South America Display Port Interface Chip Volume Share (%), by Country 2025 & 2033
- Figure 27: Europe Display Port Interface Chip Revenue (million), by Application 2025 & 2033
- Figure 28: Europe Display Port Interface Chip Volume (K), by Application 2025 & 2033
- Figure 29: Europe Display Port Interface Chip Revenue Share (%), by Application 2025 & 2033
- Figure 30: Europe Display Port Interface Chip Volume Share (%), by Application 2025 & 2033
- Figure 31: Europe Display Port Interface Chip Revenue (million), by Type 2025 & 2033
- Figure 32: Europe Display Port Interface Chip Volume (K), by Type 2025 & 2033
- Figure 33: Europe Display Port Interface Chip Revenue Share (%), by Type 2025 & 2033
- Figure 34: Europe Display Port Interface Chip Volume Share (%), by Type 2025 & 2033
- Figure 35: Europe Display Port Interface Chip Revenue (million), by Country 2025 & 2033
- Figure 36: Europe Display Port Interface Chip Volume (K), by Country 2025 & 2033
- Figure 37: Europe Display Port Interface Chip Revenue Share (%), by Country 2025 & 2033
- Figure 38: Europe Display Port Interface Chip Volume Share (%), by Country 2025 & 2033
- Figure 39: Middle East & Africa Display Port Interface Chip Revenue (million), by Application 2025 & 2033
- Figure 40: Middle East & Africa Display Port Interface Chip Volume (K), by Application 2025 & 2033
- Figure 41: Middle East & Africa Display Port Interface Chip Revenue Share (%), by Application 2025 & 2033
- Figure 42: Middle East & Africa Display Port Interface Chip Volume Share (%), by Application 2025 & 2033
- Figure 43: Middle East & Africa Display Port Interface Chip Revenue (million), by Type 2025 & 2033
- Figure 44: Middle East & Africa Display Port Interface Chip Volume (K), by Type 2025 & 2033
- Figure 45: Middle East & Africa Display Port Interface Chip Revenue Share (%), by Type 2025 & 2033
- Figure 46: Middle East & Africa Display Port Interface Chip Volume Share (%), by Type 2025 & 2033
- Figure 47: Middle East & Africa Display Port Interface Chip Revenue (million), by Country 2025 & 2033
- Figure 48: Middle East & Africa Display Port Interface Chip Volume (K), by Country 2025 & 2033
- Figure 49: Middle East & Africa Display Port Interface Chip Revenue Share (%), by Country 2025 & 2033
- Figure 50: Middle East & Africa Display Port Interface Chip Volume Share (%), by Country 2025 & 2033
- Figure 51: Asia Pacific Display Port Interface Chip Revenue (million), by Application 2025 & 2033
- Figure 52: Asia Pacific Display Port Interface Chip Volume (K), by Application 2025 & 2033
- Figure 53: Asia Pacific Display Port Interface Chip Revenue Share (%), by Application 2025 & 2033
- Figure 54: Asia Pacific Display Port Interface Chip Volume Share (%), by Application 2025 & 2033
- Figure 55: Asia Pacific Display Port Interface Chip Revenue (million), by Type 2025 & 2033
- Figure 56: Asia Pacific Display Port Interface Chip Volume (K), by Type 2025 & 2033
- Figure 57: Asia Pacific Display Port Interface Chip Revenue Share (%), by Type 2025 & 2033
- Figure 58: Asia Pacific Display Port Interface Chip Volume Share (%), by Type 2025 & 2033
- Figure 59: Asia Pacific Display Port Interface Chip Revenue (million), by Country 2025 & 2033
- Figure 60: Asia Pacific Display Port Interface Chip Volume (K), by Country 2025 & 2033
- Figure 61: Asia Pacific Display Port Interface Chip Revenue Share (%), by Country 2025 & 2033
- Figure 62: Asia Pacific Display Port Interface Chip Volume Share (%), by Country 2025 & 2033
List of Tables
- Table 1: Global Display Port Interface Chip Revenue million Forecast, by Application 2020 & 2033
- Table 2: Global Display Port Interface Chip Volume K Forecast, by Application 2020 & 2033
- Table 3: Global Display Port Interface Chip Revenue million Forecast, by Type 2020 & 2033
- Table 4: Global Display Port Interface Chip Volume K Forecast, by Type 2020 & 2033
- Table 5: Global Display Port Interface Chip Revenue million Forecast, by Region 2020 & 2033
- Table 6: Global Display Port Interface Chip Volume K Forecast, by Region 2020 & 2033
- Table 7: Global Display Port Interface Chip Revenue million Forecast, by Application 2020 & 2033
- Table 8: Global Display Port Interface Chip Volume K Forecast, by Application 2020 & 2033
- Table 9: Global Display Port Interface Chip Revenue million Forecast, by Type 2020 & 2033
- Table 10: Global Display Port Interface Chip Volume K Forecast, by Type 2020 & 2033
- Table 11: Global Display Port Interface Chip Revenue million Forecast, by Country 2020 & 2033
- Table 12: Global Display Port Interface Chip Volume K Forecast, by Country 2020 & 2033
- Table 13: United States Display Port Interface Chip Revenue (million) Forecast, by Application 2020 & 2033
- Table 14: United States Display Port Interface Chip Volume (K) Forecast, by Application 2020 & 2033
- Table 15: Canada Display Port Interface Chip Revenue (million) Forecast, by Application 2020 & 2033
- Table 16: Canada Display Port Interface Chip Volume (K) Forecast, by Application 2020 & 2033
- Table 17: Mexico Display Port Interface Chip Revenue (million) Forecast, by Application 2020 & 2033
- Table 18: Mexico Display Port Interface Chip Volume (K) Forecast, by Application 2020 & 2033
- Table 19: Global Display Port Interface Chip Revenue million Forecast, by Application 2020 & 2033
- Table 20: Global Display Port Interface Chip Volume K Forecast, by Application 2020 & 2033
- Table 21: Global Display Port Interface Chip Revenue million Forecast, by Type 2020 & 2033
- Table 22: Global Display Port Interface Chip Volume K Forecast, by Type 2020 & 2033
- Table 23: Global Display Port Interface Chip Revenue million Forecast, by Country 2020 & 2033
- Table 24: Global Display Port Interface Chip Volume K Forecast, by Country 2020 & 2033
- Table 25: Brazil Display Port Interface Chip Revenue (million) Forecast, by Application 2020 & 2033
- Table 26: Brazil Display Port Interface Chip Volume (K) Forecast, by Application 2020 & 2033
- Table 27: Argentina Display Port Interface Chip Revenue (million) Forecast, by Application 2020 & 2033
- Table 28: Argentina Display Port Interface Chip Volume (K) Forecast, by Application 2020 & 2033
- Table 29: Rest of South America Display Port Interface Chip Revenue (million) Forecast, by Application 2020 & 2033
- Table 30: Rest of South America Display Port Interface Chip Volume (K) Forecast, by Application 2020 & 2033
- Table 31: Global Display Port Interface Chip Revenue million Forecast, by Application 2020 & 2033
- Table 32: Global Display Port Interface Chip Volume K Forecast, by Application 2020 & 2033
- Table 33: Global Display Port Interface Chip Revenue million Forecast, by Type 2020 & 2033
- Table 34: Global Display Port Interface Chip Volume K Forecast, by Type 2020 & 2033
- Table 35: Global Display Port Interface Chip Revenue million Forecast, by Country 2020 & 2033
- Table 36: Global Display Port Interface Chip Volume K Forecast, by Country 2020 & 2033
- Table 37: United Kingdom Display Port Interface Chip Revenue (million) Forecast, by Application 2020 & 2033
- Table 38: United Kingdom Display Port Interface Chip Volume (K) Forecast, by Application 2020 & 2033
- Table 39: Germany Display Port Interface Chip Revenue (million) Forecast, by Application 2020 & 2033
- Table 40: Germany Display Port Interface Chip Volume (K) Forecast, by Application 2020 & 2033
- Table 41: France Display Port Interface Chip Revenue (million) Forecast, by Application 2020 & 2033
- Table 42: France Display Port Interface Chip Volume (K) Forecast, by Application 2020 & 2033
- Table 43: Italy Display Port Interface Chip Revenue (million) Forecast, by Application 2020 & 2033
- Table 44: Italy Display Port Interface Chip Volume (K) Forecast, by Application 2020 & 2033
- Table 45: Spain Display Port Interface Chip Revenue (million) Forecast, by Application 2020 & 2033
- Table 46: Spain Display Port Interface Chip Volume (K) Forecast, by Application 2020 & 2033
- Table 47: Russia Display Port Interface Chip Revenue (million) Forecast, by Application 2020 & 2033
- Table 48: Russia Display Port Interface Chip Volume (K) Forecast, by Application 2020 & 2033
- Table 49: Benelux Display Port Interface Chip Revenue (million) Forecast, by Application 2020 & 2033
- Table 50: Benelux Display Port Interface Chip Volume (K) Forecast, by Application 2020 & 2033
- Table 51: Nordics Display Port Interface Chip Revenue (million) Forecast, by Application 2020 & 2033
- Table 52: Nordics Display Port Interface Chip Volume (K) Forecast, by Application 2020 & 2033
- Table 53: Rest of Europe Display Port Interface Chip Revenue (million) Forecast, by Application 2020 & 2033
- Table 54: Rest of Europe Display Port Interface Chip Volume (K) Forecast, by Application 2020 & 2033
- Table 55: Global Display Port Interface Chip Revenue million Forecast, by Application 2020 & 2033
- Table 56: Global Display Port Interface Chip Volume K Forecast, by Application 2020 & 2033
- Table 57: Global Display Port Interface Chip Revenue million Forecast, by Type 2020 & 2033
- Table 58: Global Display Port Interface Chip Volume K Forecast, by Type 2020 & 2033
- Table 59: Global Display Port Interface Chip Revenue million Forecast, by Country 2020 & 2033
- Table 60: Global Display Port Interface Chip Volume K Forecast, by Country 2020 & 2033
- Table 61: Turkey Display Port Interface Chip Revenue (million) Forecast, by Application 2020 & 2033
- Table 62: Turkey Display Port Interface Chip Volume (K) Forecast, by Application 2020 & 2033
- Table 63: Israel Display Port Interface Chip Revenue (million) Forecast, by Application 2020 & 2033
- Table 64: Israel Display Port Interface Chip Volume (K) Forecast, by Application 2020 & 2033
- Table 65: GCC Display Port Interface Chip Revenue (million) Forecast, by Application 2020 & 2033
- Table 66: GCC Display Port Interface Chip Volume (K) Forecast, by Application 2020 & 2033
- Table 67: North Africa Display Port Interface Chip Revenue (million) Forecast, by Application 2020 & 2033
- Table 68: North Africa Display Port Interface Chip Volume (K) Forecast, by Application 2020 & 2033
- Table 69: South Africa Display Port Interface Chip Revenue (million) Forecast, by Application 2020 & 2033
- Table 70: South Africa Display Port Interface Chip Volume (K) Forecast, by Application 2020 & 2033
- Table 71: Rest of Middle East & Africa Display Port Interface Chip Revenue (million) Forecast, by Application 2020 & 2033
- Table 72: Rest of Middle East & Africa Display Port Interface Chip Volume (K) Forecast, by Application 2020 & 2033
- Table 73: Global Display Port Interface Chip Revenue million Forecast, by Application 2020 & 2033
- Table 74: Global Display Port Interface Chip Volume K Forecast, by Application 2020 & 2033
- Table 75: Global Display Port Interface Chip Revenue million Forecast, by Type 2020 & 2033
- Table 76: Global Display Port Interface Chip Volume K Forecast, by Type 2020 & 2033
- Table 77: Global Display Port Interface Chip Revenue million Forecast, by Country 2020 & 2033
- Table 78: Global Display Port Interface Chip Volume K Forecast, by Country 2020 & 2033
- Table 79: China Display Port Interface Chip Revenue (million) Forecast, by Application 2020 & 2033
- Table 80: China Display Port Interface Chip Volume (K) Forecast, by Application 2020 & 2033
- Table 81: India Display Port Interface Chip Revenue (million) Forecast, by Application 2020 & 2033
- Table 82: India Display Port Interface Chip Volume (K) Forecast, by Application 2020 & 2033
- Table 83: Japan Display Port Interface Chip Revenue (million) Forecast, by Application 2020 & 2033
- Table 84: Japan Display Port Interface Chip Volume (K) Forecast, by Application 2020 & 2033
- Table 85: South Korea Display Port Interface Chip Revenue (million) Forecast, by Application 2020 & 2033
- Table 86: South Korea Display Port Interface Chip Volume (K) Forecast, by Application 2020 & 2033
- Table 87: ASEAN Display Port Interface Chip Revenue (million) Forecast, by Application 2020 & 2033
- Table 88: ASEAN Display Port Interface Chip Volume (K) Forecast, by Application 2020 & 2033
- Table 89: Oceania Display Port Interface Chip Revenue (million) Forecast, by Application 2020 & 2033
- Table 90: Oceania Display Port Interface Chip Volume (K) Forecast, by Application 2020 & 2033
- Table 91: Rest of Asia Pacific Display Port Interface Chip Revenue (million) Forecast, by Application 2020 & 2033
- Table 92: Rest of Asia Pacific Display Port Interface Chip Volume (K) Forecast, by Application 2020 & 2033
Frequently Asked Questions
1. What is the projected Compound Annual Growth Rate (CAGR) of the Display Port Interface Chip?
The projected CAGR is approximately 5.9%.
2. Which companies are prominent players in the Display Port Interface Chip?
Key companies in the market include Texas Instruments, Analog Devices, NXP, Diodes Inc., ONsemi, Nexperia, CYPRESS, CAPSTONE.
3. What are the main segments of the Display Port Interface Chip?
The market segments include Application, Type.
4. Can you provide details about the market size?
The market size is estimated to be USD 9278 million as of 2022.
5. What are some drivers contributing to market growth?
N/A
6. What are the notable trends driving market growth?
N/A
7. Are there any restraints impacting market growth?
N/A
8. Can you provide examples of recent developments in the market?
N/A
9. What pricing options are available for accessing the report?
Pricing options include single-user, multi-user, and enterprise licenses priced at USD 3950.00, USD 5925.00, and USD 7900.00 respectively.
10. Is the market size provided in terms of value or volume?
The market size is provided in terms of value, measured in million and volume, measured in K.
11. Are there any specific market keywords associated with the report?
Yes, the market keyword associated with the report is "Display Port Interface Chip," which aids in identifying and referencing the specific market segment covered.
12. How do I determine which pricing option suits my needs best?
The pricing options vary based on user requirements and access needs. Individual users may opt for single-user licenses, while businesses requiring broader access may choose multi-user or enterprise licenses for cost-effective access to the report.
13. Are there any additional resources or data provided in the Display Port Interface Chip report?
While the report offers comprehensive insights, it's advisable to review the specific contents or supplementary materials provided to ascertain if additional resources or data are available.
14. How can I stay updated on further developments or reports in the Display Port Interface Chip?
To stay informed about further developments, trends, and reports in the Display Port Interface Chip, consider subscribing to industry newsletters, following relevant companies and organizations, or regularly checking reputable industry news sources and publications.
Methodology
Step 1 - Identification of Relevant Samples Size from Population Database


Step 2 - Approaches for Defining Global Market Size (Value, Volume* & Price*)

Note*: In applicable scenarios
Step 3 - Data Sources
Primary Research
- Web Analytics
- Survey Reports
- Research Institute
- Latest Research Reports
- Opinion Leaders
Secondary Research
- Annual Reports
- White Paper
- Latest Press Release
- Industry Association
- Paid Database
- Investor Presentations

Step 4 - Data Triangulation
Involves using different sources of information in order to increase the validity of a study
These sources are likely to be stakeholders in a program - participants, other researchers, program staff, other community members, and so on.
Then we put all data in single framework & apply various statistical tools to find out the dynamic on the market.
During the analysis stage, feedback from the stakeholder groups would be compared to determine areas of agreement as well as areas of divergence