

Key Insights
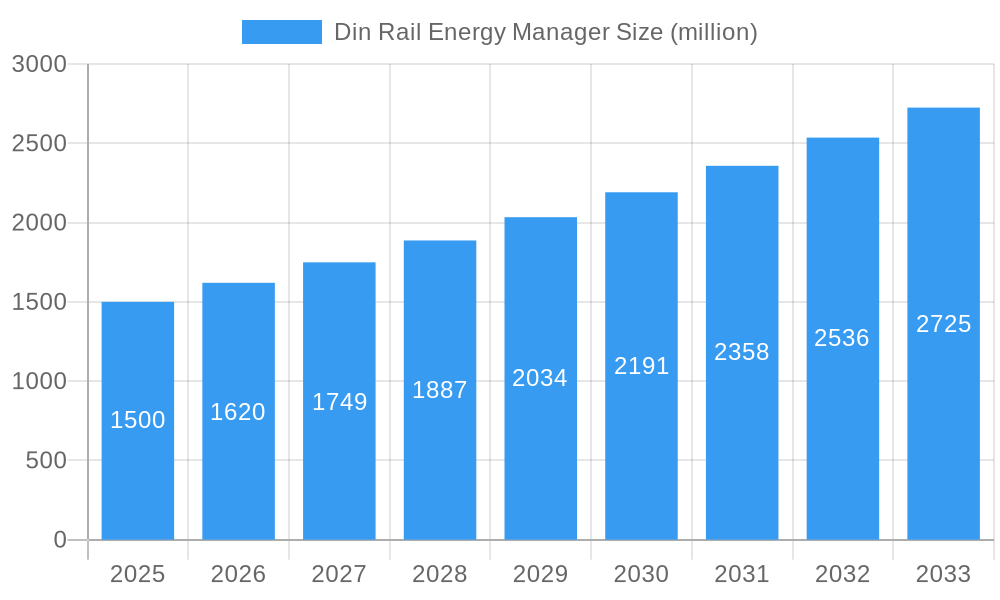
The Din Rail Energy Manager market is experiencing robust growth, driven by increasing demand for energy efficiency and smart building technologies. The market, estimated at $1.5 billion in 2025, is projected to exhibit a Compound Annual Growth Rate (CAGR) of 8% between 2025 and 2033, reaching an estimated market value of approximately $2.8 billion by 2033. This growth is fueled by several key factors, including stringent government regulations promoting energy conservation, rising electricity costs, and the increasing adoption of smart grid technologies. The rising adoption of renewable energy sources also contributes to the market's expansion, as Din Rail Energy Managers play a crucial role in optimizing the integration and management of these sources. Key market trends include the integration of advanced analytics and data visualization capabilities within these energy management systems, enhancing their effectiveness and providing valuable insights for better energy consumption control. The growing demand for sophisticated monitoring and control capabilities within industrial and commercial settings is another key driver.
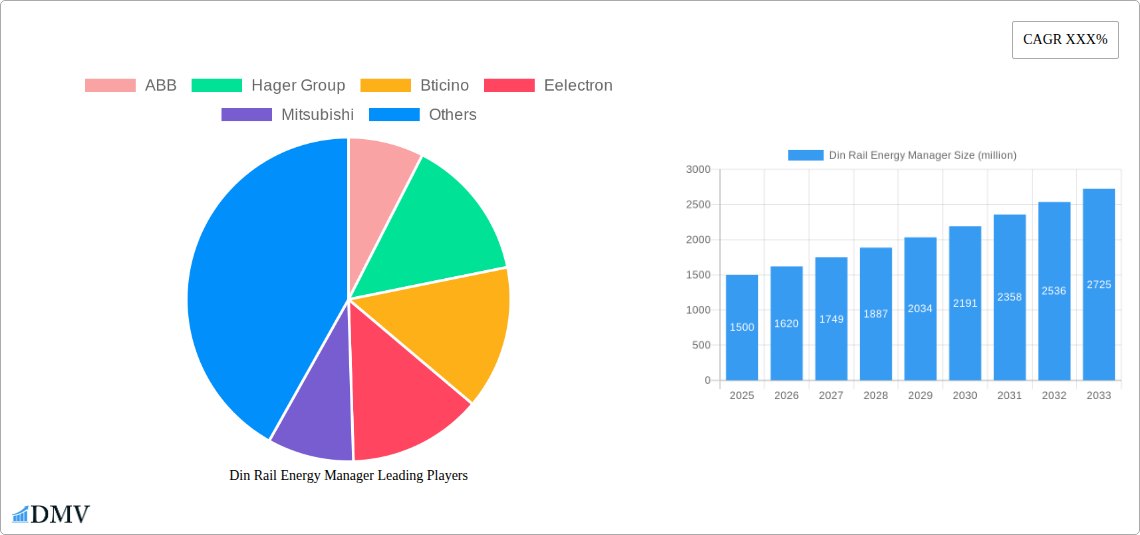
Din Rail Energy Manager Market Size (In Billion)
Despite the positive outlook, certain challenges hinder market expansion. High initial investment costs associated with implementing Din Rail Energy Manager systems can deter smaller businesses. Furthermore, the complexity of installation and integration with existing infrastructure can present an obstacle. However, these limitations are gradually being addressed through technological advancements leading to more user-friendly interfaces and cost-effective solutions. The market segmentation shows a strong preference for advanced features, driving innovation within companies like ABB, Hager Group, Bticino, and others. Regional variations exist, with North America and Europe leading the adoption, followed by Asia-Pacific exhibiting significant growth potential. The continued focus on energy sustainability and technological advancements will be pivotal in shaping the future trajectory of this dynamic market.
Din Rail Energy Manager Company Market Share
Din Rail Energy Manager Market Report: A Comprehensive Analysis (2019-2033)
This insightful report provides a comprehensive analysis of the global Din Rail Energy Manager market, offering invaluable insights for stakeholders seeking to navigate this dynamic landscape. The study covers the period from 2019 to 2033, with a focus on the forecast period from 2025 to 2033, utilizing 2025 as the base year and estimated year. The report projects a market size exceeding $XX million by 2033, driven by significant technological advancements and increasing demand across diverse sectors. This in-depth analysis covers market composition, industry evolution, regional dominance, product innovation, growth factors, challenges, future opportunities, key players, and key developments, providing a holistic view of this thriving market.
Din Rail Energy Manager Market Composition & Trends
This section delves into the intricate structure of the Din Rail Energy Manager market, examining market concentration, key innovation drivers, regulatory landscapes, substitute product analysis, end-user profiles, and mergers & acquisitions (M&A) activity. We analyze the market share distribution among key players, revealing a moderately concentrated market with ABB, Hager Group, and Schneider Electric (Bticino) holding significant shares, totaling approximately XX million in revenue in 2025. The report also examines the impact of recent M&A activities, with estimated deal values exceeding $XX million in the last five years, driving consolidation and market restructuring.
- Market Concentration: Moderately concentrated, with top three players holding approximately XX% market share in 2025.
- Innovation Catalysts: Advancements in IoT integration, smart grid technologies, and energy efficiency regulations are driving innovation.
- Regulatory Landscape: Stringent energy efficiency standards and grid modernization initiatives are shaping market growth.
- Substitute Products: Competition from alternative energy management solutions, though limited, warrants consideration.
- End-User Profiles: Key end-users include industrial facilities, commercial buildings, and residential sectors.
- M&A Activities: Significant M&A activity, with an estimated $XX million in deal value over the past five years, points towards market consolidation.
Din Rail Energy Manager Industry Evolution
This section charts the evolution of the Din Rail Energy Manager industry, analyzing market growth trajectories, technological advancements, and evolving consumer demands from 2019-2033. The market experienced a Compound Annual Growth Rate (CAGR) of XX% during the historical period (2019-2024), fueled by increasing awareness of energy efficiency and the adoption of smart energy solutions. The forecast period (2025-2033) anticipates a CAGR of XX%, driven by factors like the expansion of renewable energy sources and the growing adoption of smart home and building technologies. Adoption rates are projected to increase by XX% annually through 2033, surpassing XX million units. This growth is further supported by continuous technological advancements, particularly in areas such as improved data analytics, enhanced communication protocols, and increased integration with other building management systems.
Leading Regions, Countries, or Segments in Din Rail Energy Manager
This section identifies the dominant regions and segments within the Din Rail Energy Manager market. Analysis reveals that Europe and North America currently lead in terms of market share and adoption, driven by robust regulatory frameworks and high energy costs. However, Asia-Pacific is projected to witness the fastest growth, fueled by rapid urbanization and industrialization.
- Key Drivers in Europe & North America: Stringent energy efficiency regulations, high energy costs, and early adoption of smart technologies.
- Key Drivers in Asia-Pacific: Rapid urbanization, industrial growth, increasing government support for renewable energy initiatives, and cost-effectiveness of Din Rail Energy Managers.
- Dominance Factors: Strong regulatory support, high energy costs, established infrastructure, and a focus on energy efficiency.
Din Rail Energy Manager Product Innovations
Recent product innovations in Din Rail Energy Managers focus on enhanced energy monitoring capabilities, improved communication protocols (e.g., improved integration with cloud platforms and building management systems), and enhanced user interfaces for simplified operation and data visualization. These advancements contribute to increased energy efficiency and better cost management for end-users. Unique selling propositions include advanced algorithms for predictive analytics, enabling proactive energy optimization.
Propelling Factors for Din Rail Energy Manager Growth
Several factors contribute to the robust growth trajectory of the Din Rail Energy Manager market. These include increasing energy costs driving the need for efficient energy management, stringent government regulations promoting energy conservation, and the widespread adoption of smart home and building technologies. Furthermore, the continuous advancements in energy management solutions, fostering greater efficiency and cost savings, fuel the expansion of the market.
Obstacles in the Din Rail Energy Manager Market
Despite significant growth potential, several factors pose challenges. These include the high initial investment cost, potential supply chain disruptions impacting production and delivery, and the intensifying competition among established players and emerging entrants. These obstacles, though significant, are anticipated to be mitigated by ongoing technological advancements and evolving market dynamics.
Future Opportunities in Din Rail Energy Manager
Future opportunities lie in expanding into emerging markets, particularly in developing economies experiencing rapid industrialization and urbanization. The integration of artificial intelligence and machine learning for enhanced predictive analytics and automated energy management presents significant potential. Furthermore, the development of integrated energy management platforms offers exciting avenues for growth.
Major Players in the Din Rail Energy Manager Ecosystem
- ABB
- Hager Group
- Bticino
- Eelectron
- Mitsubishi
- Sharp Solar
- Orbis Technology Electric
- Technische Alternative
Key Developments in Din Rail Energy Manager Industry
- 2022 Q3: ABB launched its latest generation of Din Rail Energy Managers with enhanced IoT capabilities.
- 2023 Q1: Hager Group acquired a smaller competitor, expanding its market share and product portfolio.
- 2024 Q2: New energy efficiency regulations in the EU spurred increased demand for Din Rail Energy Managers.
Strategic Din Rail Energy Manager Market Forecast
The Din Rail Energy Manager market is poised for sustained growth over the forecast period (2025-2033), driven by continued technological advancements, rising energy costs, and supportive government regulations. The market's expansion will be largely influenced by the increased adoption in emerging economies and ongoing development of sophisticated energy management solutions with advanced features and functionalities. The potential for growth is substantial, with opportunities across various sectors and geographic regions.
Din Rail Energy Manager Segmentation
-
1. Application
- 1.1. Commercial
- 1.2. Residential
-
2. Type
- 2.1. Single Phase
- 2.2. Three Phase
Din Rail Energy Manager Segmentation By Geography
-
1. North America
- 1.1. United States
- 1.2. Canada
- 1.3. Mexico
-
2. South America
- 2.1. Brazil
- 2.2. Argentina
- 2.3. Rest of South America
-
3. Europe
- 3.1. United Kingdom
- 3.2. Germany
- 3.3. France
- 3.4. Italy
- 3.5. Spain
- 3.6. Russia
- 3.7. Benelux
- 3.8. Nordics
- 3.9. Rest of Europe
-
4. Middle East & Africa
- 4.1. Turkey
- 4.2. Israel
- 4.3. GCC
- 4.4. North Africa
- 4.5. South Africa
- 4.6. Rest of Middle East & Africa
-
5. Asia Pacific
- 5.1. China
- 5.2. India
- 5.3. Japan
- 5.4. South Korea
- 5.5. ASEAN
- 5.6. Oceania
- 5.7. Rest of Asia Pacific

Din Rail Energy Manager Regional Market Share
Geographic Coverage of Din Rail Energy Manager
Din Rail Energy Manager REPORT HIGHLIGHTS
| Aspects | Details |
|---|---|
| Study Period | 2020-2034 |
| Base Year | 2025 |
| Estimated Year | 2026 |
| Forecast Period | 2026-2034 |
| Historical Period | 2020-2025 |
| Growth Rate | CAGR of XXX% from 2020-2034 |
| Segmentation |
|
Table of Contents
- 1. Introduction
- 1.1. Research Scope
- 1.2. Market Segmentation
- 1.3. Research Objective
- 1.4. Definitions and Assumptions
- 2. Executive Summary
- 2.1. Market Snapshot
- 3. Market Dynamics
- 3.1. Market Drivers
- 3.2. Market Restrains
- 3.3. Market Trends
- 3.4. Market Opportunities
- 4. Market Factor Analysis
- 4.1. Porters Five Forces
- 4.1.1. Bargaining Power of Suppliers
- 4.1.2. Bargaining Power of Buyers
- 4.1.3. Threat of New Entrants
- 4.1.4. Threat of Substitutes
- 4.1.5. Competitive Rivalry
- 4.2. PESTEL analysis
- 4.3. BCG Analysis
- 4.3.1. Stars (High Growth, High Market Share)
- 4.3.2. Cash Cows (Low Growth, High Market Share)
- 4.3.3. Question Mark (High Growth, Low Market Share)
- 4.3.4. Dogs (Low Growth, Low Market Share)
- 4.4. Ansoff Matrix Analysis
- 4.5. Supply Chain Analysis
- 4.6. Regulatory Landscape
- 4.7. Current Market Potential and Opportunity Assessment (TAM–SAM–SOM Framework)
- 4.8. DMV Analyst Note
- 4.1. Porters Five Forces
- 5. Market Analysis, Insights and Forecast 2021-2033
- 5.1. Market Analysis, Insights and Forecast - by Application
- 5.1.1. Commercial
- 5.1.2. Residential
- 5.2. Market Analysis, Insights and Forecast - by Type
- 5.2.1. Single Phase
- 5.2.2. Three Phase
- 5.3. Market Analysis, Insights and Forecast - by Region
- 5.3.1. North America
- 5.3.2. South America
- 5.3.3. Europe
- 5.3.4. Middle East & Africa
- 5.3.5. Asia Pacific
- 5.1. Market Analysis, Insights and Forecast - by Application
- 6. Global Din Rail Energy Manager Analysis, Insights and Forecast, 2021-2033
- 6.1. Market Analysis, Insights and Forecast - by Application
- 6.1.1. Commercial
- 6.1.2. Residential
- 6.2. Market Analysis, Insights and Forecast - by Type
- 6.2.1. Single Phase
- 6.2.2. Three Phase
- 6.1. Market Analysis, Insights and Forecast - by Application
- 7. North America Din Rail Energy Manager Analysis, Insights and Forecast, 2020-2032
- 7.1. Market Analysis, Insights and Forecast - by Application
- 7.1.1. Commercial
- 7.1.2. Residential
- 7.2. Market Analysis, Insights and Forecast - by Type
- 7.2.1. Single Phase
- 7.2.2. Three Phase
- 7.1. Market Analysis, Insights and Forecast - by Application
- 8. South America Din Rail Energy Manager Analysis, Insights and Forecast, 2020-2032
- 8.1. Market Analysis, Insights and Forecast - by Application
- 8.1.1. Commercial
- 8.1.2. Residential
- 8.2. Market Analysis, Insights and Forecast - by Type
- 8.2.1. Single Phase
- 8.2.2. Three Phase
- 8.1. Market Analysis, Insights and Forecast - by Application
- 9. Europe Din Rail Energy Manager Analysis, Insights and Forecast, 2020-2032
- 9.1. Market Analysis, Insights and Forecast - by Application
- 9.1.1. Commercial
- 9.1.2. Residential
- 9.2. Market Analysis, Insights and Forecast - by Type
- 9.2.1. Single Phase
- 9.2.2. Three Phase
- 9.1. Market Analysis, Insights and Forecast - by Application
- 10. Middle East & Africa Din Rail Energy Manager Analysis, Insights and Forecast, 2020-2032
- 10.1. Market Analysis, Insights and Forecast - by Application
- 10.1.1. Commercial
- 10.1.2. Residential
- 10.2. Market Analysis, Insights and Forecast - by Type
- 10.2.1. Single Phase
- 10.2.2. Three Phase
- 10.1. Market Analysis, Insights and Forecast - by Application
- 11. Asia Pacific Din Rail Energy Manager Analysis, Insights and Forecast, 2020-2032
- 11.1. Market Analysis, Insights and Forecast - by Application
- 11.1.1. Commercial
- 11.1.2. Residential
- 11.2. Market Analysis, Insights and Forecast - by Type
- 11.2.1. Single Phase
- 11.2.2. Three Phase
- 11.1. Market Analysis, Insights and Forecast - by Application
- 12. Competitive Analysis
- 12.1. Company Profiles
- 12.1.1 ABB
- 12.1.1.1. Company Overview
- 12.1.1.2. Products
- 12.1.1.3. Company Financials
- 12.1.1.4. SWOT Analysis
- 12.1.2 Hager Group
- 12.1.2.1. Company Overview
- 12.1.2.2. Products
- 12.1.2.3. Company Financials
- 12.1.2.4. SWOT Analysis
- 12.1.3 Bticino
- 12.1.3.1. Company Overview
- 12.1.3.2. Products
- 12.1.3.3. Company Financials
- 12.1.3.4. SWOT Analysis
- 12.1.4 Eelectron
- 12.1.4.1. Company Overview
- 12.1.4.2. Products
- 12.1.4.3. Company Financials
- 12.1.4.4. SWOT Analysis
- 12.1.5 Mitsubishi
- 12.1.5.1. Company Overview
- 12.1.5.2. Products
- 12.1.5.3. Company Financials
- 12.1.5.4. SWOT Analysis
- 12.1.6 Sharp Solar
- 12.1.6.1. Company Overview
- 12.1.6.2. Products
- 12.1.6.3. Company Financials
- 12.1.6.4. SWOT Analysis
- 12.1.7 Orbis Technology Electric
- 12.1.7.1. Company Overview
- 12.1.7.2. Products
- 12.1.7.3. Company Financials
- 12.1.7.4. SWOT Analysis
- 12.1.8 Technische Alternative
- 12.1.8.1. Company Overview
- 12.1.8.2. Products
- 12.1.8.3. Company Financials
- 12.1.8.4. SWOT Analysis
- 12.1.1 ABB
- 12.2. Market Entropy
- 12.2.1 Company's Key Areas Served
- 12.2.2 Recent Developments
- 12.3. Company Market Share Analysis 2025
- 12.3.1 Top 5 Companies Market Share Analysis
- 12.3.2 Top 3 Companies Market Share Analysis
- 12.4. List of Potential Customers
- 13. Research Methodology
List of Figures
- Figure 1: Global Din Rail Energy Manager Revenue Breakdown (million, %) by Region 2025 & 2033
- Figure 2: North America Din Rail Energy Manager Revenue (million), by Application 2025 & 2033
- Figure 3: North America Din Rail Energy Manager Revenue Share (%), by Application 2025 & 2033
- Figure 4: North America Din Rail Energy Manager Revenue (million), by Type 2025 & 2033
- Figure 5: North America Din Rail Energy Manager Revenue Share (%), by Type 2025 & 2033
- Figure 6: North America Din Rail Energy Manager Revenue (million), by Country 2025 & 2033
- Figure 7: North America Din Rail Energy Manager Revenue Share (%), by Country 2025 & 2033
- Figure 8: South America Din Rail Energy Manager Revenue (million), by Application 2025 & 2033
- Figure 9: South America Din Rail Energy Manager Revenue Share (%), by Application 2025 & 2033
- Figure 10: South America Din Rail Energy Manager Revenue (million), by Type 2025 & 2033
- Figure 11: South America Din Rail Energy Manager Revenue Share (%), by Type 2025 & 2033
- Figure 12: South America Din Rail Energy Manager Revenue (million), by Country 2025 & 2033
- Figure 13: South America Din Rail Energy Manager Revenue Share (%), by Country 2025 & 2033
- Figure 14: Europe Din Rail Energy Manager Revenue (million), by Application 2025 & 2033
- Figure 15: Europe Din Rail Energy Manager Revenue Share (%), by Application 2025 & 2033
- Figure 16: Europe Din Rail Energy Manager Revenue (million), by Type 2025 & 2033
- Figure 17: Europe Din Rail Energy Manager Revenue Share (%), by Type 2025 & 2033
- Figure 18: Europe Din Rail Energy Manager Revenue (million), by Country 2025 & 2033
- Figure 19: Europe Din Rail Energy Manager Revenue Share (%), by Country 2025 & 2033
- Figure 20: Middle East & Africa Din Rail Energy Manager Revenue (million), by Application 2025 & 2033
- Figure 21: Middle East & Africa Din Rail Energy Manager Revenue Share (%), by Application 2025 & 2033
- Figure 22: Middle East & Africa Din Rail Energy Manager Revenue (million), by Type 2025 & 2033
- Figure 23: Middle East & Africa Din Rail Energy Manager Revenue Share (%), by Type 2025 & 2033
- Figure 24: Middle East & Africa Din Rail Energy Manager Revenue (million), by Country 2025 & 2033
- Figure 25: Middle East & Africa Din Rail Energy Manager Revenue Share (%), by Country 2025 & 2033
- Figure 26: Asia Pacific Din Rail Energy Manager Revenue (million), by Application 2025 & 2033
- Figure 27: Asia Pacific Din Rail Energy Manager Revenue Share (%), by Application 2025 & 2033
- Figure 28: Asia Pacific Din Rail Energy Manager Revenue (million), by Type 2025 & 2033
- Figure 29: Asia Pacific Din Rail Energy Manager Revenue Share (%), by Type 2025 & 2033
- Figure 30: Asia Pacific Din Rail Energy Manager Revenue (million), by Country 2025 & 2033
- Figure 31: Asia Pacific Din Rail Energy Manager Revenue Share (%), by Country 2025 & 2033
List of Tables
- Table 1: Global Din Rail Energy Manager Revenue million Forecast, by Application 2020 & 2033
- Table 2: Global Din Rail Energy Manager Revenue million Forecast, by Type 2020 & 2033
- Table 3: Global Din Rail Energy Manager Revenue million Forecast, by Region 2020 & 2033
- Table 4: Global Din Rail Energy Manager Revenue million Forecast, by Application 2020 & 2033
- Table 5: Global Din Rail Energy Manager Revenue million Forecast, by Type 2020 & 2033
- Table 6: Global Din Rail Energy Manager Revenue million Forecast, by Country 2020 & 2033
- Table 7: United States Din Rail Energy Manager Revenue (million) Forecast, by Application 2020 & 2033
- Table 8: Canada Din Rail Energy Manager Revenue (million) Forecast, by Application 2020 & 2033
- Table 9: Mexico Din Rail Energy Manager Revenue (million) Forecast, by Application 2020 & 2033
- Table 10: Global Din Rail Energy Manager Revenue million Forecast, by Application 2020 & 2033
- Table 11: Global Din Rail Energy Manager Revenue million Forecast, by Type 2020 & 2033
- Table 12: Global Din Rail Energy Manager Revenue million Forecast, by Country 2020 & 2033
- Table 13: Brazil Din Rail Energy Manager Revenue (million) Forecast, by Application 2020 & 2033
- Table 14: Argentina Din Rail Energy Manager Revenue (million) Forecast, by Application 2020 & 2033
- Table 15: Rest of South America Din Rail Energy Manager Revenue (million) Forecast, by Application 2020 & 2033
- Table 16: Global Din Rail Energy Manager Revenue million Forecast, by Application 2020 & 2033
- Table 17: Global Din Rail Energy Manager Revenue million Forecast, by Type 2020 & 2033
- Table 18: Global Din Rail Energy Manager Revenue million Forecast, by Country 2020 & 2033
- Table 19: United Kingdom Din Rail Energy Manager Revenue (million) Forecast, by Application 2020 & 2033
- Table 20: Germany Din Rail Energy Manager Revenue (million) Forecast, by Application 2020 & 2033
- Table 21: France Din Rail Energy Manager Revenue (million) Forecast, by Application 2020 & 2033
- Table 22: Italy Din Rail Energy Manager Revenue (million) Forecast, by Application 2020 & 2033
- Table 23: Spain Din Rail Energy Manager Revenue (million) Forecast, by Application 2020 & 2033
- Table 24: Russia Din Rail Energy Manager Revenue (million) Forecast, by Application 2020 & 2033
- Table 25: Benelux Din Rail Energy Manager Revenue (million) Forecast, by Application 2020 & 2033
- Table 26: Nordics Din Rail Energy Manager Revenue (million) Forecast, by Application 2020 & 2033
- Table 27: Rest of Europe Din Rail Energy Manager Revenue (million) Forecast, by Application 2020 & 2033
- Table 28: Global Din Rail Energy Manager Revenue million Forecast, by Application 2020 & 2033
- Table 29: Global Din Rail Energy Manager Revenue million Forecast, by Type 2020 & 2033
- Table 30: Global Din Rail Energy Manager Revenue million Forecast, by Country 2020 & 2033
- Table 31: Turkey Din Rail Energy Manager Revenue (million) Forecast, by Application 2020 & 2033
- Table 32: Israel Din Rail Energy Manager Revenue (million) Forecast, by Application 2020 & 2033
- Table 33: GCC Din Rail Energy Manager Revenue (million) Forecast, by Application 2020 & 2033
- Table 34: North Africa Din Rail Energy Manager Revenue (million) Forecast, by Application 2020 & 2033
- Table 35: South Africa Din Rail Energy Manager Revenue (million) Forecast, by Application 2020 & 2033
- Table 36: Rest of Middle East & Africa Din Rail Energy Manager Revenue (million) Forecast, by Application 2020 & 2033
- Table 37: Global Din Rail Energy Manager Revenue million Forecast, by Application 2020 & 2033
- Table 38: Global Din Rail Energy Manager Revenue million Forecast, by Type 2020 & 2033
- Table 39: Global Din Rail Energy Manager Revenue million Forecast, by Country 2020 & 2033
- Table 40: China Din Rail Energy Manager Revenue (million) Forecast, by Application 2020 & 2033
- Table 41: India Din Rail Energy Manager Revenue (million) Forecast, by Application 2020 & 2033
- Table 42: Japan Din Rail Energy Manager Revenue (million) Forecast, by Application 2020 & 2033
- Table 43: South Korea Din Rail Energy Manager Revenue (million) Forecast, by Application 2020 & 2033
- Table 44: ASEAN Din Rail Energy Manager Revenue (million) Forecast, by Application 2020 & 2033
- Table 45: Oceania Din Rail Energy Manager Revenue (million) Forecast, by Application 2020 & 2033
- Table 46: Rest of Asia Pacific Din Rail Energy Manager Revenue (million) Forecast, by Application 2020 & 2033
Frequently Asked Questions
1. What is the projected Compound Annual Growth Rate (CAGR) of the Din Rail Energy Manager?
The projected CAGR is approximately XXX%.
2. Which companies are prominent players in the Din Rail Energy Manager?
Key companies in the market include ABB, Hager Group, Bticino, Eelectron, Mitsubishi, Sharp Solar, Orbis Technology Electric, Technische Alternative.
3. What are the main segments of the Din Rail Energy Manager?
The market segments include Application, Type.
4. Can you provide details about the market size?
The market size is estimated to be USD XXX million as of 2022.
5. What are some drivers contributing to market growth?
N/A
6. What are the notable trends driving market growth?
N/A
7. Are there any restraints impacting market growth?
N/A
8. Can you provide examples of recent developments in the market?
N/A
9. What pricing options are available for accessing the report?
Pricing options include single-user, multi-user, and enterprise licenses priced at USD 2900.00, USD 4350.00, and USD 5800.00 respectively.
10. Is the market size provided in terms of value or volume?
The market size is provided in terms of value, measured in million.
11. Are there any specific market keywords associated with the report?
Yes, the market keyword associated with the report is "Din Rail Energy Manager," which aids in identifying and referencing the specific market segment covered.
12. How do I determine which pricing option suits my needs best?
The pricing options vary based on user requirements and access needs. Individual users may opt for single-user licenses, while businesses requiring broader access may choose multi-user or enterprise licenses for cost-effective access to the report.
13. Are there any additional resources or data provided in the Din Rail Energy Manager report?
While the report offers comprehensive insights, it's advisable to review the specific contents or supplementary materials provided to ascertain if additional resources or data are available.
14. How can I stay updated on further developments or reports in the Din Rail Energy Manager?
To stay informed about further developments, trends, and reports in the Din Rail Energy Manager, consider subscribing to industry newsletters, following relevant companies and organizations, or regularly checking reputable industry news sources and publications.
Methodology
Step 1 - Identification of Relevant Samples Size from Population Database


Step 2 - Approaches for Defining Global Market Size (Value, Volume* & Price*)

Note*: In applicable scenarios
Step 3 - Data Sources
Primary Research
- Web Analytics
- Survey Reports
- Research Institute
- Latest Research Reports
- Opinion Leaders
Secondary Research
- Annual Reports
- White Paper
- Latest Press Release
- Industry Association
- Paid Database
- Investor Presentations

Step 4 - Data Triangulation
Involves using different sources of information in order to increase the validity of a study
These sources are likely to be stakeholders in a program - participants, other researchers, program staff, other community members, and so on.
Then we put all data in single framework & apply various statistical tools to find out the dynamic on the market.
During the analysis stage, feedback from the stakeholder groups would be compared to determine areas of agreement as well as areas of divergence