

Key Insights
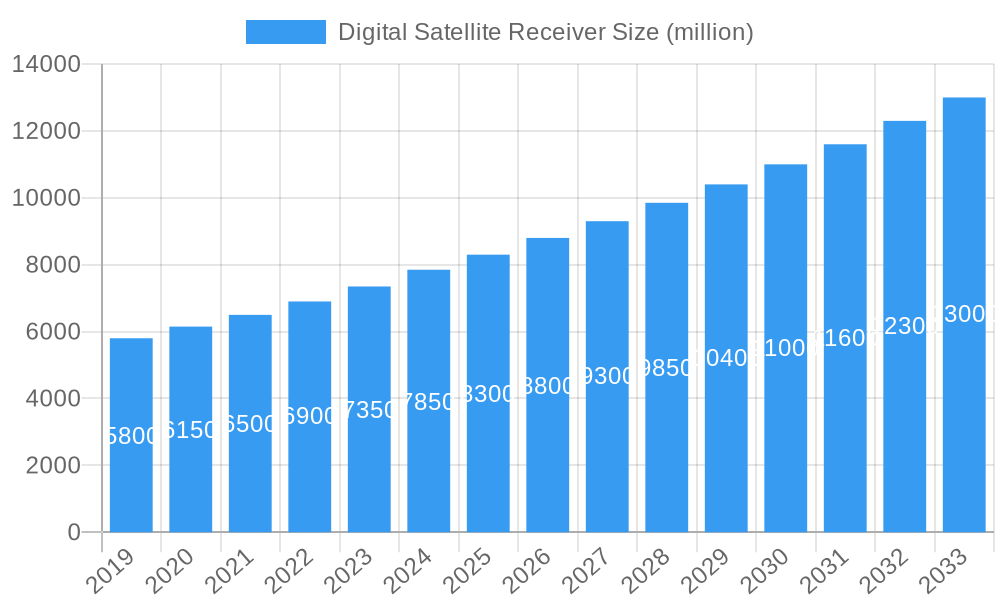
The Digital Satellite Receiver market is projected to reach USD 8.15 billion by 2025, exhibiting a Compound Annual Growth Rate (CAGR) of 12.08% during the forecast period (2025-2033). This expansion is driven by the growing consumer demand for high-definition content and the global proliferation of digital television services. Advancements in receiver technology are enhancing viewing experiences, with increased adoption of solutions offering superior picture quality and expanded channel offerings. Emerging economies present significant growth potential through infrastructure upgrades and increased digital TV access. The integration of satellite receivers into smart home ecosystems further enhances their value as comprehensive entertainment hubs.
Digital Satellite Receiver Market Size (In Billion)
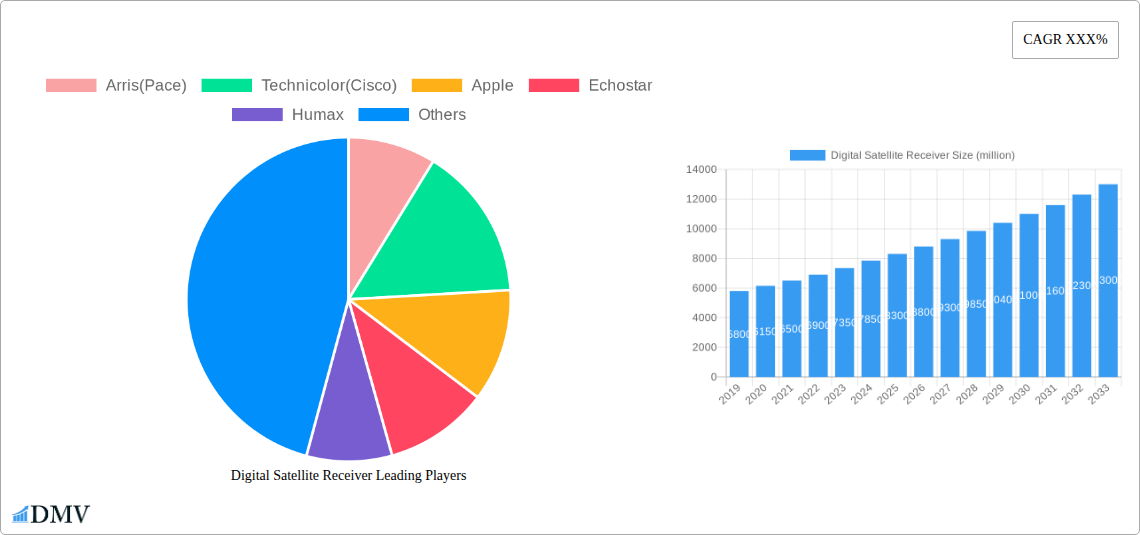
Key growth catalysts include the global shift from analog to digital broadcasting, supportive government digital TV adoption initiatives, and continuous technological innovation, including 4K Ultra HD support and advanced connectivity. The Residential Use segment leads market demand, supported by widespread availability of digital satellite TV packages. Commercial sectors, such as hospitality, also contribute to growth by offering enhanced entertainment options. Primary market segments include Digital Cable, Satellite Digital, and IPTV. Leading industry players like Arris (Pace), Technicolor (Cisco), Apple, Echostar, and Samsung are actively investing in R&D for sophisticated and user-friendly receivers. While the market is dynamic, the rise of Over-The-Top (OTT) streaming services and improving internet speeds present potential challenges, requiring ongoing innovation from manufacturers.
Digital Satellite Receiver Company Market Share
Digital Satellite Receiver Market Composition & Trends
The global Digital Satellite Receiver market is characterized by a moderate to high concentration, with a few key players holding significant market share. Innovation catalysts such as the increasing demand for high-definition (HD) and ultra-high-definition (UHD) content, coupled with the integration of smart TV features and internet connectivity, are driving rapid advancements. The regulatory landscape, while varied across regions, generally favors the adoption of digital broadcasting standards to improve spectrum efficiency and enhance viewer experiences. Substitute products like IPTV and OTT streaming services present a competitive challenge, but dedicated satellite receivers continue to offer advantages in terms of signal stability, accessibility in remote areas, and often a broader range of niche channels. End-user profiles are diverse, encompassing both mass-market residential consumers seeking affordable entertainment solutions and commercial entities requiring reliable broadcasting for hospitality, public spaces, and specialized industries. Mergers and acquisitions (M&A) activity, valued in the high hundreds of millions, has been observed as companies aim to consolidate market position, acquire new technologies, and expand their geographical reach. For instance, the combined market share of top players is estimated to be over 700 million units annually, with M&A deals in the historical period reaching values upwards of 50 million.
- Market Concentration: Dominated by key manufacturers, indicating a competitive yet consolidated landscape.
- Innovation Drivers: HD/UHD content, smart features, internet connectivity, and evolving broadcast technologies.
- Regulatory Influence: Standards adoption, spectrum management, and content distribution policies.
- Substitute Threat: IPTV and OTT services, though satellite receivers maintain niche advantages.
- End-User Segments: Residential consumers and diverse commercial applications.
- M&A Activity: Strategic consolidation to enhance market presence and technological capabilities, with historical deal values in the tens of millions.
Digital Satellite Receiver Industry Evolution
The Digital Satellite Receiver industry has undergone a dramatic transformation, moving from analog to digital broadcasting over the historical period (2019–2024) and setting the stage for continued evolution through 2033. This shift was primarily driven by the inherent advantages of digital technology, including superior picture and sound quality, increased channel capacity, and the enablement of interactive services. Market growth trajectories during the historical period saw a steady upward trend, averaging a compound annual growth rate (CAGR) of approximately 5.5%, with unit sales reaching over 300 million in 2024. Technological advancements have been relentless, with the introduction of High Definition (HD), Full HD, and subsequently 4K Ultra High Definition (UHD) reception capabilities becoming standard. Further innovations include the integration of smart functionalities, enabling access to internet-based applications, streaming services, and personalized content recommendations directly through the receiver. The adoption of newer codecs like HEVC (High Efficiency Video Coding) has also played a crucial role in optimizing bandwidth, allowing for more channels or higher quality streams. Shifting consumer demands have mirrored these technological leaps, with users increasingly expecting seamless integration with their home entertainment systems, user-friendly interfaces, and access to a vast array of content beyond traditional broadcast channels. The base year, 2025, is anticipated to witness continued demand for advanced satellite receivers, with an estimated market size of over 350 million units. The forecast period (2025–2033) projects sustained growth, albeit at a more moderate pace of around 3.8% CAGR, as the market matures and other digital distribution methods gain further traction. The focus will shift towards more advanced features such as AI-powered content discovery, enhanced connectivity options, and specialized receivers catering to niche markets or emerging broadcast standards. The overall industry evolution showcases a dynamic interplay between technological innovation, regulatory push, and evolving consumer preferences, shaping a market that, while mature in its core function, continues to innovate and adapt.
Leading Regions, Countries, or Segments in Digital Satellite Receiver
The global Digital Satellite Receiver market exhibits distinct leadership across various regions, countries, and application segments, driven by a confluence of socioeconomic, technological, and regulatory factors. Among the application segments, Residential Use has consistently dominated the market, accounting for an estimated 75% of all digital satellite receiver deployments. This dominance is fueled by the ever-growing demand for affordable and reliable entertainment solutions in households worldwide, particularly in developing economies where terrestrial broadcasting infrastructure may be less robust. The widespread availability of satellite television packages offering a wide array of channels at competitive price points makes it an attractive option for millions of consumers.
Within the Type segment, Satellite Digital receivers naturally hold the largest share, given the core function of the product. However, the lines are blurring as convergence technologies integrate multiple reception methods. In terms of geographical leadership, Asia Pacific has emerged as the largest and fastest-growing region, driven by a massive population, increasing disposable incomes, and significant investments in broadcasting infrastructure. Countries like China and India are major contributors, with their large rural populations and ongoing efforts to expand digital television access. The region's leadership is further bolstered by robust manufacturing capabilities, leading to competitive pricing of digital satellite receivers.
- Dominant Application: Residential Use (approx. 75% market share)
- Key Drivers: Growing demand for affordable entertainment, extensive channel offerings, improved living standards, and accessibility in remote areas.
- Investment Trends: Continued investment by satellite broadcasters in expanding channel portfolios and bundled service offerings targeting households.
- Regulatory Support: Government initiatives to promote digital television adoption and phase out analog broadcasting have significantly boosted residential uptake.
- Dominant Type: Satellite Digital Receivers
- Key Drivers: The fundamental technology for receiving satellite broadcasts, offering consistent signal quality and wide coverage.
- Technological Advancements: Integration of advanced features like PVR capabilities, smart TV integration, and support for multiple HD/UHD formats.
- Leading Region: Asia Pacific
- Key Drivers: Large population base, rapid economic development, increasing digital literacy, and government push for digital broadcasting.
- Country-Specific Dominance: China and India are major markets, supported by local manufacturing and extensive distribution networks.
- Investment Trends: Significant infrastructure investments by satellite operators and content providers to cater to the burgeoning demand.
- Regulatory Support: Favorable government policies promoting digital TV penetration and spectrum management to enhance broadcasting efficiency.
The Commercial Use segment, though smaller, is a crucial growth area, encompassing hospitality, public transportation, and corporate environments. The demand here is driven by the need for reliable, high-quality content delivery for customer engagement and internal communications. Emerging markets in Africa and Latin America are also showing considerable growth potential due to ongoing digital migration and the expansion of satellite TV services. The interplay of these factors ensures a dynamic and evolving landscape for digital satellite receivers globally.
Digital Satellite Receiver Product Innovations
Digital satellite receivers are no longer just passive signal decoders; they are evolving into sophisticated entertainment hubs. Key product innovations revolve around enhanced connectivity, enabling seamless integration with the internet for accessing Over-The-Top (OTT) streaming services, on-demand content, and interactive applications. The drive towards higher visual fidelity has led to the widespread adoption of 4K Ultra High Definition (UHD) and High Dynamic Range (HDR) support, delivering unparalleled picture clarity and vibrant colors. Many modern receivers also feature built-in PVR (Personal Video Recorder) capabilities, allowing users to record, pause, and rewind live TV, often with large storage capacities. Furthermore, advancements in user interfaces (UI) and user experience (UX) are making navigation intuitive and personalized, with features like AI-powered content recommendations and voice control becoming increasingly common. Performance metrics are continually improving, with faster channel switching, quicker boot-up times, and more efficient power consumption. The integration of hybrid tuners, capable of receiving both satellite and terrestrial digital signals, further enhances their versatility.
Propelling Factors for Digital Satellite Receiver Growth
The growth of the digital satellite receiver market is propelled by several key factors. Firstly, the increasing demand for high-quality content, including HD and UHD broadcasts, remains a primary driver, with consumers seeking premium viewing experiences. Secondly, penetration in emerging economies continues to be significant, as satellite technology offers a cost-effective way to deliver a wide range of channels to underserved populations where terrestrial infrastructure is limited. Thirdly, technological advancements, such as the integration of smart TV functionalities, PVR capabilities, and improved energy efficiency, enhance the value proposition for consumers. Finally, government initiatives and regulatory policies promoting digital broadcasting and spectrum efficiency often accelerate the adoption of digital satellite receivers.
- Content Demand: Growing appetite for HD and UHD programming.
- Emerging Market Penetration: Expansion of services in developing regions.
- Technological Integration: Smart features, PVR, and energy efficiency.
- Regulatory Support: Government push for digital broadcasting.
Obstacles in the Digital Satellite Receiver Market
Despite robust growth, the digital satellite receiver market faces several obstacles. The most significant is the intensifying competition from Over-The-Top (OTT) streaming services like Netflix and Amazon Prime Video, which offer on-demand content and are perceived as more flexible by some consumers. High initial setup costs and subscription fees for satellite packages can also be a barrier, especially in price-sensitive markets. Rapid technological obsolescence, driven by the constant evolution of broadcast standards and display technologies, necessitates frequent upgrades, adding to the overall cost for consumers. Furthermore, regulatory hurdles and licensing complexities in different countries can slow down market expansion. Supply chain disruptions, as experienced globally in recent years, can impact manufacturing and distribution, leading to increased costs and availability issues.
- OTT Competition: Increasing preference for on-demand streaming.
- Cost Barriers: High initial investment and ongoing subscription fees.
- Technological Obsolescence: Need for frequent upgrades.
- Regulatory Complexities: Varied licensing and broadcasting laws.
- Supply Chain Issues: Production and distribution challenges.
Future Opportunities in Digital Satellite Receiver
The digital satellite receiver market is ripe with future opportunities. The ongoing shift towards 5G deployment presents an opportunity for hybrid receivers that can seamlessly integrate satellite and terrestrial 5G broadcasting, offering faster speeds and more diverse content options. The growing adoption of the Internet of Things (IoT) ecosystem creates a niche for smart satellite receivers that can act as central hubs for connected home devices. Furthermore, the demand for specialized receivers catering to niche markets, such as professional broadcasting, aviation, or maritime use, remains a significant growth avenue. Emerging markets continue to offer substantial untapped potential as digital television penetration expands. The development of more energy-efficient and eco-friendly receivers will also cater to environmentally conscious consumers.
- Hybrid Integration: Combining satellite with 5G broadcasting.
- IoT Hub Functionality: Smart receivers for connected homes.
- Niche Market Specialization: Catering to specific industries.
- Emerging Market Expansion: Untapped potential in developing regions.
- Sustainable Technology: Focus on energy efficiency and eco-friendly designs.
Major Players in the Digital Satellite Receiver Ecosystem
- Arris(Pace)
- Technicolor(Cisco)
- Apple
- Echostar
- Humax
- Sagemcom
- Toshiba
- Panasonic
- Samsung
- Roku
- Skyworth
- Huawei
- Sichuan Jiuzhou Electronic Technology
- Coship
- Changhong
- ZTE
- Hisense
Key Developments in Digital Satellite Receiver Industry
- 2019: Increased adoption of HEVC codec for more efficient HD and UHD broadcasting.
- 2020: Rise in smart satellite receivers with integrated streaming app support, driven by increased home entertainment consumption.
- 2021: Focus on PVR capabilities with larger storage and advanced recording features.
- 2022: Introduction of satellite receivers with improved energy efficiency standards.
- 2023: Growing trend towards hybrid tuners supporting multiple broadcast standards (satellite, terrestrial, IPTV).
- 2024: Enhancements in user interface (UI) and user experience (UX) with AI-driven content recommendations becoming more prevalent.
- 2025 (Estimated): Anticipated launch of next-generation receivers with enhanced 8K UHD support and advanced connectivity options.
Strategic Digital Satellite Receiver Market Forecast
The strategic digital satellite receiver market forecast indicates continued, albeit moderating, growth driven by the persistent demand for high-quality broadcast content and the expansion of services in emerging markets. Key growth catalysts include the integration of advanced smart TV functionalities, enabling a more connected entertainment experience, and the development of hybrid receivers that can seamlessly blend satellite reception with IPTV and OTT services. The ongoing advancements in video compression technologies and the increasing affordability of UHD displays will further fuel the demand for receivers capable of supporting these higher resolutions. Strategic investments by major players in research and development, focusing on user experience, connectivity, and backward compatibility with existing infrastructure, will be crucial in navigating the competitive landscape and capitalizing on future opportunities in this dynamic sector. The market is poised to benefit from increased digital literacy and disposable incomes in developing regions, solidifying its long-term potential.
Digital Satellite Receiver Segmentation
-
1. Application
- 1.1. Residential Use
- 1.2. Commercial Use
- 1.3. Others
-
2. Type
- 2.1. Digital Cable
- 2.2. Satellite Digital
- 2.3. Terrestrial Digital
- 2.4. IPTV
- 2.5. OTT
- 2.6. Others
Digital Satellite Receiver Segmentation By Geography
-
1. North America
- 1.1. United States
- 1.2. Canada
- 1.3. Mexico
-
2. South America
- 2.1. Brazil
- 2.2. Argentina
- 2.3. Rest of South America
-
3. Europe
- 3.1. United Kingdom
- 3.2. Germany
- 3.3. France
- 3.4. Italy
- 3.5. Spain
- 3.6. Russia
- 3.7. Benelux
- 3.8. Nordics
- 3.9. Rest of Europe
-
4. Middle East & Africa
- 4.1. Turkey
- 4.2. Israel
- 4.3. GCC
- 4.4. North Africa
- 4.5. South Africa
- 4.6. Rest of Middle East & Africa
-
5. Asia Pacific
- 5.1. China
- 5.2. India
- 5.3. Japan
- 5.4. South Korea
- 5.5. ASEAN
- 5.6. Oceania
- 5.7. Rest of Asia Pacific
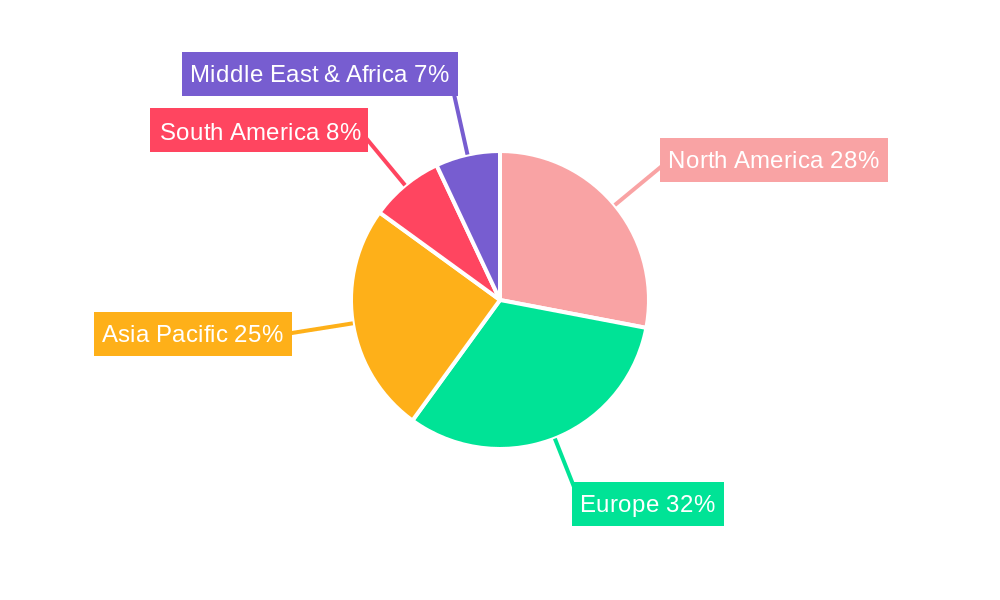
Digital Satellite Receiver Regional Market Share
Geographic Coverage of Digital Satellite Receiver
Digital Satellite Receiver REPORT HIGHLIGHTS
| Aspects | Details |
|---|---|
| Study Period | 2020-2034 |
| Base Year | 2025 |
| Estimated Year | 2026 |
| Forecast Period | 2026-2034 |
| Historical Period | 2020-2025 |
| Growth Rate | CAGR of 12.08% from 2020-2034 |
| Segmentation |
|
Table of Contents
- 1. Introduction
- 1.1. Research Scope
- 1.2. Market Segmentation
- 1.3. Research Objective
- 1.4. Definitions and Assumptions
- 2. Executive Summary
- 2.1. Market Snapshot
- 3. Market Dynamics
- 3.1. Market Drivers
- 3.2. Market Restrains
- 3.3. Market Trends
- 3.4. Market Opportunities
- 4. Market Factor Analysis
- 4.1. Porters Five Forces
- 4.1.1. Bargaining Power of Suppliers
- 4.1.2. Bargaining Power of Buyers
- 4.1.3. Threat of New Entrants
- 4.1.4. Threat of Substitutes
- 4.1.5. Competitive Rivalry
- 4.2. PESTEL analysis
- 4.3. BCG Analysis
- 4.3.1. Stars (High Growth, High Market Share)
- 4.3.2. Cash Cows (Low Growth, High Market Share)
- 4.3.3. Question Mark (High Growth, Low Market Share)
- 4.3.4. Dogs (Low Growth, Low Market Share)
- 4.4. Ansoff Matrix Analysis
- 4.5. Supply Chain Analysis
- 4.6. Regulatory Landscape
- 4.7. Current Market Potential and Opportunity Assessment (TAM–SAM–SOM Framework)
- 4.8. DMV Analyst Note
- 4.1. Porters Five Forces
- 5. Market Analysis, Insights and Forecast 2021-2033
- 5.1. Market Analysis, Insights and Forecast - by Application
- 5.1.1. Residential Use
- 5.1.2. Commercial Use
- 5.1.3. Others
- 5.2. Market Analysis, Insights and Forecast - by Type
- 5.2.1. Digital Cable
- 5.2.2. Satellite Digital
- 5.2.3. Terrestrial Digital
- 5.2.4. IPTV
- 5.2.5. OTT
- 5.2.6. Others
- 5.3. Market Analysis, Insights and Forecast - by Region
- 5.3.1. North America
- 5.3.2. South America
- 5.3.3. Europe
- 5.3.4. Middle East & Africa
- 5.3.5. Asia Pacific
- 5.1. Market Analysis, Insights and Forecast - by Application
- 6. Global Digital Satellite Receiver Analysis, Insights and Forecast, 2021-2033
- 6.1. Market Analysis, Insights and Forecast - by Application
- 6.1.1. Residential Use
- 6.1.2. Commercial Use
- 6.1.3. Others
- 6.2. Market Analysis, Insights and Forecast - by Type
- 6.2.1. Digital Cable
- 6.2.2. Satellite Digital
- 6.2.3. Terrestrial Digital
- 6.2.4. IPTV
- 6.2.5. OTT
- 6.2.6. Others
- 6.1. Market Analysis, Insights and Forecast - by Application
- 7. North America Digital Satellite Receiver Analysis, Insights and Forecast, 2020-2032
- 7.1. Market Analysis, Insights and Forecast - by Application
- 7.1.1. Residential Use
- 7.1.2. Commercial Use
- 7.1.3. Others
- 7.2. Market Analysis, Insights and Forecast - by Type
- 7.2.1. Digital Cable
- 7.2.2. Satellite Digital
- 7.2.3. Terrestrial Digital
- 7.2.4. IPTV
- 7.2.5. OTT
- 7.2.6. Others
- 7.1. Market Analysis, Insights and Forecast - by Application
- 8. South America Digital Satellite Receiver Analysis, Insights and Forecast, 2020-2032
- 8.1. Market Analysis, Insights and Forecast - by Application
- 8.1.1. Residential Use
- 8.1.2. Commercial Use
- 8.1.3. Others
- 8.2. Market Analysis, Insights and Forecast - by Type
- 8.2.1. Digital Cable
- 8.2.2. Satellite Digital
- 8.2.3. Terrestrial Digital
- 8.2.4. IPTV
- 8.2.5. OTT
- 8.2.6. Others
- 8.1. Market Analysis, Insights and Forecast - by Application
- 9. Europe Digital Satellite Receiver Analysis, Insights and Forecast, 2020-2032
- 9.1. Market Analysis, Insights and Forecast - by Application
- 9.1.1. Residential Use
- 9.1.2. Commercial Use
- 9.1.3. Others
- 9.2. Market Analysis, Insights and Forecast - by Type
- 9.2.1. Digital Cable
- 9.2.2. Satellite Digital
- 9.2.3. Terrestrial Digital
- 9.2.4. IPTV
- 9.2.5. OTT
- 9.2.6. Others
- 9.1. Market Analysis, Insights and Forecast - by Application
- 10. Middle East & Africa Digital Satellite Receiver Analysis, Insights and Forecast, 2020-2032
- 10.1. Market Analysis, Insights and Forecast - by Application
- 10.1.1. Residential Use
- 10.1.2. Commercial Use
- 10.1.3. Others
- 10.2. Market Analysis, Insights and Forecast - by Type
- 10.2.1. Digital Cable
- 10.2.2. Satellite Digital
- 10.2.3. Terrestrial Digital
- 10.2.4. IPTV
- 10.2.5. OTT
- 10.2.6. Others
- 10.1. Market Analysis, Insights and Forecast - by Application
- 11. Asia Pacific Digital Satellite Receiver Analysis, Insights and Forecast, 2020-2032
- 11.1. Market Analysis, Insights and Forecast - by Application
- 11.1.1. Residential Use
- 11.1.2. Commercial Use
- 11.1.3. Others
- 11.2. Market Analysis, Insights and Forecast - by Type
- 11.2.1. Digital Cable
- 11.2.2. Satellite Digital
- 11.2.3. Terrestrial Digital
- 11.2.4. IPTV
- 11.2.5. OTT
- 11.2.6. Others
- 11.1. Market Analysis, Insights and Forecast - by Application
- 12. Competitive Analysis
- 12.1. Company Profiles
- 12.1.1 Arris(Pace)
- 12.1.1.1. Company Overview
- 12.1.1.2. Products
- 12.1.1.3. Company Financials
- 12.1.1.4. SWOT Analysis
- 12.1.2 Technicolor(Cisco)
- 12.1.2.1. Company Overview
- 12.1.2.2. Products
- 12.1.2.3. Company Financials
- 12.1.2.4. SWOT Analysis
- 12.1.3 Apple
- 12.1.3.1. Company Overview
- 12.1.3.2. Products
- 12.1.3.3. Company Financials
- 12.1.3.4. SWOT Analysis
- 12.1.4 Echostar
- 12.1.4.1. Company Overview
- 12.1.4.2. Products
- 12.1.4.3. Company Financials
- 12.1.4.4. SWOT Analysis
- 12.1.5 Humax
- 12.1.5.1. Company Overview
- 12.1.5.2. Products
- 12.1.5.3. Company Financials
- 12.1.5.4. SWOT Analysis
- 12.1.6 Sagemcom
- 12.1.6.1. Company Overview
- 12.1.6.2. Products
- 12.1.6.3. Company Financials
- 12.1.6.4. SWOT Analysis
- 12.1.7 Toshiba
- 12.1.7.1. Company Overview
- 12.1.7.2. Products
- 12.1.7.3. Company Financials
- 12.1.7.4. SWOT Analysis
- 12.1.8 Panasonic
- 12.1.8.1. Company Overview
- 12.1.8.2. Products
- 12.1.8.3. Company Financials
- 12.1.8.4. SWOT Analysis
- 12.1.9 Samsung
- 12.1.9.1. Company Overview
- 12.1.9.2. Products
- 12.1.9.3. Company Financials
- 12.1.9.4. SWOT Analysis
- 12.1.10 Roku
- 12.1.10.1. Company Overview
- 12.1.10.2. Products
- 12.1.10.3. Company Financials
- 12.1.10.4. SWOT Analysis
- 12.1.11 Skyworth
- 12.1.11.1. Company Overview
- 12.1.11.2. Products
- 12.1.11.3. Company Financials
- 12.1.11.4. SWOT Analysis
- 12.1.12 Huawei
- 12.1.12.1. Company Overview
- 12.1.12.2. Products
- 12.1.12.3. Company Financials
- 12.1.12.4. SWOT Analysis
- 12.1.13 Sichuan Jiuzhou Electronic Technology
- 12.1.13.1. Company Overview
- 12.1.13.2. Products
- 12.1.13.3. Company Financials
- 12.1.13.4. SWOT Analysis
- 12.1.14 Coship
- 12.1.14.1. Company Overview
- 12.1.14.2. Products
- 12.1.14.3. Company Financials
- 12.1.14.4. SWOT Analysis
- 12.1.15 Changhong
- 12.1.15.1. Company Overview
- 12.1.15.2. Products
- 12.1.15.3. Company Financials
- 12.1.15.4. SWOT Analysis
- 12.1.16 ZTE
- 12.1.16.1. Company Overview
- 12.1.16.2. Products
- 12.1.16.3. Company Financials
- 12.1.16.4. SWOT Analysis
- 12.1.17 Hisense
- 12.1.17.1. Company Overview
- 12.1.17.2. Products
- 12.1.17.3. Company Financials
- 12.1.17.4. SWOT Analysis
- 12.1.1 Arris(Pace)
- 12.2. Market Entropy
- 12.2.1 Company's Key Areas Served
- 12.2.2 Recent Developments
- 12.3. Company Market Share Analysis 2025
- 12.3.1 Top 5 Companies Market Share Analysis
- 12.3.2 Top 3 Companies Market Share Analysis
- 12.4. List of Potential Customers
- 13. Research Methodology
List of Figures
- Figure 1: Global Digital Satellite Receiver Revenue Breakdown (billion, %) by Region 2025 & 2033
- Figure 2: Global Digital Satellite Receiver Volume Breakdown (K, %) by Region 2025 & 2033
- Figure 3: North America Digital Satellite Receiver Revenue (billion), by Application 2025 & 2033
- Figure 4: North America Digital Satellite Receiver Volume (K), by Application 2025 & 2033
- Figure 5: North America Digital Satellite Receiver Revenue Share (%), by Application 2025 & 2033
- Figure 6: North America Digital Satellite Receiver Volume Share (%), by Application 2025 & 2033
- Figure 7: North America Digital Satellite Receiver Revenue (billion), by Type 2025 & 2033
- Figure 8: North America Digital Satellite Receiver Volume (K), by Type 2025 & 2033
- Figure 9: North America Digital Satellite Receiver Revenue Share (%), by Type 2025 & 2033
- Figure 10: North America Digital Satellite Receiver Volume Share (%), by Type 2025 & 2033
- Figure 11: North America Digital Satellite Receiver Revenue (billion), by Country 2025 & 2033
- Figure 12: North America Digital Satellite Receiver Volume (K), by Country 2025 & 2033
- Figure 13: North America Digital Satellite Receiver Revenue Share (%), by Country 2025 & 2033
- Figure 14: North America Digital Satellite Receiver Volume Share (%), by Country 2025 & 2033
- Figure 15: South America Digital Satellite Receiver Revenue (billion), by Application 2025 & 2033
- Figure 16: South America Digital Satellite Receiver Volume (K), by Application 2025 & 2033
- Figure 17: South America Digital Satellite Receiver Revenue Share (%), by Application 2025 & 2033
- Figure 18: South America Digital Satellite Receiver Volume Share (%), by Application 2025 & 2033
- Figure 19: South America Digital Satellite Receiver Revenue (billion), by Type 2025 & 2033
- Figure 20: South America Digital Satellite Receiver Volume (K), by Type 2025 & 2033
- Figure 21: South America Digital Satellite Receiver Revenue Share (%), by Type 2025 & 2033
- Figure 22: South America Digital Satellite Receiver Volume Share (%), by Type 2025 & 2033
- Figure 23: South America Digital Satellite Receiver Revenue (billion), by Country 2025 & 2033
- Figure 24: South America Digital Satellite Receiver Volume (K), by Country 2025 & 2033
- Figure 25: South America Digital Satellite Receiver Revenue Share (%), by Country 2025 & 2033
- Figure 26: South America Digital Satellite Receiver Volume Share (%), by Country 2025 & 2033
- Figure 27: Europe Digital Satellite Receiver Revenue (billion), by Application 2025 & 2033
- Figure 28: Europe Digital Satellite Receiver Volume (K), by Application 2025 & 2033
- Figure 29: Europe Digital Satellite Receiver Revenue Share (%), by Application 2025 & 2033
- Figure 30: Europe Digital Satellite Receiver Volume Share (%), by Application 2025 & 2033
- Figure 31: Europe Digital Satellite Receiver Revenue (billion), by Type 2025 & 2033
- Figure 32: Europe Digital Satellite Receiver Volume (K), by Type 2025 & 2033
- Figure 33: Europe Digital Satellite Receiver Revenue Share (%), by Type 2025 & 2033
- Figure 34: Europe Digital Satellite Receiver Volume Share (%), by Type 2025 & 2033
- Figure 35: Europe Digital Satellite Receiver Revenue (billion), by Country 2025 & 2033
- Figure 36: Europe Digital Satellite Receiver Volume (K), by Country 2025 & 2033
- Figure 37: Europe Digital Satellite Receiver Revenue Share (%), by Country 2025 & 2033
- Figure 38: Europe Digital Satellite Receiver Volume Share (%), by Country 2025 & 2033
- Figure 39: Middle East & Africa Digital Satellite Receiver Revenue (billion), by Application 2025 & 2033
- Figure 40: Middle East & Africa Digital Satellite Receiver Volume (K), by Application 2025 & 2033
- Figure 41: Middle East & Africa Digital Satellite Receiver Revenue Share (%), by Application 2025 & 2033
- Figure 42: Middle East & Africa Digital Satellite Receiver Volume Share (%), by Application 2025 & 2033
- Figure 43: Middle East & Africa Digital Satellite Receiver Revenue (billion), by Type 2025 & 2033
- Figure 44: Middle East & Africa Digital Satellite Receiver Volume (K), by Type 2025 & 2033
- Figure 45: Middle East & Africa Digital Satellite Receiver Revenue Share (%), by Type 2025 & 2033
- Figure 46: Middle East & Africa Digital Satellite Receiver Volume Share (%), by Type 2025 & 2033
- Figure 47: Middle East & Africa Digital Satellite Receiver Revenue (billion), by Country 2025 & 2033
- Figure 48: Middle East & Africa Digital Satellite Receiver Volume (K), by Country 2025 & 2033
- Figure 49: Middle East & Africa Digital Satellite Receiver Revenue Share (%), by Country 2025 & 2033
- Figure 50: Middle East & Africa Digital Satellite Receiver Volume Share (%), by Country 2025 & 2033
- Figure 51: Asia Pacific Digital Satellite Receiver Revenue (billion), by Application 2025 & 2033
- Figure 52: Asia Pacific Digital Satellite Receiver Volume (K), by Application 2025 & 2033
- Figure 53: Asia Pacific Digital Satellite Receiver Revenue Share (%), by Application 2025 & 2033
- Figure 54: Asia Pacific Digital Satellite Receiver Volume Share (%), by Application 2025 & 2033
- Figure 55: Asia Pacific Digital Satellite Receiver Revenue (billion), by Type 2025 & 2033
- Figure 56: Asia Pacific Digital Satellite Receiver Volume (K), by Type 2025 & 2033
- Figure 57: Asia Pacific Digital Satellite Receiver Revenue Share (%), by Type 2025 & 2033
- Figure 58: Asia Pacific Digital Satellite Receiver Volume Share (%), by Type 2025 & 2033
- Figure 59: Asia Pacific Digital Satellite Receiver Revenue (billion), by Country 2025 & 2033
- Figure 60: Asia Pacific Digital Satellite Receiver Volume (K), by Country 2025 & 2033
- Figure 61: Asia Pacific Digital Satellite Receiver Revenue Share (%), by Country 2025 & 2033
- Figure 62: Asia Pacific Digital Satellite Receiver Volume Share (%), by Country 2025 & 2033
List of Tables
- Table 1: Global Digital Satellite Receiver Revenue billion Forecast, by Application 2020 & 2033
- Table 2: Global Digital Satellite Receiver Volume K Forecast, by Application 2020 & 2033
- Table 3: Global Digital Satellite Receiver Revenue billion Forecast, by Type 2020 & 2033
- Table 4: Global Digital Satellite Receiver Volume K Forecast, by Type 2020 & 2033
- Table 5: Global Digital Satellite Receiver Revenue billion Forecast, by Region 2020 & 2033
- Table 6: Global Digital Satellite Receiver Volume K Forecast, by Region 2020 & 2033
- Table 7: Global Digital Satellite Receiver Revenue billion Forecast, by Application 2020 & 2033
- Table 8: Global Digital Satellite Receiver Volume K Forecast, by Application 2020 & 2033
- Table 9: Global Digital Satellite Receiver Revenue billion Forecast, by Type 2020 & 2033
- Table 10: Global Digital Satellite Receiver Volume K Forecast, by Type 2020 & 2033
- Table 11: Global Digital Satellite Receiver Revenue billion Forecast, by Country 2020 & 2033
- Table 12: Global Digital Satellite Receiver Volume K Forecast, by Country 2020 & 2033
- Table 13: United States Digital Satellite Receiver Revenue (billion) Forecast, by Application 2020 & 2033
- Table 14: United States Digital Satellite Receiver Volume (K) Forecast, by Application 2020 & 2033
- Table 15: Canada Digital Satellite Receiver Revenue (billion) Forecast, by Application 2020 & 2033
- Table 16: Canada Digital Satellite Receiver Volume (K) Forecast, by Application 2020 & 2033
- Table 17: Mexico Digital Satellite Receiver Revenue (billion) Forecast, by Application 2020 & 2033
- Table 18: Mexico Digital Satellite Receiver Volume (K) Forecast, by Application 2020 & 2033
- Table 19: Global Digital Satellite Receiver Revenue billion Forecast, by Application 2020 & 2033
- Table 20: Global Digital Satellite Receiver Volume K Forecast, by Application 2020 & 2033
- Table 21: Global Digital Satellite Receiver Revenue billion Forecast, by Type 2020 & 2033
- Table 22: Global Digital Satellite Receiver Volume K Forecast, by Type 2020 & 2033
- Table 23: Global Digital Satellite Receiver Revenue billion Forecast, by Country 2020 & 2033
- Table 24: Global Digital Satellite Receiver Volume K Forecast, by Country 2020 & 2033
- Table 25: Brazil Digital Satellite Receiver Revenue (billion) Forecast, by Application 2020 & 2033
- Table 26: Brazil Digital Satellite Receiver Volume (K) Forecast, by Application 2020 & 2033
- Table 27: Argentina Digital Satellite Receiver Revenue (billion) Forecast, by Application 2020 & 2033
- Table 28: Argentina Digital Satellite Receiver Volume (K) Forecast, by Application 2020 & 2033
- Table 29: Rest of South America Digital Satellite Receiver Revenue (billion) Forecast, by Application 2020 & 2033
- Table 30: Rest of South America Digital Satellite Receiver Volume (K) Forecast, by Application 2020 & 2033
- Table 31: Global Digital Satellite Receiver Revenue billion Forecast, by Application 2020 & 2033
- Table 32: Global Digital Satellite Receiver Volume K Forecast, by Application 2020 & 2033
- Table 33: Global Digital Satellite Receiver Revenue billion Forecast, by Type 2020 & 2033
- Table 34: Global Digital Satellite Receiver Volume K Forecast, by Type 2020 & 2033
- Table 35: Global Digital Satellite Receiver Revenue billion Forecast, by Country 2020 & 2033
- Table 36: Global Digital Satellite Receiver Volume K Forecast, by Country 2020 & 2033
- Table 37: United Kingdom Digital Satellite Receiver Revenue (billion) Forecast, by Application 2020 & 2033
- Table 38: United Kingdom Digital Satellite Receiver Volume (K) Forecast, by Application 2020 & 2033
- Table 39: Germany Digital Satellite Receiver Revenue (billion) Forecast, by Application 2020 & 2033
- Table 40: Germany Digital Satellite Receiver Volume (K) Forecast, by Application 2020 & 2033
- Table 41: France Digital Satellite Receiver Revenue (billion) Forecast, by Application 2020 & 2033
- Table 42: France Digital Satellite Receiver Volume (K) Forecast, by Application 2020 & 2033
- Table 43: Italy Digital Satellite Receiver Revenue (billion) Forecast, by Application 2020 & 2033
- Table 44: Italy Digital Satellite Receiver Volume (K) Forecast, by Application 2020 & 2033
- Table 45: Spain Digital Satellite Receiver Revenue (billion) Forecast, by Application 2020 & 2033
- Table 46: Spain Digital Satellite Receiver Volume (K) Forecast, by Application 2020 & 2033
- Table 47: Russia Digital Satellite Receiver Revenue (billion) Forecast, by Application 2020 & 2033
- Table 48: Russia Digital Satellite Receiver Volume (K) Forecast, by Application 2020 & 2033
- Table 49: Benelux Digital Satellite Receiver Revenue (billion) Forecast, by Application 2020 & 2033
- Table 50: Benelux Digital Satellite Receiver Volume (K) Forecast, by Application 2020 & 2033
- Table 51: Nordics Digital Satellite Receiver Revenue (billion) Forecast, by Application 2020 & 2033
- Table 52: Nordics Digital Satellite Receiver Volume (K) Forecast, by Application 2020 & 2033
- Table 53: Rest of Europe Digital Satellite Receiver Revenue (billion) Forecast, by Application 2020 & 2033
- Table 54: Rest of Europe Digital Satellite Receiver Volume (K) Forecast, by Application 2020 & 2033
- Table 55: Global Digital Satellite Receiver Revenue billion Forecast, by Application 2020 & 2033
- Table 56: Global Digital Satellite Receiver Volume K Forecast, by Application 2020 & 2033
- Table 57: Global Digital Satellite Receiver Revenue billion Forecast, by Type 2020 & 2033
- Table 58: Global Digital Satellite Receiver Volume K Forecast, by Type 2020 & 2033
- Table 59: Global Digital Satellite Receiver Revenue billion Forecast, by Country 2020 & 2033
- Table 60: Global Digital Satellite Receiver Volume K Forecast, by Country 2020 & 2033
- Table 61: Turkey Digital Satellite Receiver Revenue (billion) Forecast, by Application 2020 & 2033
- Table 62: Turkey Digital Satellite Receiver Volume (K) Forecast, by Application 2020 & 2033
- Table 63: Israel Digital Satellite Receiver Revenue (billion) Forecast, by Application 2020 & 2033
- Table 64: Israel Digital Satellite Receiver Volume (K) Forecast, by Application 2020 & 2033
- Table 65: GCC Digital Satellite Receiver Revenue (billion) Forecast, by Application 2020 & 2033
- Table 66: GCC Digital Satellite Receiver Volume (K) Forecast, by Application 2020 & 2033
- Table 67: North Africa Digital Satellite Receiver Revenue (billion) Forecast, by Application 2020 & 2033
- Table 68: North Africa Digital Satellite Receiver Volume (K) Forecast, by Application 2020 & 2033
- Table 69: South Africa Digital Satellite Receiver Revenue (billion) Forecast, by Application 2020 & 2033
- Table 70: South Africa Digital Satellite Receiver Volume (K) Forecast, by Application 2020 & 2033
- Table 71: Rest of Middle East & Africa Digital Satellite Receiver Revenue (billion) Forecast, by Application 2020 & 2033
- Table 72: Rest of Middle East & Africa Digital Satellite Receiver Volume (K) Forecast, by Application 2020 & 2033
- Table 73: Global Digital Satellite Receiver Revenue billion Forecast, by Application 2020 & 2033
- Table 74: Global Digital Satellite Receiver Volume K Forecast, by Application 2020 & 2033
- Table 75: Global Digital Satellite Receiver Revenue billion Forecast, by Type 2020 & 2033
- Table 76: Global Digital Satellite Receiver Volume K Forecast, by Type 2020 & 2033
- Table 77: Global Digital Satellite Receiver Revenue billion Forecast, by Country 2020 & 2033
- Table 78: Global Digital Satellite Receiver Volume K Forecast, by Country 2020 & 2033
- Table 79: China Digital Satellite Receiver Revenue (billion) Forecast, by Application 2020 & 2033
- Table 80: China Digital Satellite Receiver Volume (K) Forecast, by Application 2020 & 2033
- Table 81: India Digital Satellite Receiver Revenue (billion) Forecast, by Application 2020 & 2033
- Table 82: India Digital Satellite Receiver Volume (K) Forecast, by Application 2020 & 2033
- Table 83: Japan Digital Satellite Receiver Revenue (billion) Forecast, by Application 2020 & 2033
- Table 84: Japan Digital Satellite Receiver Volume (K) Forecast, by Application 2020 & 2033
- Table 85: South Korea Digital Satellite Receiver Revenue (billion) Forecast, by Application 2020 & 2033
- Table 86: South Korea Digital Satellite Receiver Volume (K) Forecast, by Application 2020 & 2033
- Table 87: ASEAN Digital Satellite Receiver Revenue (billion) Forecast, by Application 2020 & 2033
- Table 88: ASEAN Digital Satellite Receiver Volume (K) Forecast, by Application 2020 & 2033
- Table 89: Oceania Digital Satellite Receiver Revenue (billion) Forecast, by Application 2020 & 2033
- Table 90: Oceania Digital Satellite Receiver Volume (K) Forecast, by Application 2020 & 2033
- Table 91: Rest of Asia Pacific Digital Satellite Receiver Revenue (billion) Forecast, by Application 2020 & 2033
- Table 92: Rest of Asia Pacific Digital Satellite Receiver Volume (K) Forecast, by Application 2020 & 2033
Frequently Asked Questions
1. What is the projected Compound Annual Growth Rate (CAGR) of the Digital Satellite Receiver?
The projected CAGR is approximately 12.08%.
2. Which companies are prominent players in the Digital Satellite Receiver?
Key companies in the market include Arris(Pace), Technicolor(Cisco), Apple, Echostar, Humax, Sagemcom, Toshiba, Panasonic, Samsung, Roku, Skyworth, Huawei, Sichuan Jiuzhou Electronic Technology, Coship, Changhong, ZTE, Hisense.
3. What are the main segments of the Digital Satellite Receiver?
The market segments include Application, Type.
4. Can you provide details about the market size?
The market size is estimated to be USD 8.15 billion as of 2022.
5. What are some drivers contributing to market growth?
N/A
6. What are the notable trends driving market growth?
N/A
7. Are there any restraints impacting market growth?
N/A
8. Can you provide examples of recent developments in the market?
N/A
9. What pricing options are available for accessing the report?
Pricing options include single-user, multi-user, and enterprise licenses priced at USD 3950.00, USD 5925.00, and USD 7900.00 respectively.
10. Is the market size provided in terms of value or volume?
The market size is provided in terms of value, measured in billion and volume, measured in K.
11. Are there any specific market keywords associated with the report?
Yes, the market keyword associated with the report is "Digital Satellite Receiver," which aids in identifying and referencing the specific market segment covered.
12. How do I determine which pricing option suits my needs best?
The pricing options vary based on user requirements and access needs. Individual users may opt for single-user licenses, while businesses requiring broader access may choose multi-user or enterprise licenses for cost-effective access to the report.
13. Are there any additional resources or data provided in the Digital Satellite Receiver report?
While the report offers comprehensive insights, it's advisable to review the specific contents or supplementary materials provided to ascertain if additional resources or data are available.
14. How can I stay updated on further developments or reports in the Digital Satellite Receiver?
To stay informed about further developments, trends, and reports in the Digital Satellite Receiver, consider subscribing to industry newsletters, following relevant companies and organizations, or regularly checking reputable industry news sources and publications.
Methodology
Step 1 - Identification of Relevant Samples Size from Population Database


Step 2 - Approaches for Defining Global Market Size (Value, Volume* & Price*)

Note*: In applicable scenarios
Step 3 - Data Sources
Primary Research
- Web Analytics
- Survey Reports
- Research Institute
- Latest Research Reports
- Opinion Leaders
Secondary Research
- Annual Reports
- White Paper
- Latest Press Release
- Industry Association
- Paid Database
- Investor Presentations

Step 4 - Data Triangulation
Involves using different sources of information in order to increase the validity of a study
These sources are likely to be stakeholders in a program - participants, other researchers, program staff, other community members, and so on.
Then we put all data in single framework & apply various statistical tools to find out the dynamic on the market.
During the analysis stage, feedback from the stakeholder groups would be compared to determine areas of agreement as well as areas of divergence