

Key Insights
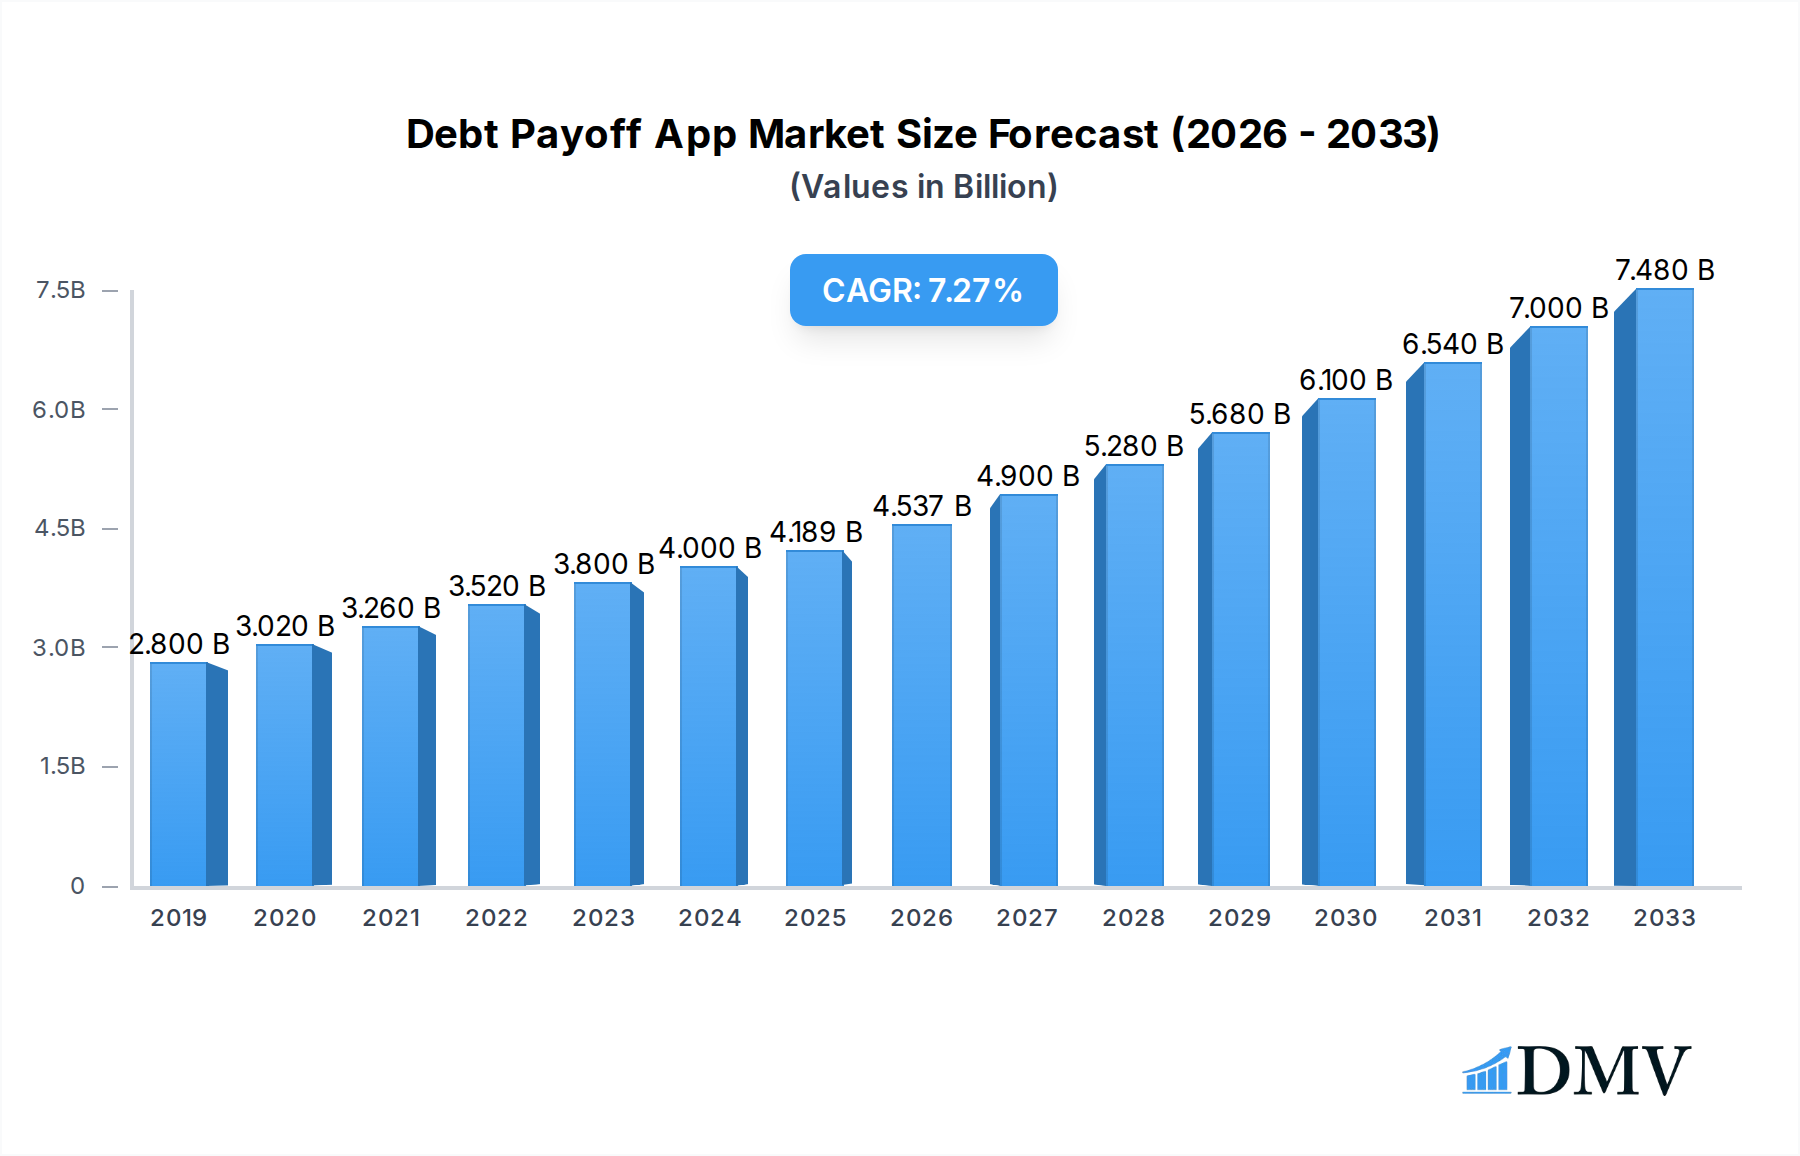
The global Debt Payoff App market is projected to experience robust growth, reaching an estimated $4189 million by 2025 and expanding further at a Compound Annual Growth Rate (CAGR) of 8.2% through 2033. This significant expansion is fueled by increasing consumer awareness of financial management tools, a growing need for efficient debt reduction strategies, and the proliferation of smartphones and digital banking services. Individuals are actively seeking user-friendly platforms to track spending, create personalized repayment plans, and gain control over their financial futures. The enterprise segment is also showing promising adoption, as businesses recognize the value of offering financial wellness solutions to their employees, thereby boosting morale and productivity. Emerging economies, particularly in Asia Pacific, are expected to contribute substantially to market growth due to a burgeoning middle class and a rising demand for accessible financial planning tools. The convenience and accessibility offered by cloud-based solutions are a primary driver, catering to the on-the-go lifestyle of modern consumers.

Debt Payoff App Market Size (In Billion)
The market is characterized by a dynamic competitive landscape, with companies like Tally, Credit Karma, and Bright Money leading the charge in innovation and user acquisition. These players are differentiating themselves through features such as automated debt payments, credit score monitoring, and personalized financial advice. While the market presents substantial opportunities, it is not without its challenges. Concerns regarding data security and privacy remain a key restraint, necessitating stringent adherence to regulatory standards. Furthermore, the presence of free alternatives and the reluctance of some individuals to share sensitive financial data can hinder widespread adoption. However, the overall trend points towards increasing reliance on digital solutions for financial management, indicating a strong upward trajectory for the debt payoff app market as more individuals and enterprises prioritize financial health and debt-free living.
Debt Payoff App Company Market Share
Debt Payoff App Market Composition & Trends
The debt payoff app market is characterized by a dynamic interplay of innovation, evolving regulatory frameworks, and a growing consumer demand for effective debt management solutions. While the market is currently fragmented, with a significant presence of niche players and emerging platforms, consolidation is anticipated as successful debt management software and personal finance apps vie for dominance. Innovation is a key catalyst, driven by advancements in AI and machine learning, enabling more personalized and predictive debt reduction strategies. Companies like Debt Payoff Planner, Qapital, and Undebt.it are at the forefront, offering diverse features from automated savings to detailed payoff calculators. The regulatory landscape, though generally supportive of consumer financial health tools, introduces complexities around data privacy and security, influencing the design and implementation of these applications. Substitute products, such as traditional financial advisors and manual budgeting methods, are gradually being supplanted by the convenience and accessibility of digital solutions. End-user profiles range from individuals struggling with credit card debt and student loans to families seeking comprehensive financial planning. M&A activities are expected to accelerate, with potential deals valued in the hundreds of millions, as larger fintech companies seek to acquire innovative technologies and expand their user base in the online debt reduction sector.
- Market Share Distribution: While precise figures are proprietary, early-stage analysis suggests a distribution where established budgeting tools (e.g., YNAB) hold a significant portion, followed by specialized debt payoff platforms (e.g., Undebt.it, Unbury.me), and a growing segment of newer, AI-driven applications (e.g., Bright Money, Tally).
- M&A Deal Values: Anticipated M&A transactions are projected to range from tens of millions to several hundred million dollars, driven by strategic acquisitions of user bases and proprietary algorithms.
- Innovation Catalysts: AI-driven personalization, gamification of debt repayment, open banking integrations, and enhanced user experience are key drivers.
Debt Payoff App Industry Evolution
The debt payoff app industry has witnessed a remarkable transformation since 2019, evolving from basic budgeting tools to sophisticated financial management platforms. The historical period (2019–2024) saw the initial surge of interest in digital solutions for managing consumer debt. During this time, the market experienced a compound annual growth rate (CAGR) of approximately 15%, fueled by increasing consumer awareness of financial well-being and the accessibility of smartphones. Early applications, such as Vertex42's spreadsheets and simple calculators, laid the groundwork for more advanced features. The base year of 2025 marks a pivotal point, with the market poised for even more accelerated growth. Technological advancements have been instrumental in this evolution. The integration of AI and machine learning has enabled debt management apps to offer personalized strategies, predictive modeling for payoff timelines, and automated savings mechanisms. Companies like Qapital and Qoins have pioneered automated savings features that round up purchases and allocate the spare change towards debt reduction. Furthermore, the rise of open banking has facilitated seamless integration with financial institutions, allowing for real-time transaction monitoring and more accurate financial overviews within financial planning software.
Consumer demand has shifted significantly. Initially, users sought simple tools to track their debts. Today, they expect comprehensive solutions that not only track but actively guide them towards debt freedom. This includes features like debt snowball vs. avalanche calculators, interest rate optimization tools, and behavioral nudges to encourage consistent payments. The adoption rate of these applications has surged, with an estimated 30% increase in active users from 2022 to 2024. The forecast period (2025–2033) anticipates a continued upward trajectory, with projected CAGRs of 18-20%. This sustained growth will be driven by factors such as increasing levels of consumer debt, particularly student loans and credit card balances, and a growing preference for digital, self-directed financial management. The emergence of specialized apps catering to specific debt types, such as mortgage payoff or medical debt consolidation, will further segment and expand the market. The industry's evolution is a testament to its ability to adapt to changing consumer needs and leverage technological innovation to empower individuals to take control of their financial futures.
Leading Regions, Countries, or Segments in Debt Payoff App
The debt payoff app market exhibits distinct leadership across various geographical regions and application segments. Within the Application category, the Individual segment is currently the dominant force, driven by a widespread need for personal financial management tools. Millions of individuals worldwide are actively seeking effective ways to manage credit card debt, student loans, and other personal liabilities. This segment's dominance is further amplified by the increasing adoption of smartphones and the growing awareness of the importance of financial literacy. The Cloud-based Type of deployment also leads significantly, offering unparalleled accessibility, scalability, and regular updates without the burden of on-premise installations. Users can access their financial data and tools from anywhere, at any time, fostering consistent engagement with their debt payoff journey.
The United States stands out as a leading country, owing to a combination of high consumer debt levels, a robust fintech ecosystem, and a strong culture of digital adoption. The presence of key players like Debt Payoff Assistant, Bright Money, and Tally, which have garnered significant user bases in the US, underscores this regional dominance. Investment trends in the US fintech sector, coupled with supportive regulatory environments for consumer protection and financial innovation, have created fertile ground for debt reduction strategies and related applications. Key drivers for this segment's and type's leadership include:
- High Consumer Debt Levels: A significant portion of the US population carries substantial debt, creating a perpetual demand for effective debt management solutions. This includes millions of individuals grappling with student loan burdens, estimated to be in the trillions.
- Technological Penetration: High smartphone ownership and internet connectivity ensure broad access to debt payoff apps. The widespread availability of the Cloud-based infrastructure further facilitates seamless service delivery.
- Fintech Innovation Hub: The US is a global leader in fintech research and development, fostering continuous innovation in personal finance apps and debt consolidation tools. Investment in this sector has reached billions of dollars annually, driving product advancements.
- User-Centric Design: Leading applications prioritize user experience, offering intuitive interfaces, personalized insights, and gamified elements to encourage consistent engagement with debt elimination plans. The Individual segment benefits immensely from this focus on ease of use.
- Regulatory Support: While regulations exist for data security, the overall landscape in the US encourages the development of tools aimed at improving consumer financial health, making it easier for companies to offer debt management assistance.
Debt Payoff App Product Innovations
The debt payoff app market is continuously shaped by groundbreaking product innovations designed to enhance user engagement and accelerate debt elimination. Unique selling propositions are emerging, focusing on hyper-personalization and proactive financial guidance. Technologies like AI and machine learning are being integrated to provide users with tailored debt reduction strategies, optimizing payoff order based on individual financial situations, interest rates, and behavioral patterns. For instance, apps are now capable of suggesting the most financially advantageous payoff method (snowball vs. avalanche) with personalized projections. Performance metrics are showing significant improvements, with users of advanced apps reporting an average acceleration of their debt-free timelines by 15-20%. The integration of behavioral economics principles is another key advancement, with apps employing gamification, rewards, and timely nudges to keep users motivated and on track.
Propelling Factors for Debt Payoff App Growth
The growth of the debt payoff app market is propelled by a confluence of powerful technological, economic, and societal factors. A primary driver is the increasing burden of consumer debt, particularly student loans and credit card balances, totaling in the trillions of dollars, which creates a persistent demand for effective management solutions. Technologically, the widespread adoption of smartphones and the continuous advancements in AI and machine learning enable the development of sophisticated, personalized debt reduction strategies that were previously unavailable. Economically, rising interest rates on various forms of debt make efficient payoff methods more crucial for consumers seeking to minimize interest payments. Furthermore, a growing societal emphasis on financial wellness and early retirement planning encourages individuals to proactively seek tools that support their financial goals. The increasing availability of cloud-based solutions also broadens accessibility and reduces implementation barriers.
Obstacles in the Debt Payoff App Market
Despite the robust growth, the debt payoff app market faces several significant obstacles that could impede its full potential. Regulatory challenges, particularly concerning data privacy and security, can lead to increased compliance costs and limitations on data utilization, impacting the personalization capabilities of some applications. Supply chain disruptions are less of a direct concern for software, but the broader economic climate can affect consumer disposable income, thereby reducing their willingness or ability to invest in premium app features or services. Competitive pressures are intense, with numerous players vying for user attention, leading to high customer acquisition costs and the need for continuous innovation to retain users. The initial cost of switching from existing financial tools or the perceived complexity of adopting new debt management software can also act as a barrier for some segments of the population.
Future Opportunities in Debt Payoff App
The debt payoff app market is ripe with emerging opportunities poised to fuel future growth and innovation. The expansion into underserved demographics, such as low-income individuals or those with complex debt situations, presents a significant untapped market. Leveraging advancements in AI, future opportunities lie in developing even more sophisticated predictive analytics for long-term financial planning and wealth building beyond just debt elimination. The integration of cryptocurrency and blockchain technologies for secure and transparent debt management solutions could open new avenues. Furthermore, partnerships with financial institutions, employers offering financial wellness programs, and educational platforms can broaden reach and create new revenue streams. The increasing global focus on financial literacy and empowerment will continue to drive demand for intuitive and effective debt payoff tools.
Major Players in the Debt Payoff App Ecosystem
- Debt Payoff Planner
- Qapital
- ZilchWorks
- Undebt.it
- Unbury.me
- Vertex42
- Debt Payoff Assistant
- Bright Money
- Qoins
- Earnin
- Credit Karma
- Tally
- Relief App
- Freedom Debt Relief
- Achieve GOOD
- YNAB
Key Developments in Debt Payoff App Industry
- 2019: Increased adoption of AI for personalized debt payoff recommendations.
- 2020: Surge in demand for budgeting and debt management apps driven by economic uncertainty. Launch of innovative features like automated savings rounds-ups by apps like Qapital.
- 2021: Growing partnerships between debt payoff apps and financial institutions for seamless data integration. Expansion of features to include credit score monitoring.
- 2022: Focus on gamification and behavioral economics to boost user engagement and adherence to debt repayment plans.
- 2023: Increased investment in cloud-based debt management solutions for enhanced accessibility and scalability. Introduction of advanced predictive analytics for long-term financial health.
- 2024: Emergence of specialized apps targeting specific debt types like student loans and medical debt. Greater emphasis on cybersecurity and data privacy features.
- 2025: Anticipated consolidation through M&A activities as larger fintech players acquire innovative debt payoff technologies.
Strategic Debt Payoff App Market Forecast
The strategic forecast for the debt payoff app market is exceptionally positive, driven by sustained demand for effective debt management tools and continuous technological innovation. Growth catalysts include the ever-present need to manage escalating consumer debt, estimated to reach tens of trillions across various categories. The ongoing evolution of AI and machine learning will empower apps to offer hyper-personalized financial guidance, further optimizing payoff strategies and increasing user success rates. Opportunities in emerging markets and a growing global consciousness around financial wellness will also significantly contribute to market expansion. The forecast indicates a robust CAGR in the coming years, with hundreds of millions of potential new users adopting these digital solutions to achieve financial freedom.
Debt Payoff App Segmentation
-
1. Application
- 1.1. Individual
- 1.2. Enterprise
- 1.3. Others
-
2. Types
- 2.1. Cloud-based
- 2.2. On-premise
Debt Payoff App Segmentation By Geography
-
1. North America
- 1.1. United States
- 1.2. Canada
- 1.3. Mexico
-
2. South America
- 2.1. Brazil
- 2.2. Argentina
- 2.3. Rest of South America
-
3. Europe
- 3.1. United Kingdom
- 3.2. Germany
- 3.3. France
- 3.4. Italy
- 3.5. Spain
- 3.6. Russia
- 3.7. Benelux
- 3.8. Nordics
- 3.9. Rest of Europe
-
4. Middle East & Africa
- 4.1. Turkey
- 4.2. Israel
- 4.3. GCC
- 4.4. North Africa
- 4.5. South Africa
- 4.6. Rest of Middle East & Africa
-
5. Asia Pacific
- 5.1. China
- 5.2. India
- 5.3. Japan
- 5.4. South Korea
- 5.5. ASEAN
- 5.6. Oceania
- 5.7. Rest of Asia Pacific
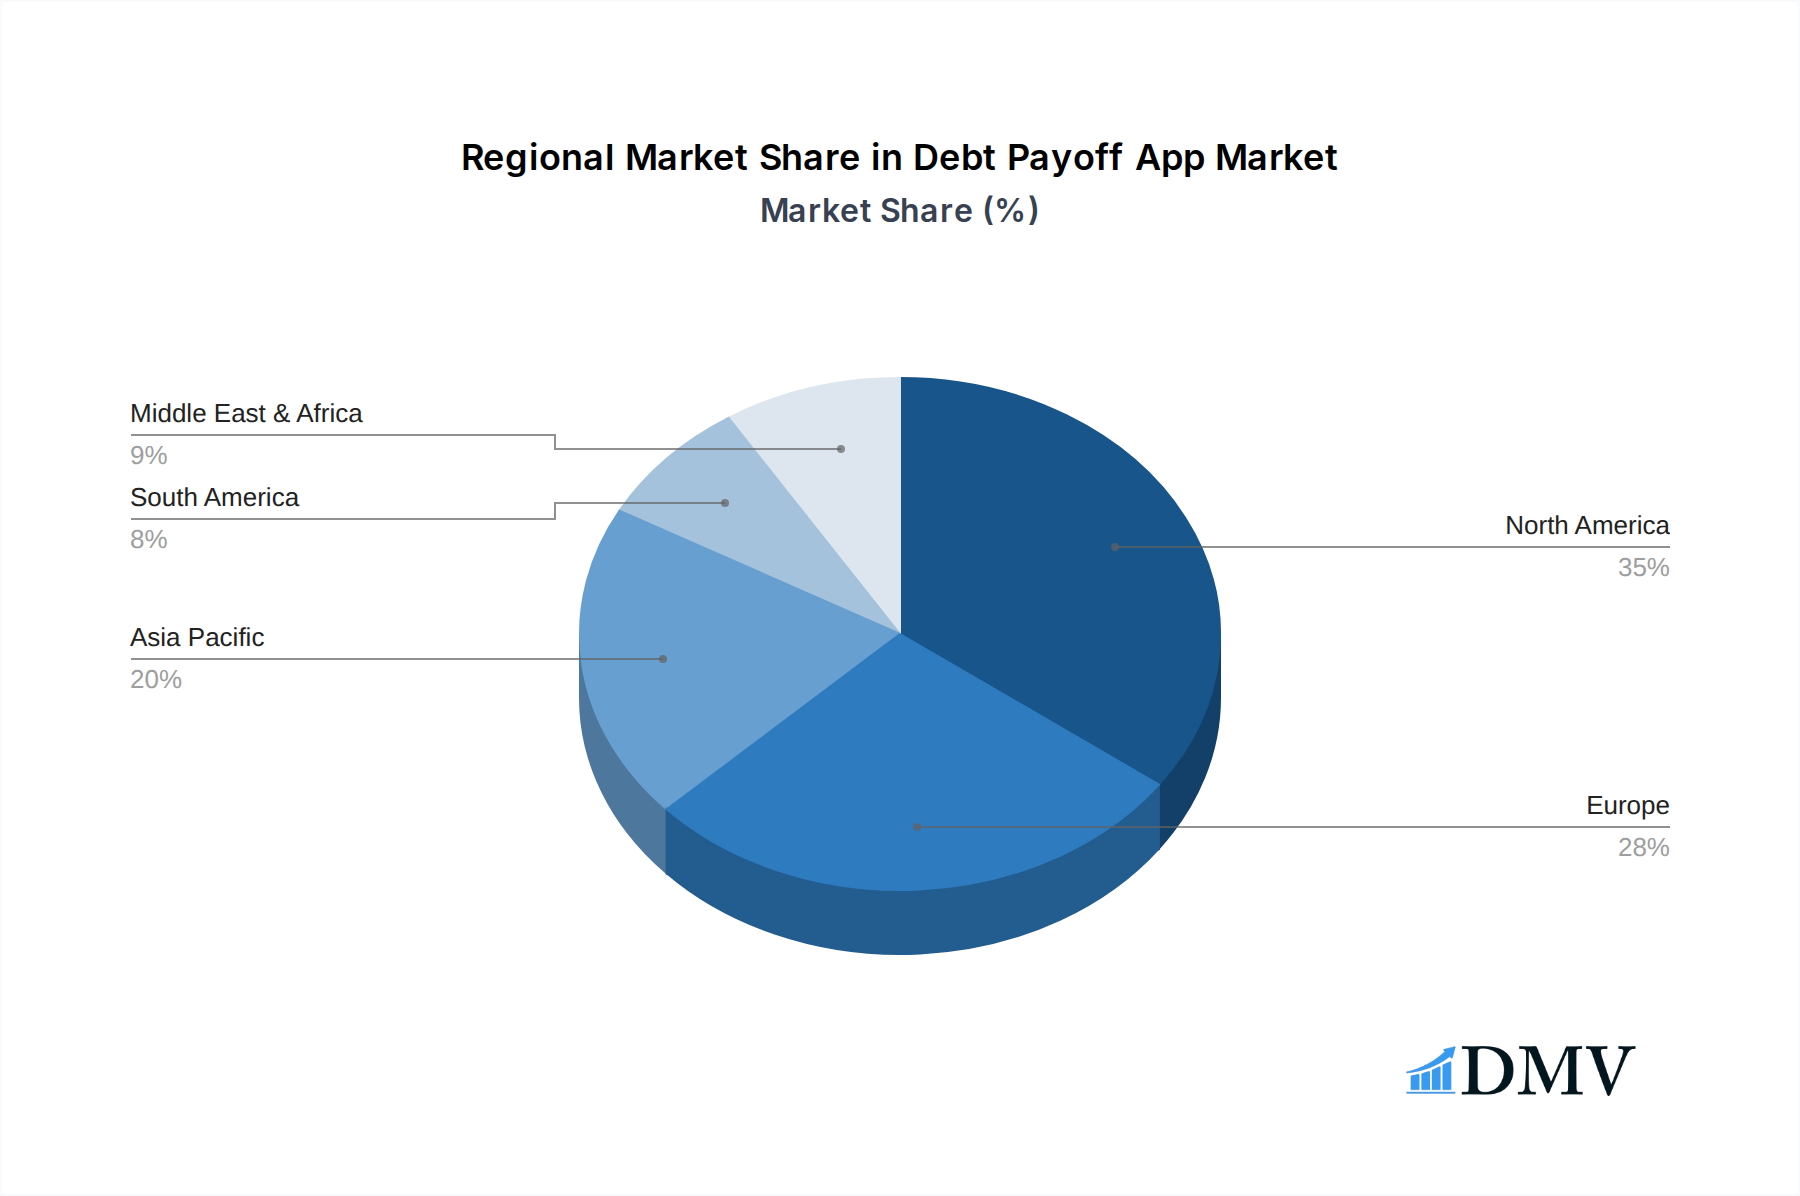
Debt Payoff App Regional Market Share
Geographic Coverage of Debt Payoff App
Debt Payoff App REPORT HIGHLIGHTS
| Aspects | Details |
|---|---|
| Study Period | 2020-2034 |
| Base Year | 2025 |
| Estimated Year | 2026 |
| Forecast Period | 2026-2034 |
| Historical Period | 2020-2025 |
| Growth Rate | CAGR of 8.2% from 2020-2034 |
| Segmentation |
|
Table of Contents
- 1. Introduction
- 1.1. Research Scope
- 1.2. Market Segmentation
- 1.3. Research Objective
- 1.4. Definitions and Assumptions
- 2. Executive Summary
- 2.1. Market Snapshot
- 3. Market Dynamics
- 3.1. Market Drivers
- 3.2. Market Restrains
- 3.3. Market Trends
- 3.4. Market Opportunities
- 4. Market Factor Analysis
- 4.1. Porters Five Forces
- 4.1.1. Bargaining Power of Suppliers
- 4.1.2. Bargaining Power of Buyers
- 4.1.3. Threat of New Entrants
- 4.1.4. Threat of Substitutes
- 4.1.5. Competitive Rivalry
- 4.2. PESTEL analysis
- 4.3. BCG Analysis
- 4.3.1. Stars (High Growth, High Market Share)
- 4.3.2. Cash Cows (Low Growth, High Market Share)
- 4.3.3. Question Mark (High Growth, Low Market Share)
- 4.3.4. Dogs (Low Growth, Low Market Share)
- 4.4. Ansoff Matrix Analysis
- 4.5. Supply Chain Analysis
- 4.6. Regulatory Landscape
- 4.7. Current Market Potential and Opportunity Assessment (TAM–SAM–SOM Framework)
- 4.8. DMV Analyst Note
- 4.1. Porters Five Forces
- 5. Market Analysis, Insights and Forecast 2021-2033
- 5.1. Market Analysis, Insights and Forecast - by Application
- 5.1.1. Individual
- 5.1.2. Enterprise
- 5.1.3. Others
- 5.2. Market Analysis, Insights and Forecast - by Types
- 5.2.1. Cloud-based
- 5.2.2. On-premise
- 5.3. Market Analysis, Insights and Forecast - by Region
- 5.3.1. North America
- 5.3.2. South America
- 5.3.3. Europe
- 5.3.4. Middle East & Africa
- 5.3.5. Asia Pacific
- 5.1. Market Analysis, Insights and Forecast - by Application
- 6. Global Debt Payoff App Analysis, Insights and Forecast, 2021-2033
- 6.1. Market Analysis, Insights and Forecast - by Application
- 6.1.1. Individual
- 6.1.2. Enterprise
- 6.1.3. Others
- 6.2. Market Analysis, Insights and Forecast - by Types
- 6.2.1. Cloud-based
- 6.2.2. On-premise
- 6.1. Market Analysis, Insights and Forecast - by Application
- 7. North America Debt Payoff App Analysis, Insights and Forecast, 2020-2032
- 7.1. Market Analysis, Insights and Forecast - by Application
- 7.1.1. Individual
- 7.1.2. Enterprise
- 7.1.3. Others
- 7.2. Market Analysis, Insights and Forecast - by Types
- 7.2.1. Cloud-based
- 7.2.2. On-premise
- 7.1. Market Analysis, Insights and Forecast - by Application
- 8. South America Debt Payoff App Analysis, Insights and Forecast, 2020-2032
- 8.1. Market Analysis, Insights and Forecast - by Application
- 8.1.1. Individual
- 8.1.2. Enterprise
- 8.1.3. Others
- 8.2. Market Analysis, Insights and Forecast - by Types
- 8.2.1. Cloud-based
- 8.2.2. On-premise
- 8.1. Market Analysis, Insights and Forecast - by Application
- 9. Europe Debt Payoff App Analysis, Insights and Forecast, 2020-2032
- 9.1. Market Analysis, Insights and Forecast - by Application
- 9.1.1. Individual
- 9.1.2. Enterprise
- 9.1.3. Others
- 9.2. Market Analysis, Insights and Forecast - by Types
- 9.2.1. Cloud-based
- 9.2.2. On-premise
- 9.1. Market Analysis, Insights and Forecast - by Application
- 10. Middle East & Africa Debt Payoff App Analysis, Insights and Forecast, 2020-2032
- 10.1. Market Analysis, Insights and Forecast - by Application
- 10.1.1. Individual
- 10.1.2. Enterprise
- 10.1.3. Others
- 10.2. Market Analysis, Insights and Forecast - by Types
- 10.2.1. Cloud-based
- 10.2.2. On-premise
- 10.1. Market Analysis, Insights and Forecast - by Application
- 11. Asia Pacific Debt Payoff App Analysis, Insights and Forecast, 2020-2032
- 11.1. Market Analysis, Insights and Forecast - by Application
- 11.1.1. Individual
- 11.1.2. Enterprise
- 11.1.3. Others
- 11.2. Market Analysis, Insights and Forecast - by Types
- 11.2.1. Cloud-based
- 11.2.2. On-premise
- 11.1. Market Analysis, Insights and Forecast - by Application
- 12. Competitive Analysis
- 12.1. Company Profiles
- 12.1.1 Debt Payoff Planner
- 12.1.1.1. Company Overview
- 12.1.1.2. Products
- 12.1.1.3. Company Financials
- 12.1.1.4. SWOT Analysis
- 12.1.2 Qapital
- 12.1.2.1. Company Overview
- 12.1.2.2. Products
- 12.1.2.3. Company Financials
- 12.1.2.4. SWOT Analysis
- 12.1.3 ZilchWorks
- 12.1.3.1. Company Overview
- 12.1.3.2. Products
- 12.1.3.3. Company Financials
- 12.1.3.4. SWOT Analysis
- 12.1.4 Undebt.it
- 12.1.4.1. Company Overview
- 12.1.4.2. Products
- 12.1.4.3. Company Financials
- 12.1.4.4. SWOT Analysis
- 12.1.5 Unbury.me
- 12.1.5.1. Company Overview
- 12.1.5.2. Products
- 12.1.5.3. Company Financials
- 12.1.5.4. SWOT Analysis
- 12.1.6 Vertex42
- 12.1.6.1. Company Overview
- 12.1.6.2. Products
- 12.1.6.3. Company Financials
- 12.1.6.4. SWOT Analysis
- 12.1.7 Debt Payoff Assistant
- 12.1.7.1. Company Overview
- 12.1.7.2. Products
- 12.1.7.3. Company Financials
- 12.1.7.4. SWOT Analysis
- 12.1.8 Bright Money
- 12.1.8.1. Company Overview
- 12.1.8.2. Products
- 12.1.8.3. Company Financials
- 12.1.8.4. SWOT Analysis
- 12.1.9 Qoins
- 12.1.9.1. Company Overview
- 12.1.9.2. Products
- 12.1.9.3. Company Financials
- 12.1.9.4. SWOT Analysis
- 12.1.10 Earnin
- 12.1.10.1. Company Overview
- 12.1.10.2. Products
- 12.1.10.3. Company Financials
- 12.1.10.4. SWOT Analysis
- 12.1.11 Credit Karma
- 12.1.11.1. Company Overview
- 12.1.11.2. Products
- 12.1.11.3. Company Financials
- 12.1.11.4. SWOT Analysis
- 12.1.12 Tally
- 12.1.12.1. Company Overview
- 12.1.12.2. Products
- 12.1.12.3. Company Financials
- 12.1.12.4. SWOT Analysis
- 12.1.13 Relief App
- 12.1.13.1. Company Overview
- 12.1.13.2. Products
- 12.1.13.3. Company Financials
- 12.1.13.4. SWOT Analysis
- 12.1.14 Freedom Debt Relief
- 12.1.14.1. Company Overview
- 12.1.14.2. Products
- 12.1.14.3. Company Financials
- 12.1.14.4. SWOT Analysis
- 12.1.15 Achieve GOOD
- 12.1.15.1. Company Overview
- 12.1.15.2. Products
- 12.1.15.3. Company Financials
- 12.1.15.4. SWOT Analysis
- 12.1.16 YNAB
- 12.1.16.1. Company Overview
- 12.1.16.2. Products
- 12.1.16.3. Company Financials
- 12.1.16.4. SWOT Analysis
- 12.1.1 Debt Payoff Planner
- 12.2. Market Entropy
- 12.2.1 Company's Key Areas Served
- 12.2.2 Recent Developments
- 12.3. Company Market Share Analysis 2025
- 12.3.1 Top 5 Companies Market Share Analysis
- 12.3.2 Top 3 Companies Market Share Analysis
- 12.4. List of Potential Customers
- 13. Research Methodology
List of Figures
- Figure 1: Global Debt Payoff App Revenue Breakdown (million, %) by Region 2025 & 2033
- Figure 2: North America Debt Payoff App Revenue (million), by Application 2025 & 2033
- Figure 3: North America Debt Payoff App Revenue Share (%), by Application 2025 & 2033
- Figure 4: North America Debt Payoff App Revenue (million), by Types 2025 & 2033
- Figure 5: North America Debt Payoff App Revenue Share (%), by Types 2025 & 2033
- Figure 6: North America Debt Payoff App Revenue (million), by Country 2025 & 2033
- Figure 7: North America Debt Payoff App Revenue Share (%), by Country 2025 & 2033
- Figure 8: South America Debt Payoff App Revenue (million), by Application 2025 & 2033
- Figure 9: South America Debt Payoff App Revenue Share (%), by Application 2025 & 2033
- Figure 10: South America Debt Payoff App Revenue (million), by Types 2025 & 2033
- Figure 11: South America Debt Payoff App Revenue Share (%), by Types 2025 & 2033
- Figure 12: South America Debt Payoff App Revenue (million), by Country 2025 & 2033
- Figure 13: South America Debt Payoff App Revenue Share (%), by Country 2025 & 2033
- Figure 14: Europe Debt Payoff App Revenue (million), by Application 2025 & 2033
- Figure 15: Europe Debt Payoff App Revenue Share (%), by Application 2025 & 2033
- Figure 16: Europe Debt Payoff App Revenue (million), by Types 2025 & 2033
- Figure 17: Europe Debt Payoff App Revenue Share (%), by Types 2025 & 2033
- Figure 18: Europe Debt Payoff App Revenue (million), by Country 2025 & 2033
- Figure 19: Europe Debt Payoff App Revenue Share (%), by Country 2025 & 2033
- Figure 20: Middle East & Africa Debt Payoff App Revenue (million), by Application 2025 & 2033
- Figure 21: Middle East & Africa Debt Payoff App Revenue Share (%), by Application 2025 & 2033
- Figure 22: Middle East & Africa Debt Payoff App Revenue (million), by Types 2025 & 2033
- Figure 23: Middle East & Africa Debt Payoff App Revenue Share (%), by Types 2025 & 2033
- Figure 24: Middle East & Africa Debt Payoff App Revenue (million), by Country 2025 & 2033
- Figure 25: Middle East & Africa Debt Payoff App Revenue Share (%), by Country 2025 & 2033
- Figure 26: Asia Pacific Debt Payoff App Revenue (million), by Application 2025 & 2033
- Figure 27: Asia Pacific Debt Payoff App Revenue Share (%), by Application 2025 & 2033
- Figure 28: Asia Pacific Debt Payoff App Revenue (million), by Types 2025 & 2033
- Figure 29: Asia Pacific Debt Payoff App Revenue Share (%), by Types 2025 & 2033
- Figure 30: Asia Pacific Debt Payoff App Revenue (million), by Country 2025 & 2033
- Figure 31: Asia Pacific Debt Payoff App Revenue Share (%), by Country 2025 & 2033
List of Tables
- Table 1: Global Debt Payoff App Revenue million Forecast, by Application 2020 & 2033
- Table 2: Global Debt Payoff App Revenue million Forecast, by Types 2020 & 2033
- Table 3: Global Debt Payoff App Revenue million Forecast, by Region 2020 & 2033
- Table 4: Global Debt Payoff App Revenue million Forecast, by Application 2020 & 2033
- Table 5: Global Debt Payoff App Revenue million Forecast, by Types 2020 & 2033
- Table 6: Global Debt Payoff App Revenue million Forecast, by Country 2020 & 2033
- Table 7: United States Debt Payoff App Revenue (million) Forecast, by Application 2020 & 2033
- Table 8: Canada Debt Payoff App Revenue (million) Forecast, by Application 2020 & 2033
- Table 9: Mexico Debt Payoff App Revenue (million) Forecast, by Application 2020 & 2033
- Table 10: Global Debt Payoff App Revenue million Forecast, by Application 2020 & 2033
- Table 11: Global Debt Payoff App Revenue million Forecast, by Types 2020 & 2033
- Table 12: Global Debt Payoff App Revenue million Forecast, by Country 2020 & 2033
- Table 13: Brazil Debt Payoff App Revenue (million) Forecast, by Application 2020 & 2033
- Table 14: Argentina Debt Payoff App Revenue (million) Forecast, by Application 2020 & 2033
- Table 15: Rest of South America Debt Payoff App Revenue (million) Forecast, by Application 2020 & 2033
- Table 16: Global Debt Payoff App Revenue million Forecast, by Application 2020 & 2033
- Table 17: Global Debt Payoff App Revenue million Forecast, by Types 2020 & 2033
- Table 18: Global Debt Payoff App Revenue million Forecast, by Country 2020 & 2033
- Table 19: United Kingdom Debt Payoff App Revenue (million) Forecast, by Application 2020 & 2033
- Table 20: Germany Debt Payoff App Revenue (million) Forecast, by Application 2020 & 2033
- Table 21: France Debt Payoff App Revenue (million) Forecast, by Application 2020 & 2033
- Table 22: Italy Debt Payoff App Revenue (million) Forecast, by Application 2020 & 2033
- Table 23: Spain Debt Payoff App Revenue (million) Forecast, by Application 2020 & 2033
- Table 24: Russia Debt Payoff App Revenue (million) Forecast, by Application 2020 & 2033
- Table 25: Benelux Debt Payoff App Revenue (million) Forecast, by Application 2020 & 2033
- Table 26: Nordics Debt Payoff App Revenue (million) Forecast, by Application 2020 & 2033
- Table 27: Rest of Europe Debt Payoff App Revenue (million) Forecast, by Application 2020 & 2033
- Table 28: Global Debt Payoff App Revenue million Forecast, by Application 2020 & 2033
- Table 29: Global Debt Payoff App Revenue million Forecast, by Types 2020 & 2033
- Table 30: Global Debt Payoff App Revenue million Forecast, by Country 2020 & 2033
- Table 31: Turkey Debt Payoff App Revenue (million) Forecast, by Application 2020 & 2033
- Table 32: Israel Debt Payoff App Revenue (million) Forecast, by Application 2020 & 2033
- Table 33: GCC Debt Payoff App Revenue (million) Forecast, by Application 2020 & 2033
- Table 34: North Africa Debt Payoff App Revenue (million) Forecast, by Application 2020 & 2033
- Table 35: South Africa Debt Payoff App Revenue (million) Forecast, by Application 2020 & 2033
- Table 36: Rest of Middle East & Africa Debt Payoff App Revenue (million) Forecast, by Application 2020 & 2033
- Table 37: Global Debt Payoff App Revenue million Forecast, by Application 2020 & 2033
- Table 38: Global Debt Payoff App Revenue million Forecast, by Types 2020 & 2033
- Table 39: Global Debt Payoff App Revenue million Forecast, by Country 2020 & 2033
- Table 40: China Debt Payoff App Revenue (million) Forecast, by Application 2020 & 2033
- Table 41: India Debt Payoff App Revenue (million) Forecast, by Application 2020 & 2033
- Table 42: Japan Debt Payoff App Revenue (million) Forecast, by Application 2020 & 2033
- Table 43: South Korea Debt Payoff App Revenue (million) Forecast, by Application 2020 & 2033
- Table 44: ASEAN Debt Payoff App Revenue (million) Forecast, by Application 2020 & 2033
- Table 45: Oceania Debt Payoff App Revenue (million) Forecast, by Application 2020 & 2033
- Table 46: Rest of Asia Pacific Debt Payoff App Revenue (million) Forecast, by Application 2020 & 2033
Frequently Asked Questions
1. What is the projected Compound Annual Growth Rate (CAGR) of the Debt Payoff App?
The projected CAGR is approximately 8.2%.
2. Which companies are prominent players in the Debt Payoff App?
Key companies in the market include Debt Payoff Planner, Qapital, ZilchWorks, Undebt.it, Unbury.me, Vertex42, Debt Payoff Assistant, Bright Money, Qoins, Earnin, Credit Karma, Tally, Relief App, Freedom Debt Relief, Achieve GOOD, YNAB.
3. What are the main segments of the Debt Payoff App?
The market segments include Application, Types.
4. Can you provide details about the market size?
The market size is estimated to be USD 4189 million as of 2022.
5. What are some drivers contributing to market growth?
N/A
6. What are the notable trends driving market growth?
N/A
7. Are there any restraints impacting market growth?
N/A
8. Can you provide examples of recent developments in the market?
N/A
9. What pricing options are available for accessing the report?
Pricing options include single-user, multi-user, and enterprise licenses priced at USD 2900.00, USD 4350.00, and USD 5800.00 respectively.
10. Is the market size provided in terms of value or volume?
The market size is provided in terms of value, measured in million.
11. Are there any specific market keywords associated with the report?
Yes, the market keyword associated with the report is "Debt Payoff App," which aids in identifying and referencing the specific market segment covered.
12. How do I determine which pricing option suits my needs best?
The pricing options vary based on user requirements and access needs. Individual users may opt for single-user licenses, while businesses requiring broader access may choose multi-user or enterprise licenses for cost-effective access to the report.
13. Are there any additional resources or data provided in the Debt Payoff App report?
While the report offers comprehensive insights, it's advisable to review the specific contents or supplementary materials provided to ascertain if additional resources or data are available.
14. How can I stay updated on further developments or reports in the Debt Payoff App?
To stay informed about further developments, trends, and reports in the Debt Payoff App, consider subscribing to industry newsletters, following relevant companies and organizations, or regularly checking reputable industry news sources and publications.
Methodology
Step 1 - Identification of Relevant Samples Size from Population Database


Step 2 - Approaches for Defining Global Market Size (Value, Volume* & Price*)

Note*: In applicable scenarios
Step 3 - Data Sources
Primary Research
- Web Analytics
- Survey Reports
- Research Institute
- Latest Research Reports
- Opinion Leaders
Secondary Research
- Annual Reports
- White Paper
- Latest Press Release
- Industry Association
- Paid Database
- Investor Presentations

Step 4 - Data Triangulation
Involves using different sources of information in order to increase the validity of a study
These sources are likely to be stakeholders in a program - participants, other researchers, program staff, other community members, and so on.
Then we put all data in single framework & apply various statistical tools to find out the dynamic on the market.
During the analysis stage, feedback from the stakeholder groups would be compared to determine areas of agreement as well as areas of divergence