

Key Insights
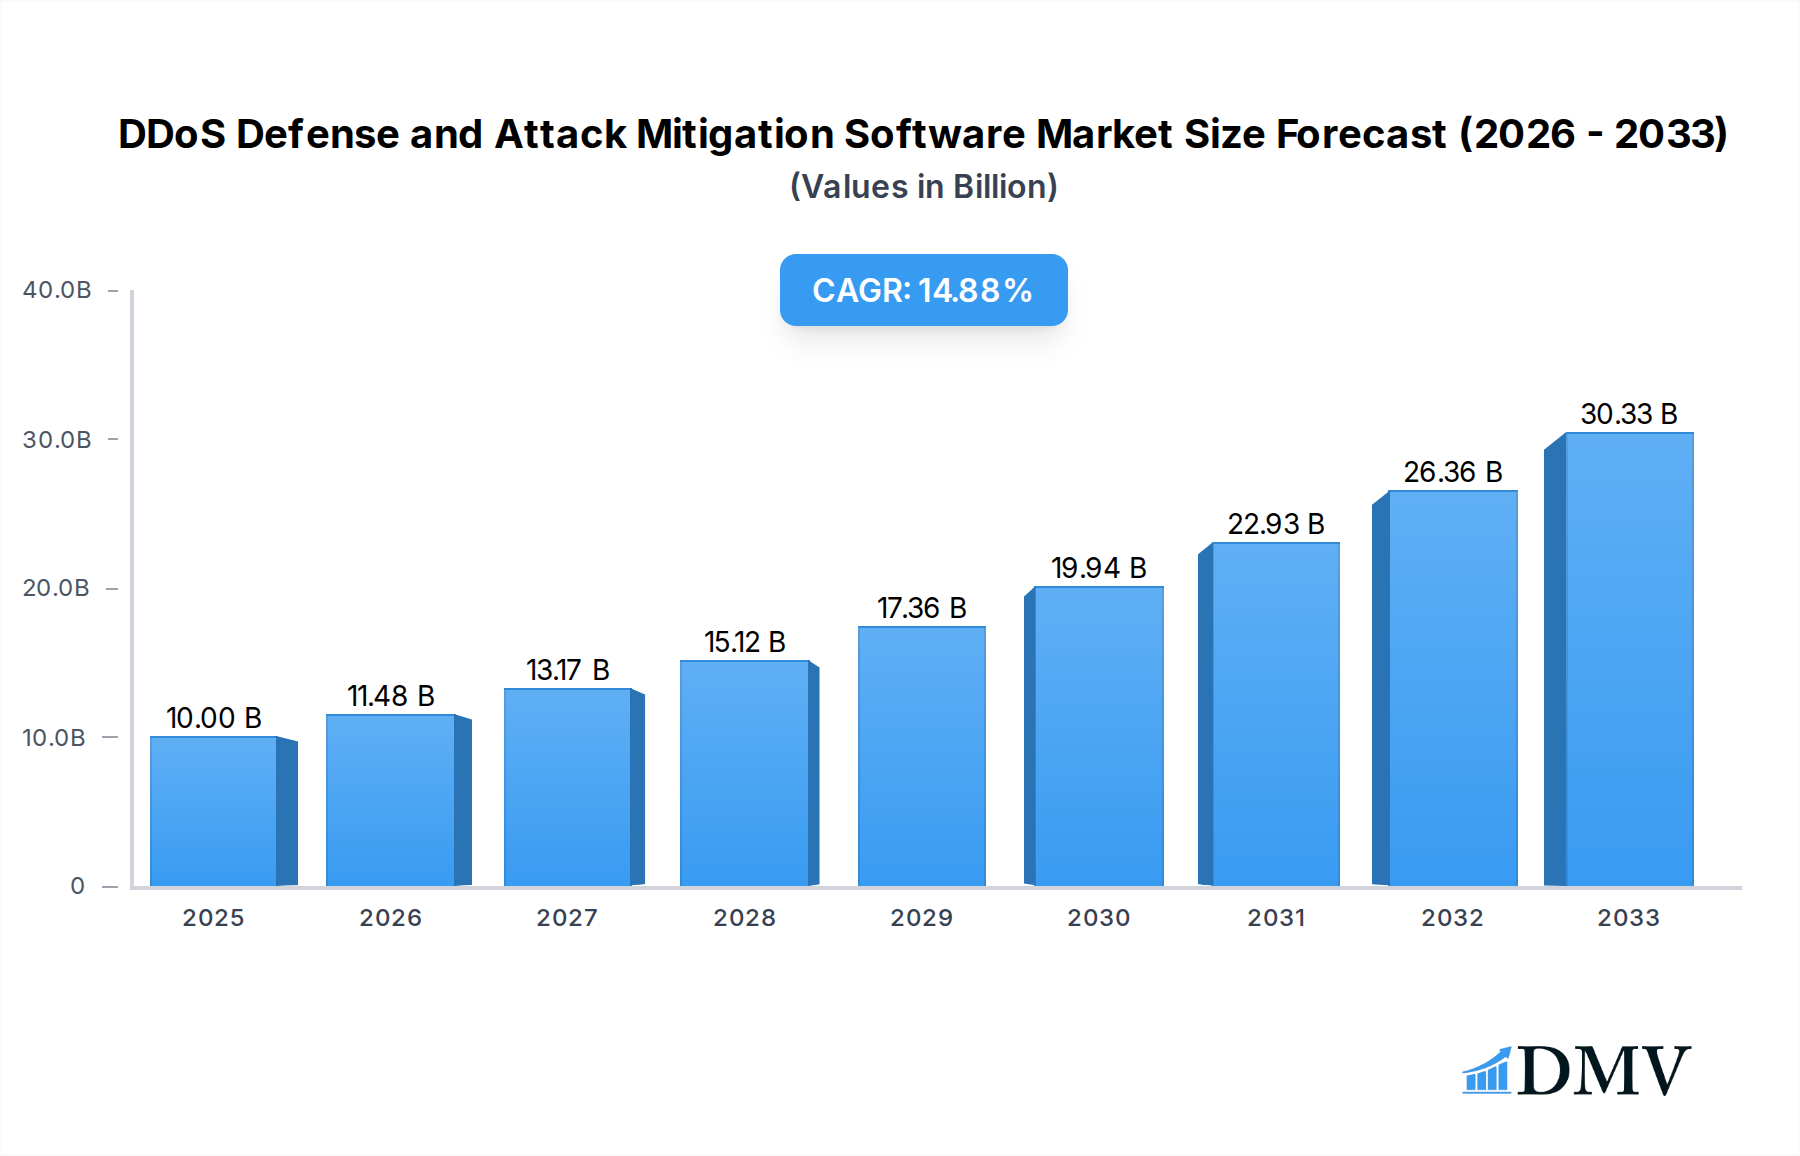
The global DDoS Defense and Attack Mitigation Software market is experiencing robust growth, projected to reach an estimated $10 billion in 2025. This expansion is fueled by an escalating frequency and sophistication of Distributed Denial of Service (DDoS) attacks, which pose significant threats to businesses and governments worldwide. Organizations are increasingly investing in advanced security solutions to safeguard their digital infrastructure, ensuring business continuity and protecting sensitive data. Key drivers include the proliferation of connected devices, the rise of IoT, and the increasing reliance on cloud-based services, all of which expand the attack surface. Furthermore, the growing adoption of hybrid and multi-cloud environments necessitates comprehensive and adaptable DDoS mitigation strategies. The market is characterized by a CAGR of 14.8%, indicating a strong upward trajectory for the foreseeable future, underscoring the critical need for effective defense mechanisms in the digital landscape.

DDoS Defense and Attack Mitigation Software Market Size (In Billion)
The market is segmented into various applications, including Enterprise, Government, and Operator sectors, each with unique security requirements. Cloud-based solutions are gaining significant traction due to their scalability, flexibility, and cost-effectiveness, offering dynamic protection against evolving threats. While the market presents immense opportunities, certain restraints, such as the high cost of advanced mitigation solutions and a shortage of skilled cybersecurity professionals, could temper growth. However, the continuous innovation in mitigation techniques, including AI-powered threat detection and behavioral analysis, is expected to overcome these challenges. Prominent companies like Microsoft, AWS, Netscout Systems, Radware, and Cloudflare are at the forefront, driving innovation and offering a diverse range of solutions to meet the growing demand for robust DDoS defense across all major regions, including North America, Europe, Asia Pacific, and the Middle East & Africa.
DDoS Defense and Attack Mitigation Software Company Market Share
DDoS Defense and Attack Mitigation Software Market Composition & Trends
The global DDoS Defense and Attack Mitigation Software market is a dynamic landscape characterized by a moderate concentration of established players and emerging innovators. Leading entities like Akamai, Cloudflare, and Netscout Systems command significant market share, with their comprehensive cloud-based solutions. However, the market is continually shaped by innovation catalysts such as the increasing sophistication of DDoS attacks, the proliferation of IoT devices creating larger attack vectors, and the escalating need for robust cybersecurity for critical infrastructure and enterprise data. Regulatory landscapes, including data privacy laws and mandates for network resilience, also play a crucial role in driving adoption. Substitute products, such as basic firewall solutions or manual intervention, are increasingly being phased out in favor of automated, intelligent DDoS mitigation platforms. End-user profiles span across Enterprises demanding uninterrupted service availability, Governments protecting national infrastructure, and Operators ensuring network stability for their subscribers. Mergers and acquisitions (M&A) activities are moderate, with deal values estimated to be in the range of several hundred million to over a billion dollars, as larger players consolidate their offerings and acquire specialized technologies. For instance, Net (TransUnion) acquired Neustar for an estimated $3.1 billion, significantly bolstering its identity resolution and cybersecurity capabilities, including DDoS defense. The market share distribution shows a lean towards cloud-based solutions, accounting for an estimated 60% of the market, with on-premise solutions holding the remaining 40%. M&A deal values are projected to exceed $1.5 billion by 2025, driven by the need for integrated security suites.
DDoS Defense and Attack Mitigation Software Industry Evolution
The DDoS Defense and Attack Mitigation Software industry has undergone a transformative evolution, driven by escalating cyber threats and an increasingly interconnected digital world. From its nascent stages, focused on basic volumetric attack prevention, the market has rapidly advanced to encompass sophisticated application-layer and protocol-based attack mitigation, along with advanced threat intelligence and anomaly detection capabilities. The historical period from 2019 to 2024 witnessed a steady increase in attack frequency and severity, prompting substantial investments in security solutions. During this time, cloud-based DDoS mitigation services gained significant traction, offering scalability and cost-effectiveness compared to traditional on-premise hardware. Technological advancements have been pivotal, with the integration of Artificial Intelligence (AI) and Machine Learning (ML) becoming a standard feature in leading platforms, enabling real-time threat identification and automated response mechanisms. The adoption of these advanced technologies has been rapid, with an estimated 70% of enterprises implementing AI/ML-driven DDoS defenses by the end of 2024. Consumer demands have shifted dramatically; organizations now expect proactive, intelligent, and seamless protection that minimizes downtime and preserves business continuity. The market growth trajectory has been robust, with a compound annual growth rate (CAGR) of approximately 15% from 2019 to 2024. This growth is projected to accelerate, with the base year of 2025 expected to see a market size exceeding $10 billion. The forecast period from 2025 to 2033 anticipates continued strong expansion, driven by the ever-evolving threat landscape and the critical need for resilient digital infrastructure. For example, the average cost of a significant DDoS attack for an enterprise was estimated to be over $2.5 million in 2023, a figure that continues to rise, thus justifying substantial expenditure on effective mitigation.
Leading Regions, Countries, or Segments in DDoS Defense and Attack Mitigation Software
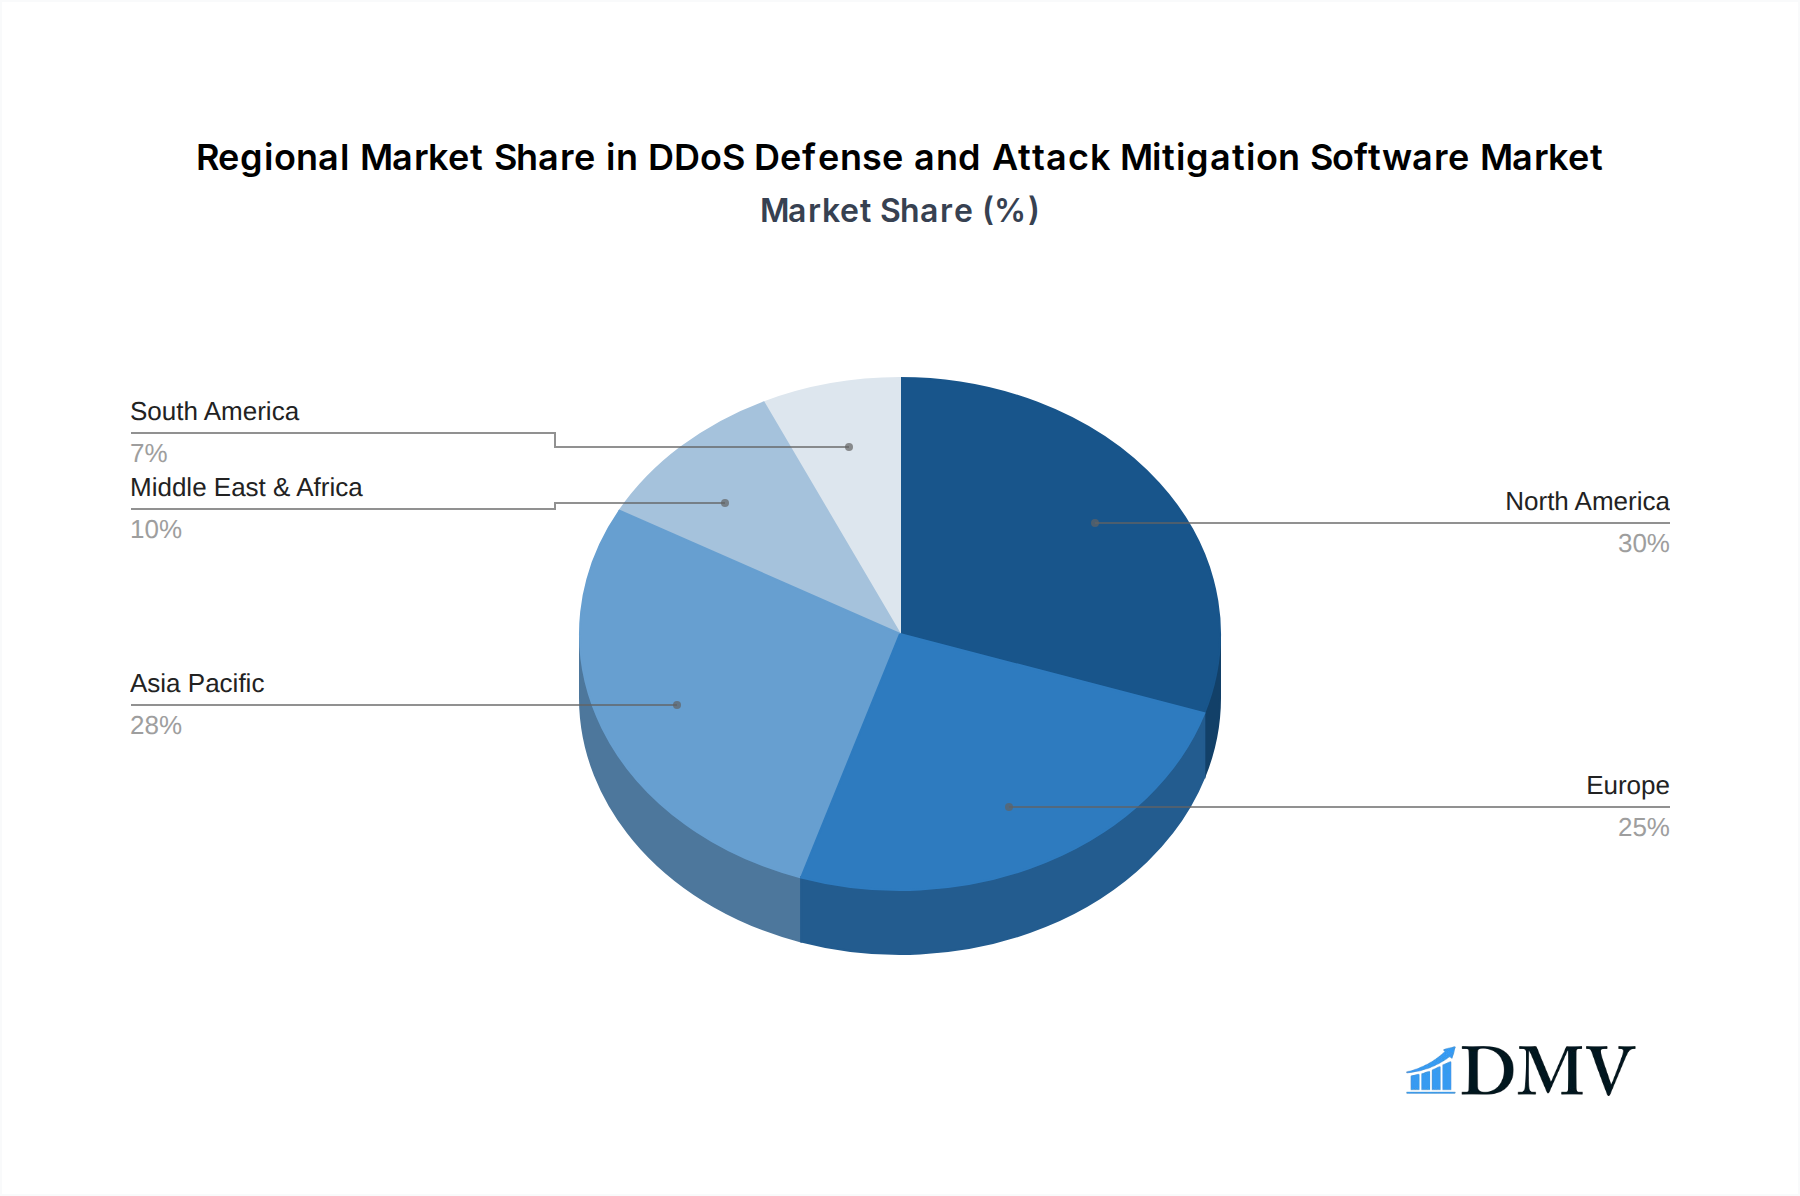
The global DDoS Defense and Attack Mitigation Software market is experiencing significant dominance and rapid growth within specific regions and segments. North America, particularly the United States, consistently leads in terms of market size and investment, driven by a mature digital economy, a high concentration of enterprises across various sectors, and stringent regulatory frameworks like the Cybersecurity Enhancement Act. The Enterprise segment stands out as a primary driver of market demand. Enterprises across finance, e-commerce, healthcare, and technology sectors are prioritizing uninterrupted service availability, making them the largest consumers of advanced DDoS mitigation solutions. Investment trends in this segment are robust, with an estimated $4 billion in cybersecurity spending specifically for DDoS defense in the US alone in 2025.
- Dominant Segment (Application): Enterprise
- Key Drivers: Criticality of online services, immense financial losses from downtime, and evolving sophistication of application-layer attacks targeting web applications and APIs.
- Investment Trends: Continued high R&D investment in AI/ML-powered detection and mitigation, proactive threat hunting services, and integrated security platforms.
- Regulatory Support: While not always direct mandates, regulations emphasizing data protection and business continuity indirectly drive enterprise adoption.
The Cloud-based deployment type is the undisputed leader in the market, accounting for an estimated 65% of the total market share in 2025. This dominance is attributed to the inherent scalability, flexibility, and cost-effectiveness of cloud solutions, which can adapt to the fluctuating demands of DDoS attacks without requiring significant upfront hardware investment.
- Dominant Segment (Type): Cloud-based
- Key Drivers: Elasticity to handle massive attack volumes, rapid deployment and updates, reduced operational overhead, and the ability to leverage global networks of scrubbing centers.
- Adoption Metrics: An estimated 80% of new DDoS mitigation solution deployments are cloud-based in 2025.
- Market Potential: The cloud-based segment is projected to grow at a CAGR of over 18% from 2025 to 2033, far outpacing on-premise solutions.
While North America leads, the Asia-Pacific region, particularly China, is emerging as a formidable market, fueled by rapid digitalization, a substantial increase in cyber threats, and government initiatives to bolster national cybersecurity. Leading players like Tencent Cloud, Alibaba Cloud Computing, and NSFOCUS are making significant inroads in this region, catering to a growing demand from both enterprises and government entities. The Government segment also represents a significant and growing application, with nations investing heavily in protecting critical infrastructure and sensitive data from nation-state-sponsored attacks. The estimated global market size for DDoS Defense and Attack Mitigation Software in 2025 is projected to reach $12.5 billion, with North America holding an estimated 40% share and Asia-Pacific showing the fastest growth rate at over 20%.
DDoS Defense and Attack Mitigation Software Product Innovations
Product innovations in DDoS Defense and Attack Mitigation Software are rapidly advancing to combat increasingly sophisticated threats. Key advancements include the integration of AI and machine learning for real-time, predictive threat detection, enabling proactive mitigation before an attack fully materializes. Advanced behavioral analysis and anomaly detection are now standard, allowing platforms to distinguish legitimate traffic from malicious intent with unparalleled accuracy. Innovations in application-layer attack mitigation, including WAF (Web Application Firewall) integration and bot management, offer granular protection against complex exploits targeting specific vulnerabilities. Performance metrics are continuously improving, with advertised mitigation speeds reaching several hundred Gigabits per second (Gbps) and latency reductions to under 50 milliseconds for critical traffic. Unique selling propositions now revolve around comprehensive, multi-layered defense strategies that go beyond volumetric attacks to encompass sophisticated botnets and zero-day exploits, ensuring business continuity and data integrity for organizations worldwide. The estimated investment in R&D for these innovations exceeds $1.2 billion annually.
Propelling Factors for DDoS Defense and Attack Mitigation Software Growth
The growth of the DDoS Defense and Attack Mitigation Software market is propelled by several critical factors. Technological advancements in attack vectors, such as the rise of botnets and IoT-based attacks, necessitate more sophisticated defense mechanisms. The increasing reliance on digital infrastructure for critical services across sectors like finance, healthcare, and government amplifies the potential damage from DDoS attacks, driving demand for robust protection. Regulatory compliance and data privacy mandates are also significant drivers, as organizations must demonstrate resilience and protect sensitive information. Furthermore, the economic impact of downtime, with escalating financial losses from service disruptions, pushes businesses to invest proactively in mitigation solutions. For example, the estimated average cost of a DDoS attack exceeding 24 hours for a large enterprise is upwards of $3 million, making prevention a clear economic imperative.
Obstacles in the DDoS Defense and Attack Mitigation Software Market
Despite robust growth, the DDoS Defense and Attack Mitigation Software market faces several obstacles. The escalating complexity and sheer volume of DDoS attacks pose a constant challenge, requiring continuous adaptation and innovation from defense providers. The high cost of advanced mitigation solutions, particularly for smaller businesses, can be a significant barrier to adoption, with enterprise-grade solutions potentially costing several hundred thousand dollars annually. Shortage of skilled cybersecurity professionals to manage and optimize these complex systems also presents a restraint. Additionally, supply chain disruptions impacting hardware availability can indirectly affect on-premise deployments. Finally, the evolving nature of cyber threats, with attackers constantly developing new methodologies, creates an ongoing arms race that requires significant investment in research and development.
Future Opportunities in DDoS Defense and Attack Mitigation Software
The future of DDoS Defense and Attack Mitigation Software presents numerous opportunities. The burgeoning Internet of Things (IoT) ecosystem, with its vast array of connected devices, creates a massive attack surface ripe for new mitigation strategies and specialized solutions. The increasing adoption of hybrid and multi-cloud environments necessitates integrated, cloud-agnostic DDoS protection services. Furthermore, the growing demand for managed security services (MSSPs) for DDoS mitigation offers significant opportunities for service providers to offer specialized expertise and comprehensive protection. The development of more advanced AI-powered predictive analytics and automated response systems will continue to be a key area for innovation and market differentiation. The expanding digitalization in emerging economies also presents untapped market potential, with an estimated market penetration of less than 30% in some developing regions.
Major Players in the DDoS Defense and Attack Mitigation Software Ecosystem
The DDoS Defense and Attack Mitigation Software ecosystem comprises a competitive landscape of established cybersecurity giants and specialized vendors. Key players include:
- Akamai
- Cloudflare
- Netscout Systems
- Radware
- F5
- Fortinet
- A10 Network
- Microsoft
- AWS
- Link11
- Neustar (TransUnion)
- Sucuri
- Myra Security
- Nexusguard
- NSFOCUS
- Tencent Cloud
- Alibaba Cloud Computing
- China Telecom Corporation
- China Mobile Communications Group
- Baidu
- NetEase
- Qi An Xin Technology Group
- Venustech
- Zhongxin Cyber Security
- Kownsec Informaiton Technology
- GTS Telecom
- Clouvider
Key Developments in DDoS Defense and Attack Mitigation Software Industry
- 2023: Cloudflare launches its enhanced Bot Management solution, leveraging AI to combat sophisticated bot-driven DDoS attacks, significantly improving detection rates by an estimated 30%.
- 2023: Akamai introduces new threat intelligence feeds, enhancing its DDoS mitigation platform with real-time insights into emerging attack vectors, bolstering its defense capabilities.
- 2024: Microsoft Azure announces expanded DDoS protection capabilities, offering a more integrated and robust suite for its cloud customers, reflecting a market trend towards comprehensive cloud security.
- 2024: Radware unveils its next-generation DDoS mitigation appliance, focusing on hybrid deployment models and enhanced application-layer attack protection, catering to evolving enterprise needs.
- 2024: Netscout Systems reports a significant increase in IoT-based botnet attacks, prompting them to invest heavily in specialized IoT security and mitigation solutions.
- 2025: China Mobile Communications Group announces significant investments in bolstering its national network resilience against large-scale DDoS attacks, highlighting government-led security initiatives in the Asia-Pacific region.
- 2025: NSFOCUS releases a new report detailing the increasing financial impact of DDoS attacks on businesses, estimated to exceed $15 billion globally, further underscoring the market's importance.
- 2025: A10 Networks announces strategic partnerships to integrate its DDoS defense solutions with leading SD-WAN providers, aiming for more streamlined and secure network deployments.
- 2025: Link11 enhances its cloud-based DDoS protection with advanced machine learning algorithms, promising to reduce false positives and improve mitigation accuracy by an estimated 25%.
- 2026: The market is expected to see significant advancements in AI-driven predictive DDoS mitigation, potentially preventing attacks before they even launch, a leap from current reactive and real-time measures.
Strategic DDoS Defense and Attack Mitigation Software Market Forecast
The strategic forecast for the DDoS Defense and Attack Mitigation Software market is exceptionally positive, driven by an unrelenting escalation in cyber threats and the indispensable need for uninterrupted digital operations. Future growth will be fueled by the increasing adoption of AI and machine learning for predictive threat intelligence and automated mitigation, ensuring proactive defense against sophisticated attacks. The expansion of cloud-native security solutions and managed services will continue to democratize access to robust protection for businesses of all sizes. Emerging markets, particularly in Asia-Pacific and Latin America, present significant untapped potential. Investments in securing the burgeoning IoT ecosystem and the development of hybrid cloud security strategies will be critical focal points. The market is projected to reach a valuation exceeding $25 billion by 2033, with a consistent CAGR of over 16%, underscoring its strategic importance in the global cybersecurity landscape.
DDoS Defense and Attack Mitigation Software Segmentation
-
1. Application
- 1.1. Enterprise
- 1.2. Government
- 1.3. Operator
- 1.4. Others
-
2. Types
- 2.1. Cloud-based
- 2.2. On-Premise
DDoS Defense and Attack Mitigation Software Segmentation By Geography
-
1. North America
- 1.1. United States
- 1.2. Canada
- 1.3. Mexico
-
2. South America
- 2.1. Brazil
- 2.2. Argentina
- 2.3. Rest of South America
-
3. Europe
- 3.1. United Kingdom
- 3.2. Germany
- 3.3. France
- 3.4. Italy
- 3.5. Spain
- 3.6. Russia
- 3.7. Benelux
- 3.8. Nordics
- 3.9. Rest of Europe
-
4. Middle East & Africa
- 4.1. Turkey
- 4.2. Israel
- 4.3. GCC
- 4.4. North Africa
- 4.5. South Africa
- 4.6. Rest of Middle East & Africa
-
5. Asia Pacific
- 5.1. China
- 5.2. India
- 5.3. Japan
- 5.4. South Korea
- 5.5. ASEAN
- 5.6. Oceania
- 5.7. Rest of Asia Pacific
DDoS Defense and Attack Mitigation Software Regional Market Share
Geographic Coverage of DDoS Defense and Attack Mitigation Software
DDoS Defense and Attack Mitigation Software REPORT HIGHLIGHTS
| Aspects | Details |
|---|---|
| Study Period | 2020-2034 |
| Base Year | 2025 |
| Estimated Year | 2026 |
| Forecast Period | 2026-2034 |
| Historical Period | 2020-2025 |
| Growth Rate | CAGR of 14.8% from 2020-2034 |
| Segmentation |
|
Table of Contents
- 1. Introduction
- 1.1. Research Scope
- 1.2. Market Segmentation
- 1.3. Research Methodology
- 1.4. Definitions and Assumptions
- 2. Executive Summary
- 2.1. Introduction
- 3. Market Dynamics
- 3.1. Introduction
- 3.2. Market Drivers
- 3.3. Market Restrains
- 3.4. Market Trends
- 4. Market Factor Analysis
- 4.1. Porters Five Forces
- 4.2. Supply/Value Chain
- 4.3. PESTEL analysis
- 4.4. Market Entropy
- 4.5. Patent/Trademark Analysis
- 5. Global DDoS Defense and Attack Mitigation Software Analysis, Insights and Forecast, 2020-2032
- 5.1. Market Analysis, Insights and Forecast - by Application
- 5.1.1. Enterprise
- 5.1.2. Government
- 5.1.3. Operator
- 5.1.4. Others
- 5.2. Market Analysis, Insights and Forecast - by Types
- 5.2.1. Cloud-based
- 5.2.2. On-Premise
- 5.3. Market Analysis, Insights and Forecast - by Region
- 5.3.1. North America
- 5.3.2. South America
- 5.3.3. Europe
- 5.3.4. Middle East & Africa
- 5.3.5. Asia Pacific
- 5.1. Market Analysis, Insights and Forecast - by Application
- 6. North America DDoS Defense and Attack Mitigation Software Analysis, Insights and Forecast, 2020-2032
- 6.1. Market Analysis, Insights and Forecast - by Application
- 6.1.1. Enterprise
- 6.1.2. Government
- 6.1.3. Operator
- 6.1.4. Others
- 6.2. Market Analysis, Insights and Forecast - by Types
- 6.2.1. Cloud-based
- 6.2.2. On-Premise
- 6.1. Market Analysis, Insights and Forecast - by Application
- 7. South America DDoS Defense and Attack Mitigation Software Analysis, Insights and Forecast, 2020-2032
- 7.1. Market Analysis, Insights and Forecast - by Application
- 7.1.1. Enterprise
- 7.1.2. Government
- 7.1.3. Operator
- 7.1.4. Others
- 7.2. Market Analysis, Insights and Forecast - by Types
- 7.2.1. Cloud-based
- 7.2.2. On-Premise
- 7.1. Market Analysis, Insights and Forecast - by Application
- 8. Europe DDoS Defense and Attack Mitigation Software Analysis, Insights and Forecast, 2020-2032
- 8.1. Market Analysis, Insights and Forecast - by Application
- 8.1.1. Enterprise
- 8.1.2. Government
- 8.1.3. Operator
- 8.1.4. Others
- 8.2. Market Analysis, Insights and Forecast - by Types
- 8.2.1. Cloud-based
- 8.2.2. On-Premise
- 8.1. Market Analysis, Insights and Forecast - by Application
- 9. Middle East & Africa DDoS Defense and Attack Mitigation Software Analysis, Insights and Forecast, 2020-2032
- 9.1. Market Analysis, Insights and Forecast - by Application
- 9.1.1. Enterprise
- 9.1.2. Government
- 9.1.3. Operator
- 9.1.4. Others
- 9.2. Market Analysis, Insights and Forecast - by Types
- 9.2.1. Cloud-based
- 9.2.2. On-Premise
- 9.1. Market Analysis, Insights and Forecast - by Application
- 10. Asia Pacific DDoS Defense and Attack Mitigation Software Analysis, Insights and Forecast, 2020-2032
- 10.1. Market Analysis, Insights and Forecast - by Application
- 10.1.1. Enterprise
- 10.1.2. Government
- 10.1.3. Operator
- 10.1.4. Others
- 10.2. Market Analysis, Insights and Forecast - by Types
- 10.2.1. Cloud-based
- 10.2.2. On-Premise
- 10.1. Market Analysis, Insights and Forecast - by Application
- 11. Competitive Analysis
- 11.1. Global Market Share Analysis 2025
- 11.2. Company Profiles
- 11.2.1 Microsoft
- 11.2.1.1. Overview
- 11.2.1.2. Products
- 11.2.1.3. SWOT Analysis
- 11.2.1.4. Recent Developments
- 11.2.1.5. Financials (Based on Availability)
- 11.2.2 AWS
- 11.2.2.1. Overview
- 11.2.2.2. Products
- 11.2.2.3. SWOT Analysis
- 11.2.2.4. Recent Developments
- 11.2.2.5. Financials (Based on Availability)
- 11.2.3 Netscout Systems
- 11.2.3.1. Overview
- 11.2.3.2. Products
- 11.2.3.3. SWOT Analysis
- 11.2.3.4. Recent Developments
- 11.2.3.5. Financials (Based on Availability)
- 11.2.4 Radware
- 11.2.4.1. Overview
- 11.2.4.2. Products
- 11.2.4.3. SWOT Analysis
- 11.2.4.4. Recent Developments
- 11.2.4.5. Financials (Based on Availability)
- 11.2.5 Cloudflare
- 11.2.5.1. Overview
- 11.2.5.2. Products
- 11.2.5.3. SWOT Analysis
- 11.2.5.4. Recent Developments
- 11.2.5.5. Financials (Based on Availability)
- 11.2.6 SolarWinds
- 11.2.6.1. Overview
- 11.2.6.2. Products
- 11.2.6.3. SWOT Analysis
- 11.2.6.4. Recent Developments
- 11.2.6.5. Financials (Based on Availability)
- 11.2.7 Fortinet
- 11.2.7.1. Overview
- 11.2.7.2. Products
- 11.2.7.3. SWOT Analysis
- 11.2.7.4. Recent Developments
- 11.2.7.5. Financials (Based on Availability)
- 11.2.8 Akamai
- 11.2.8.1. Overview
- 11.2.8.2. Products
- 11.2.8.3. SWOT Analysis
- 11.2.8.4. Recent Developments
- 11.2.8.5. Financials (Based on Availability)
- 11.2.9 Link11
- 11.2.9.1. Overview
- 11.2.9.2. Products
- 11.2.9.3. SWOT Analysis
- 11.2.9.4. Recent Developments
- 11.2.9.5. Financials (Based on Availability)
- 11.2.10 Neustar (TransUnion)
- 11.2.10.1. Overview
- 11.2.10.2. Products
- 11.2.10.3. SWOT Analysis
- 11.2.10.4. Recent Developments
- 11.2.10.5. Financials (Based on Availability)
- 11.2.11 GTS Telecom
- 11.2.11.1. Overview
- 11.2.11.2. Products
- 11.2.11.3. SWOT Analysis
- 11.2.11.4. Recent Developments
- 11.2.11.5. Financials (Based on Availability)
- 11.2.12 F5
- 11.2.12.1. Overview
- 11.2.12.2. Products
- 11.2.12.3. SWOT Analysis
- 11.2.12.4. Recent Developments
- 11.2.12.5. Financials (Based on Availability)
- 11.2.13 Sucuri
- 11.2.13.1. Overview
- 11.2.13.2. Products
- 11.2.13.3. SWOT Analysis
- 11.2.13.4. Recent Developments
- 11.2.13.5. Financials (Based on Availability)
- 11.2.14 Myra Security
- 11.2.14.1. Overview
- 11.2.14.2. Products
- 11.2.14.3. SWOT Analysis
- 11.2.14.4. Recent Developments
- 11.2.14.5. Financials (Based on Availability)
- 11.2.15 A10 Network
- 11.2.15.1. Overview
- 11.2.15.2. Products
- 11.2.15.3. SWOT Analysis
- 11.2.15.4. Recent Developments
- 11.2.15.5. Financials (Based on Availability)
- 11.2.16 Clouvider
- 11.2.16.1. Overview
- 11.2.16.2. Products
- 11.2.16.3. SWOT Analysis
- 11.2.16.4. Recent Developments
- 11.2.16.5. Financials (Based on Availability)
- 11.2.17 Nexusguard
- 11.2.17.1. Overview
- 11.2.17.2. Products
- 11.2.17.3. SWOT Analysis
- 11.2.17.4. Recent Developments
- 11.2.17.5. Financials (Based on Availability)
- 11.2.18 Tencent Cloud
- 11.2.18.1. Overview
- 11.2.18.2. Products
- 11.2.18.3. SWOT Analysis
- 11.2.18.4. Recent Developments
- 11.2.18.5. Financials (Based on Availability)
- 11.2.19 Alibaba Cloud Computing
- 11.2.19.1. Overview
- 11.2.19.2. Products
- 11.2.19.3. SWOT Analysis
- 11.2.19.4. Recent Developments
- 11.2.19.5. Financials (Based on Availability)
- 11.2.20 NSFOCUS
- 11.2.20.1. Overview
- 11.2.20.2. Products
- 11.2.20.3. SWOT Analysis
- 11.2.20.4. Recent Developments
- 11.2.20.5. Financials (Based on Availability)
- 11.2.21 China Telecom Corporation
- 11.2.21.1. Overview
- 11.2.21.2. Products
- 11.2.21.3. SWOT Analysis
- 11.2.21.4. Recent Developments
- 11.2.21.5. Financials (Based on Availability)
- 11.2.22 NetEase
- 11.2.22.1. Overview
- 11.2.22.2. Products
- 11.2.22.3. SWOT Analysis
- 11.2.22.4. Recent Developments
- 11.2.22.5. Financials (Based on Availability)
- 11.2.23 Baidu
- 11.2.23.1. Overview
- 11.2.23.2. Products
- 11.2.23.3. SWOT Analysis
- 11.2.23.4. Recent Developments
- 11.2.23.5. Financials (Based on Availability)
- 11.2.24 China Mobile Communications Group
- 11.2.24.1. Overview
- 11.2.24.2. Products
- 11.2.24.3. SWOT Analysis
- 11.2.24.4. Recent Developments
- 11.2.24.5. Financials (Based on Availability)
- 11.2.25 Qi An Xin Technology Group
- 11.2.25.1. Overview
- 11.2.25.2. Products
- 11.2.25.3. SWOT Analysis
- 11.2.25.4. Recent Developments
- 11.2.25.5. Financials (Based on Availability)
- 11.2.26 Venustech
- 11.2.26.1. Overview
- 11.2.26.2. Products
- 11.2.26.3. SWOT Analysis
- 11.2.26.4. Recent Developments
- 11.2.26.5. Financials (Based on Availability)
- 11.2.27 Zhongxin Cyber Security
- 11.2.27.1. Overview
- 11.2.27.2. Products
- 11.2.27.3. SWOT Analysis
- 11.2.27.4. Recent Developments
- 11.2.27.5. Financials (Based on Availability)
- 11.2.28 Kownsec Informaiton Technology
- 11.2.28.1. Overview
- 11.2.28.2. Products
- 11.2.28.3. SWOT Analysis
- 11.2.28.4. Recent Developments
- 11.2.28.5. Financials (Based on Availability)
- 11.2.1 Microsoft
List of Figures
- Figure 1: Global DDoS Defense and Attack Mitigation Software Revenue Breakdown (billion, %) by Region 2025 & 2033
- Figure 2: Global DDoS Defense and Attack Mitigation Software Volume Breakdown (K, %) by Region 2025 & 2033
- Figure 3: North America DDoS Defense and Attack Mitigation Software Revenue (billion), by Application 2025 & 2033
- Figure 4: North America DDoS Defense and Attack Mitigation Software Volume (K), by Application 2025 & 2033
- Figure 5: North America DDoS Defense and Attack Mitigation Software Revenue Share (%), by Application 2025 & 2033
- Figure 6: North America DDoS Defense and Attack Mitigation Software Volume Share (%), by Application 2025 & 2033
- Figure 7: North America DDoS Defense and Attack Mitigation Software Revenue (billion), by Types 2025 & 2033
- Figure 8: North America DDoS Defense and Attack Mitigation Software Volume (K), by Types 2025 & 2033
- Figure 9: North America DDoS Defense and Attack Mitigation Software Revenue Share (%), by Types 2025 & 2033
- Figure 10: North America DDoS Defense and Attack Mitigation Software Volume Share (%), by Types 2025 & 2033
- Figure 11: North America DDoS Defense and Attack Mitigation Software Revenue (billion), by Country 2025 & 2033
- Figure 12: North America DDoS Defense and Attack Mitigation Software Volume (K), by Country 2025 & 2033
- Figure 13: North America DDoS Defense and Attack Mitigation Software Revenue Share (%), by Country 2025 & 2033
- Figure 14: North America DDoS Defense and Attack Mitigation Software Volume Share (%), by Country 2025 & 2033
- Figure 15: South America DDoS Defense and Attack Mitigation Software Revenue (billion), by Application 2025 & 2033
- Figure 16: South America DDoS Defense and Attack Mitigation Software Volume (K), by Application 2025 & 2033
- Figure 17: South America DDoS Defense and Attack Mitigation Software Revenue Share (%), by Application 2025 & 2033
- Figure 18: South America DDoS Defense and Attack Mitigation Software Volume Share (%), by Application 2025 & 2033
- Figure 19: South America DDoS Defense and Attack Mitigation Software Revenue (billion), by Types 2025 & 2033
- Figure 20: South America DDoS Defense and Attack Mitigation Software Volume (K), by Types 2025 & 2033
- Figure 21: South America DDoS Defense and Attack Mitigation Software Revenue Share (%), by Types 2025 & 2033
- Figure 22: South America DDoS Defense and Attack Mitigation Software Volume Share (%), by Types 2025 & 2033
- Figure 23: South America DDoS Defense and Attack Mitigation Software Revenue (billion), by Country 2025 & 2033
- Figure 24: South America DDoS Defense and Attack Mitigation Software Volume (K), by Country 2025 & 2033
- Figure 25: South America DDoS Defense and Attack Mitigation Software Revenue Share (%), by Country 2025 & 2033
- Figure 26: South America DDoS Defense and Attack Mitigation Software Volume Share (%), by Country 2025 & 2033
- Figure 27: Europe DDoS Defense and Attack Mitigation Software Revenue (billion), by Application 2025 & 2033
- Figure 28: Europe DDoS Defense and Attack Mitigation Software Volume (K), by Application 2025 & 2033
- Figure 29: Europe DDoS Defense and Attack Mitigation Software Revenue Share (%), by Application 2025 & 2033
- Figure 30: Europe DDoS Defense and Attack Mitigation Software Volume Share (%), by Application 2025 & 2033
- Figure 31: Europe DDoS Defense and Attack Mitigation Software Revenue (billion), by Types 2025 & 2033
- Figure 32: Europe DDoS Defense and Attack Mitigation Software Volume (K), by Types 2025 & 2033
- Figure 33: Europe DDoS Defense and Attack Mitigation Software Revenue Share (%), by Types 2025 & 2033
- Figure 34: Europe DDoS Defense and Attack Mitigation Software Volume Share (%), by Types 2025 & 2033
- Figure 35: Europe DDoS Defense and Attack Mitigation Software Revenue (billion), by Country 2025 & 2033
- Figure 36: Europe DDoS Defense and Attack Mitigation Software Volume (K), by Country 2025 & 2033
- Figure 37: Europe DDoS Defense and Attack Mitigation Software Revenue Share (%), by Country 2025 & 2033
- Figure 38: Europe DDoS Defense and Attack Mitigation Software Volume Share (%), by Country 2025 & 2033
- Figure 39: Middle East & Africa DDoS Defense and Attack Mitigation Software Revenue (billion), by Application 2025 & 2033
- Figure 40: Middle East & Africa DDoS Defense and Attack Mitigation Software Volume (K), by Application 2025 & 2033
- Figure 41: Middle East & Africa DDoS Defense and Attack Mitigation Software Revenue Share (%), by Application 2025 & 2033
- Figure 42: Middle East & Africa DDoS Defense and Attack Mitigation Software Volume Share (%), by Application 2025 & 2033
- Figure 43: Middle East & Africa DDoS Defense and Attack Mitigation Software Revenue (billion), by Types 2025 & 2033
- Figure 44: Middle East & Africa DDoS Defense and Attack Mitigation Software Volume (K), by Types 2025 & 2033
- Figure 45: Middle East & Africa DDoS Defense and Attack Mitigation Software Revenue Share (%), by Types 2025 & 2033
- Figure 46: Middle East & Africa DDoS Defense and Attack Mitigation Software Volume Share (%), by Types 2025 & 2033
- Figure 47: Middle East & Africa DDoS Defense and Attack Mitigation Software Revenue (billion), by Country 2025 & 2033
- Figure 48: Middle East & Africa DDoS Defense and Attack Mitigation Software Volume (K), by Country 2025 & 2033
- Figure 49: Middle East & Africa DDoS Defense and Attack Mitigation Software Revenue Share (%), by Country 2025 & 2033
- Figure 50: Middle East & Africa DDoS Defense and Attack Mitigation Software Volume Share (%), by Country 2025 & 2033
- Figure 51: Asia Pacific DDoS Defense and Attack Mitigation Software Revenue (billion), by Application 2025 & 2033
- Figure 52: Asia Pacific DDoS Defense and Attack Mitigation Software Volume (K), by Application 2025 & 2033
- Figure 53: Asia Pacific DDoS Defense and Attack Mitigation Software Revenue Share (%), by Application 2025 & 2033
- Figure 54: Asia Pacific DDoS Defense and Attack Mitigation Software Volume Share (%), by Application 2025 & 2033
- Figure 55: Asia Pacific DDoS Defense and Attack Mitigation Software Revenue (billion), by Types 2025 & 2033
- Figure 56: Asia Pacific DDoS Defense and Attack Mitigation Software Volume (K), by Types 2025 & 2033
- Figure 57: Asia Pacific DDoS Defense and Attack Mitigation Software Revenue Share (%), by Types 2025 & 2033
- Figure 58: Asia Pacific DDoS Defense and Attack Mitigation Software Volume Share (%), by Types 2025 & 2033
- Figure 59: Asia Pacific DDoS Defense and Attack Mitigation Software Revenue (billion), by Country 2025 & 2033
- Figure 60: Asia Pacific DDoS Defense and Attack Mitigation Software Volume (K), by Country 2025 & 2033
- Figure 61: Asia Pacific DDoS Defense and Attack Mitigation Software Revenue Share (%), by Country 2025 & 2033
- Figure 62: Asia Pacific DDoS Defense and Attack Mitigation Software Volume Share (%), by Country 2025 & 2033
List of Tables
- Table 1: Global DDoS Defense and Attack Mitigation Software Revenue billion Forecast, by Application 2020 & 2033
- Table 2: Global DDoS Defense and Attack Mitigation Software Volume K Forecast, by Application 2020 & 2033
- Table 3: Global DDoS Defense and Attack Mitigation Software Revenue billion Forecast, by Types 2020 & 2033
- Table 4: Global DDoS Defense and Attack Mitigation Software Volume K Forecast, by Types 2020 & 2033
- Table 5: Global DDoS Defense and Attack Mitigation Software Revenue billion Forecast, by Region 2020 & 2033
- Table 6: Global DDoS Defense and Attack Mitigation Software Volume K Forecast, by Region 2020 & 2033
- Table 7: Global DDoS Defense and Attack Mitigation Software Revenue billion Forecast, by Application 2020 & 2033
- Table 8: Global DDoS Defense and Attack Mitigation Software Volume K Forecast, by Application 2020 & 2033
- Table 9: Global DDoS Defense and Attack Mitigation Software Revenue billion Forecast, by Types 2020 & 2033
- Table 10: Global DDoS Defense and Attack Mitigation Software Volume K Forecast, by Types 2020 & 2033
- Table 11: Global DDoS Defense and Attack Mitigation Software Revenue billion Forecast, by Country 2020 & 2033
- Table 12: Global DDoS Defense and Attack Mitigation Software Volume K Forecast, by Country 2020 & 2033
- Table 13: United States DDoS Defense and Attack Mitigation Software Revenue (billion) Forecast, by Application 2020 & 2033
- Table 14: United States DDoS Defense and Attack Mitigation Software Volume (K) Forecast, by Application 2020 & 2033
- Table 15: Canada DDoS Defense and Attack Mitigation Software Revenue (billion) Forecast, by Application 2020 & 2033
- Table 16: Canada DDoS Defense and Attack Mitigation Software Volume (K) Forecast, by Application 2020 & 2033
- Table 17: Mexico DDoS Defense and Attack Mitigation Software Revenue (billion) Forecast, by Application 2020 & 2033
- Table 18: Mexico DDoS Defense and Attack Mitigation Software Volume (K) Forecast, by Application 2020 & 2033
- Table 19: Global DDoS Defense and Attack Mitigation Software Revenue billion Forecast, by Application 2020 & 2033
- Table 20: Global DDoS Defense and Attack Mitigation Software Volume K Forecast, by Application 2020 & 2033
- Table 21: Global DDoS Defense and Attack Mitigation Software Revenue billion Forecast, by Types 2020 & 2033
- Table 22: Global DDoS Defense and Attack Mitigation Software Volume K Forecast, by Types 2020 & 2033
- Table 23: Global DDoS Defense and Attack Mitigation Software Revenue billion Forecast, by Country 2020 & 2033
- Table 24: Global DDoS Defense and Attack Mitigation Software Volume K Forecast, by Country 2020 & 2033
- Table 25: Brazil DDoS Defense and Attack Mitigation Software Revenue (billion) Forecast, by Application 2020 & 2033
- Table 26: Brazil DDoS Defense and Attack Mitigation Software Volume (K) Forecast, by Application 2020 & 2033
- Table 27: Argentina DDoS Defense and Attack Mitigation Software Revenue (billion) Forecast, by Application 2020 & 2033
- Table 28: Argentina DDoS Defense and Attack Mitigation Software Volume (K) Forecast, by Application 2020 & 2033
- Table 29: Rest of South America DDoS Defense and Attack Mitigation Software Revenue (billion) Forecast, by Application 2020 & 2033
- Table 30: Rest of South America DDoS Defense and Attack Mitigation Software Volume (K) Forecast, by Application 2020 & 2033
- Table 31: Global DDoS Defense and Attack Mitigation Software Revenue billion Forecast, by Application 2020 & 2033
- Table 32: Global DDoS Defense and Attack Mitigation Software Volume K Forecast, by Application 2020 & 2033
- Table 33: Global DDoS Defense and Attack Mitigation Software Revenue billion Forecast, by Types 2020 & 2033
- Table 34: Global DDoS Defense and Attack Mitigation Software Volume K Forecast, by Types 2020 & 2033
- Table 35: Global DDoS Defense and Attack Mitigation Software Revenue billion Forecast, by Country 2020 & 2033
- Table 36: Global DDoS Defense and Attack Mitigation Software Volume K Forecast, by Country 2020 & 2033
- Table 37: United Kingdom DDoS Defense and Attack Mitigation Software Revenue (billion) Forecast, by Application 2020 & 2033
- Table 38: United Kingdom DDoS Defense and Attack Mitigation Software Volume (K) Forecast, by Application 2020 & 2033
- Table 39: Germany DDoS Defense and Attack Mitigation Software Revenue (billion) Forecast, by Application 2020 & 2033
- Table 40: Germany DDoS Defense and Attack Mitigation Software Volume (K) Forecast, by Application 2020 & 2033
- Table 41: France DDoS Defense and Attack Mitigation Software Revenue (billion) Forecast, by Application 2020 & 2033
- Table 42: France DDoS Defense and Attack Mitigation Software Volume (K) Forecast, by Application 2020 & 2033
- Table 43: Italy DDoS Defense and Attack Mitigation Software Revenue (billion) Forecast, by Application 2020 & 2033
- Table 44: Italy DDoS Defense and Attack Mitigation Software Volume (K) Forecast, by Application 2020 & 2033
- Table 45: Spain DDoS Defense and Attack Mitigation Software Revenue (billion) Forecast, by Application 2020 & 2033
- Table 46: Spain DDoS Defense and Attack Mitigation Software Volume (K) Forecast, by Application 2020 & 2033
- Table 47: Russia DDoS Defense and Attack Mitigation Software Revenue (billion) Forecast, by Application 2020 & 2033
- Table 48: Russia DDoS Defense and Attack Mitigation Software Volume (K) Forecast, by Application 2020 & 2033
- Table 49: Benelux DDoS Defense and Attack Mitigation Software Revenue (billion) Forecast, by Application 2020 & 2033
- Table 50: Benelux DDoS Defense and Attack Mitigation Software Volume (K) Forecast, by Application 2020 & 2033
- Table 51: Nordics DDoS Defense and Attack Mitigation Software Revenue (billion) Forecast, by Application 2020 & 2033
- Table 52: Nordics DDoS Defense and Attack Mitigation Software Volume (K) Forecast, by Application 2020 & 2033
- Table 53: Rest of Europe DDoS Defense and Attack Mitigation Software Revenue (billion) Forecast, by Application 2020 & 2033
- Table 54: Rest of Europe DDoS Defense and Attack Mitigation Software Volume (K) Forecast, by Application 2020 & 2033
- Table 55: Global DDoS Defense and Attack Mitigation Software Revenue billion Forecast, by Application 2020 & 2033
- Table 56: Global DDoS Defense and Attack Mitigation Software Volume K Forecast, by Application 2020 & 2033
- Table 57: Global DDoS Defense and Attack Mitigation Software Revenue billion Forecast, by Types 2020 & 2033
- Table 58: Global DDoS Defense and Attack Mitigation Software Volume K Forecast, by Types 2020 & 2033
- Table 59: Global DDoS Defense and Attack Mitigation Software Revenue billion Forecast, by Country 2020 & 2033
- Table 60: Global DDoS Defense and Attack Mitigation Software Volume K Forecast, by Country 2020 & 2033
- Table 61: Turkey DDoS Defense and Attack Mitigation Software Revenue (billion) Forecast, by Application 2020 & 2033
- Table 62: Turkey DDoS Defense and Attack Mitigation Software Volume (K) Forecast, by Application 2020 & 2033
- Table 63: Israel DDoS Defense and Attack Mitigation Software Revenue (billion) Forecast, by Application 2020 & 2033
- Table 64: Israel DDoS Defense and Attack Mitigation Software Volume (K) Forecast, by Application 2020 & 2033
- Table 65: GCC DDoS Defense and Attack Mitigation Software Revenue (billion) Forecast, by Application 2020 & 2033
- Table 66: GCC DDoS Defense and Attack Mitigation Software Volume (K) Forecast, by Application 2020 & 2033
- Table 67: North Africa DDoS Defense and Attack Mitigation Software Revenue (billion) Forecast, by Application 2020 & 2033
- Table 68: North Africa DDoS Defense and Attack Mitigation Software Volume (K) Forecast, by Application 2020 & 2033
- Table 69: South Africa DDoS Defense and Attack Mitigation Software Revenue (billion) Forecast, by Application 2020 & 2033
- Table 70: South Africa DDoS Defense and Attack Mitigation Software Volume (K) Forecast, by Application 2020 & 2033
- Table 71: Rest of Middle East & Africa DDoS Defense and Attack Mitigation Software Revenue (billion) Forecast, by Application 2020 & 2033
- Table 72: Rest of Middle East & Africa DDoS Defense and Attack Mitigation Software Volume (K) Forecast, by Application 2020 & 2033
- Table 73: Global DDoS Defense and Attack Mitigation Software Revenue billion Forecast, by Application 2020 & 2033
- Table 74: Global DDoS Defense and Attack Mitigation Software Volume K Forecast, by Application 2020 & 2033
- Table 75: Global DDoS Defense and Attack Mitigation Software Revenue billion Forecast, by Types 2020 & 2033
- Table 76: Global DDoS Defense and Attack Mitigation Software Volume K Forecast, by Types 2020 & 2033
- Table 77: Global DDoS Defense and Attack Mitigation Software Revenue billion Forecast, by Country 2020 & 2033
- Table 78: Global DDoS Defense and Attack Mitigation Software Volume K Forecast, by Country 2020 & 2033
- Table 79: China DDoS Defense and Attack Mitigation Software Revenue (billion) Forecast, by Application 2020 & 2033
- Table 80: China DDoS Defense and Attack Mitigation Software Volume (K) Forecast, by Application 2020 & 2033
- Table 81: India DDoS Defense and Attack Mitigation Software Revenue (billion) Forecast, by Application 2020 & 2033
- Table 82: India DDoS Defense and Attack Mitigation Software Volume (K) Forecast, by Application 2020 & 2033
- Table 83: Japan DDoS Defense and Attack Mitigation Software Revenue (billion) Forecast, by Application 2020 & 2033
- Table 84: Japan DDoS Defense and Attack Mitigation Software Volume (K) Forecast, by Application 2020 & 2033
- Table 85: South Korea DDoS Defense and Attack Mitigation Software Revenue (billion) Forecast, by Application 2020 & 2033
- Table 86: South Korea DDoS Defense and Attack Mitigation Software Volume (K) Forecast, by Application 2020 & 2033
- Table 87: ASEAN DDoS Defense and Attack Mitigation Software Revenue (billion) Forecast, by Application 2020 & 2033
- Table 88: ASEAN DDoS Defense and Attack Mitigation Software Volume (K) Forecast, by Application 2020 & 2033
- Table 89: Oceania DDoS Defense and Attack Mitigation Software Revenue (billion) Forecast, by Application 2020 & 2033
- Table 90: Oceania DDoS Defense and Attack Mitigation Software Volume (K) Forecast, by Application 2020 & 2033
- Table 91: Rest of Asia Pacific DDoS Defense and Attack Mitigation Software Revenue (billion) Forecast, by Application 2020 & 2033
- Table 92: Rest of Asia Pacific DDoS Defense and Attack Mitigation Software Volume (K) Forecast, by Application 2020 & 2033
Frequently Asked Questions
1. What is the projected Compound Annual Growth Rate (CAGR) of the DDoS Defense and Attack Mitigation Software?
The projected CAGR is approximately 14.8%.
2. Which companies are prominent players in the DDoS Defense and Attack Mitigation Software?
Key companies in the market include Microsoft, AWS, Netscout Systems, Radware, Cloudflare, SolarWinds, Fortinet, Akamai, Link11, Neustar (TransUnion), GTS Telecom, F5, Sucuri, Myra Security, A10 Network, Clouvider, Nexusguard, Tencent Cloud, Alibaba Cloud Computing, NSFOCUS, China Telecom Corporation, NetEase, Baidu, China Mobile Communications Group, Qi An Xin Technology Group, Venustech, Zhongxin Cyber Security, Kownsec Informaiton Technology.
3. What are the main segments of the DDoS Defense and Attack Mitigation Software?
The market segments include Application, Types.
4. Can you provide details about the market size?
The market size is estimated to be USD 10 billion as of 2022.
5. What are some drivers contributing to market growth?
N/A
6. What are the notable trends driving market growth?
N/A
7. Are there any restraints impacting market growth?
N/A
8. Can you provide examples of recent developments in the market?
N/A
9. What pricing options are available for accessing the report?
Pricing options include single-user, multi-user, and enterprise licenses priced at USD 3350.00, USD 5025.00, and USD 6700.00 respectively.
10. Is the market size provided in terms of value or volume?
The market size is provided in terms of value, measured in billion and volume, measured in K.
11. Are there any specific market keywords associated with the report?
Yes, the market keyword associated with the report is "DDoS Defense and Attack Mitigation Software," which aids in identifying and referencing the specific market segment covered.
12. How do I determine which pricing option suits my needs best?
The pricing options vary based on user requirements and access needs. Individual users may opt for single-user licenses, while businesses requiring broader access may choose multi-user or enterprise licenses for cost-effective access to the report.
13. Are there any additional resources or data provided in the DDoS Defense and Attack Mitigation Software report?
While the report offers comprehensive insights, it's advisable to review the specific contents or supplementary materials provided to ascertain if additional resources or data are available.
14. How can I stay updated on further developments or reports in the DDoS Defense and Attack Mitigation Software?
To stay informed about further developments, trends, and reports in the DDoS Defense and Attack Mitigation Software, consider subscribing to industry newsletters, following relevant companies and organizations, or regularly checking reputable industry news sources and publications.
Methodology
Step 1 - Identification of Relevant Samples Size from Population Database


Step 2 - Approaches for Defining Global Market Size (Value, Volume* & Price*)

Note*: In applicable scenarios
Step 3 - Data Sources
Primary Research
- Web Analytics
- Survey Reports
- Research Institute
- Latest Research Reports
- Opinion Leaders
Secondary Research
- Annual Reports
- White Paper
- Latest Press Release
- Industry Association
- Paid Database
- Investor Presentations

Step 4 - Data Triangulation
Involves using different sources of information in order to increase the validity of a study
These sources are likely to be stakeholders in a program - participants, other researchers, program staff, other community members, and so on.
Then we put all data in single framework & apply various statistical tools to find out the dynamic on the market.
During the analysis stage, feedback from the stakeholder groups would be compared to determine areas of agreement as well as areas of divergence