

Key Insights
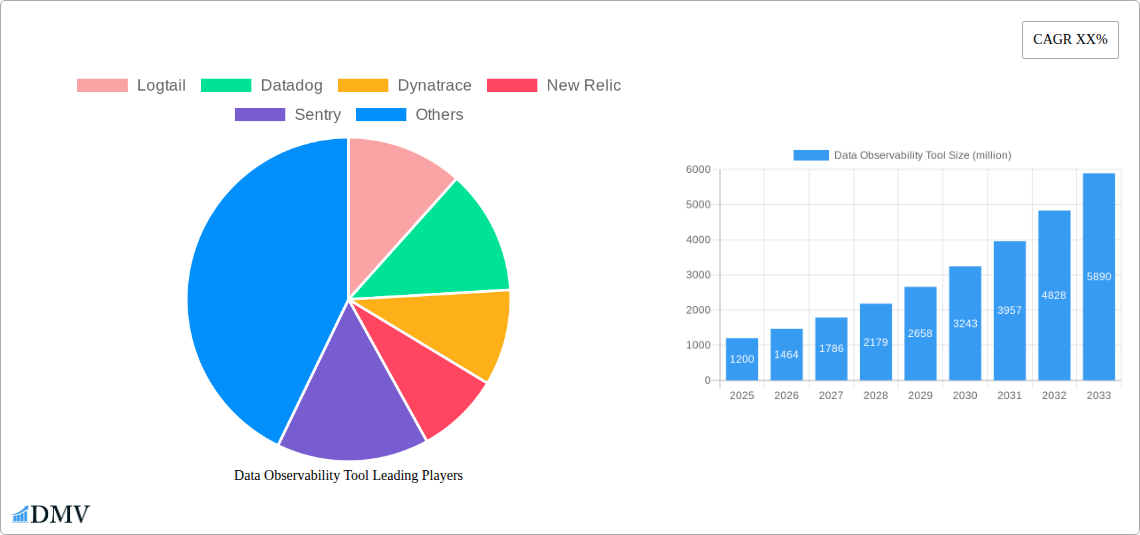
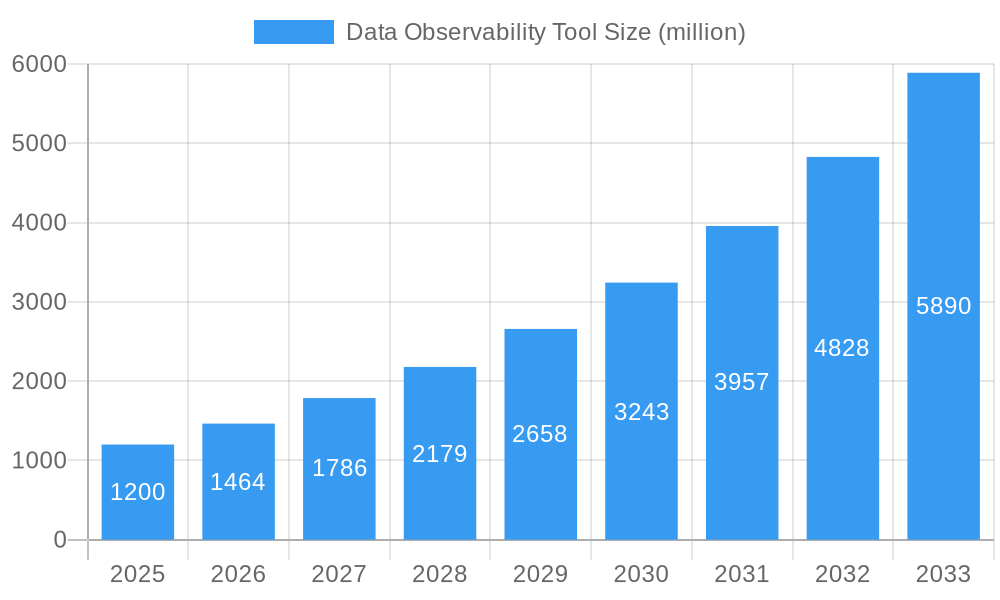
The global Data Observability Tool market is poised for substantial growth, projected to reach approximately $1.2 billion by 2025, with an impressive Compound Annual Growth Rate (CAGR) of 22% through 2033. This expansion is primarily fueled by the escalating volume and complexity of data generated across enterprises, demanding sophisticated solutions for monitoring, troubleshooting, and optimizing data pipelines. Key drivers include the increasing adoption of cloud-native architectures, the proliferation of big data analytics, and the critical need for enhanced data quality and reliability to support informed decision-making. As businesses grapple with distributed data environments and the ever-present threat of data errors, the demand for tools that provide end-to-end visibility into data flow and health is reaching new heights. The market's trajectory indicates a significant shift towards proactive data management, moving beyond reactive problem-solving to predictive insights and automated remediation.
Data Observability Tool Market Size (In Billion)
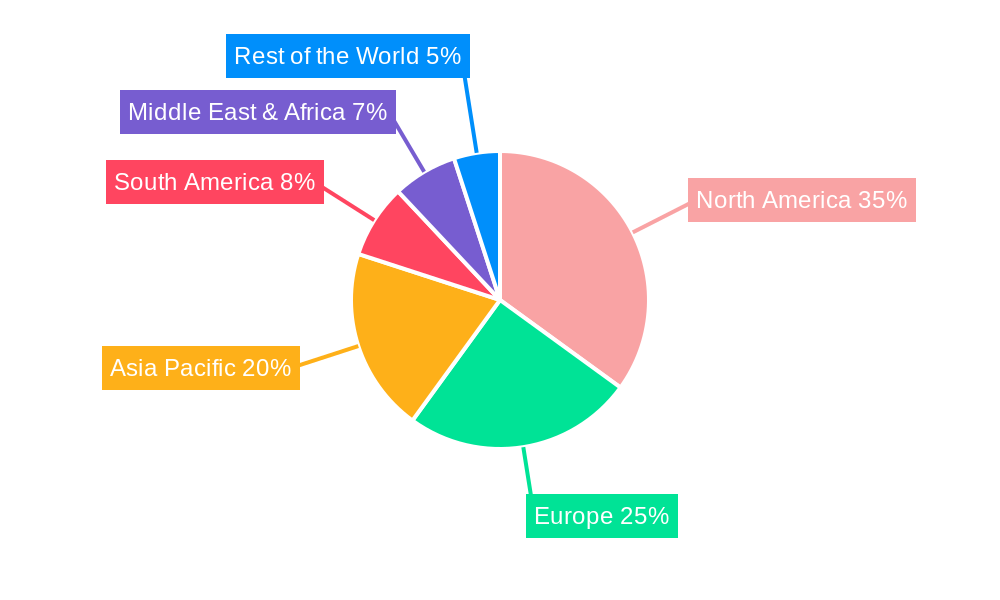
The competitive landscape features established players like Splunk and Datadog alongside emerging innovators such as Monte Carlo and Databand, each vying to offer comprehensive solutions encompassing data lineage, anomaly detection, data quality monitoring, and performance optimization. The market is broadly segmented by application into Small and Medium-sized Enterprises (SMEs) and Large Enterprises, with both segments exhibiting strong growth potential as data dependency deepens. Cloud-based solutions are dominating the adoption curve due to their scalability, flexibility, and cost-effectiveness, though on-premises deployments continue to cater to organizations with stringent data residency requirements. Geographically, North America currently leads the market, driven by early adoption and a mature tech ecosystem, but the Asia Pacific region is expected to witness the fastest growth, propelled by rapid digital transformation and increasing data investments. Restraints include the initial implementation costs and the need for skilled personnel to effectively leverage these advanced tools.
Data Observability Tool Company Market Share
Data Observability Tool Market Composition & Trends: Unveiling a Dynamic Ecosystem
The Data Observability Tool market is a rapidly evolving landscape characterized by intense competition and a robust innovation pipeline. Market concentration is influenced by established players like Datadog, Dynatrace, New Relic, Splunk, and Sumo Logic, who command significant market share through comprehensive solutions. Emerging innovators such as SigNoz.io, Monte Carlo, Databand, Acceldata, and Datafold are disrupting the status quo with specialized offerings, particularly for critical areas like data quality and pipeline monitoring. The market is witnessing a significant influx of venture capital, with M&A activities valued in the hundreds of millions to billions, indicating strong investor confidence. For instance, recent acquisitions in the data observability and observability platforms space have seen valuations in the range of $500 million to $2.5 billion.
Key trends shaping the market include:
- Growing Demand for Proactive Issue Resolution: Organizations are shifting from reactive firefighting to proactive identification and resolution of data issues.
- AI and ML Integration: Advanced AI and ML capabilities are being integrated to automate anomaly detection, root cause analysis, and predictive maintenance.
- Cloud-Native Adoption: The proliferation of cloud-based data infrastructure fuels the demand for cloud-native observability solutions.
- Data Governance and Compliance: Increasing regulatory scrutiny is driving the need for robust data observability tools to ensure compliance.
- Focus on Data Reliability: Businesses are prioritizing data reliability to drive better decision-making and operational efficiency.
The competitive landscape features a mix of broad observability platforms and specialized data observability tools, catering to diverse needs across various industry verticals. This dynamic interplay fosters continuous innovation and presents a lucrative market for both established and emerging vendors.
Data Observability Tool Industry Evolution: Charting a Course of Exponential Growth
The Data Observability Tool industry is on an unprecedented growth trajectory, fueled by the increasing criticality of data in modern business operations and the burgeoning complexity of data architectures. From 2019 to 2024, the historical period has witnessed a foundational shift, moving from basic monitoring to a more sophisticated understanding of data's health and lineage. This era saw the rise of companies like Datadog, Splunk, and New Relic establishing their dominance in broader observability, paving the way for specialized data observability solutions. The market has seen compound annual growth rates (CAGR) of approximately 25-30% during this period, reflecting the nascent but rapidly expanding demand. Adoption metrics are particularly impressive, with over 60% of large enterprises having implemented some form of data observability by 2024, a significant leap from less than 30% in 2019.
The base year of 2025 marks a pivotal point, with the market solidifying its position as a business imperative rather than a niche requirement. Technological advancements have been a primary catalyst. The integration of machine learning and artificial intelligence for automated anomaly detection, root cause analysis, and predictive insights has moved from a futuristic concept to a practical reality. Tools like Monte Carlo, Databand, and Acceldata are leading this charge, offering sophisticated capabilities that go beyond simple metric tracking. Consumer demand has also evolved; businesses are no longer content with just knowing that data is "broken" but demand to understand why, when, and how it was broken, along with automated remediation pathways. This has spurred the development of tools with advanced data lineage mapping, data quality checks, and data freshness monitoring.
The forecast period from 2025 to 2033 is poised for continued exponential growth, with an anticipated CAGR of 28-33%. This sustained expansion will be driven by several factors. Firstly, the continued migration of data to cloud environments and the rise of complex multi-cloud and hybrid cloud architectures will amplify the need for centralized and comprehensive data observability. Secondly, the increasing adoption of real-time data processing and streaming analytics will necessitate real-time observability to ensure data integrity and immediate issue resolution. Furthermore, as data becomes the central asset for AI and machine learning initiatives, the accuracy and reliability of this data will become paramount, further elevating the importance of data observability tools. Companies like Logtail, Sentry, and SigNoz.io are expected to play significant roles in this future, offering specialized solutions that address specific pain points within the data lifecycle. The evolution is a clear testament to data observability’s transition from a supporting role to a core pillar of data management and governance.
Leading Regions, Countries, or Segments in Data Observability Tool
The Data Observability Tool market is experiencing a significant surge in adoption across both Large Enterprises and SMEs, with distinct drivers influencing their respective growth trajectories. However, the Cloud-based segment stands out as the dominant force, outpacing its on-premises counterpart due to the inherent advantages of scalability, flexibility, and reduced infrastructure management.
Dominance of the Cloud-based Segment:
The shift towards cloud-native architectures has been a relentless tide, propelling cloud-based Data Observability Tools to the forefront. This dominance is driven by:
- Scalability and Flexibility: Cloud platforms offer unparalleled scalability, allowing organizations to seamlessly adjust their data observability resources as their data volumes and complexity grow. This is crucial for handling the ever-increasing data demands of both SMEs and Large Enterprises.
- Reduced Infrastructure Overhead: Organizations can avoid the significant capital expenditure and ongoing maintenance costs associated with on-premises hardware and software, making cloud solutions more accessible and cost-effective.
- Faster Deployment and Time-to-Value: Cloud-based tools can be deployed much faster than on-premises solutions, enabling organizations to realize the benefits of data observability more rapidly.
- Integration with Cloud Ecosystems: Most modern data stacks are built on cloud infrastructure. Cloud-based observability tools seamlessly integrate with these ecosystems, providing a unified view of data pipelines and applications. Companies like Datadog, Dynatrace, and New Relic have built their offerings around this cloud-first approach.
- Innovation and Agility: Cloud providers and tool vendors are able to innovate and release new features more frequently in a cloud environment, keeping pace with the rapid evolution of data technologies.
Application Segments: Large Enterprises and SMEs:
While both segments are crucial, Large Enterprises currently represent the largest market share due to their more complex data environments and higher stakes associated with data failures.
- Large Enterprises: These organizations grapple with massive data volumes, intricate data pipelines, and stringent compliance requirements. The financial and reputational risks of data downtime or inaccuracy are immense. Consequently, they are willing to invest heavily in comprehensive data observability solutions to ensure data reliability, support advanced analytics, and maintain regulatory compliance. Their investment trends are characterized by multi-million dollar deals and a focus on integrated platforms that can handle diverse data sources and workloads. Regulatory support, such as GDPR and CCPA, further incentivizes their adoption of robust data governance and observability.
- SMEs: While their data volumes may be smaller, SMEs are increasingly recognizing the importance of data-driven decision-making. The accessibility and cost-effectiveness of cloud-based solutions, coupled with the growing availability of specialized tools like Logtail and Sentry for specific needs, are driving adoption. SMEs are often looking for simpler, more focused solutions that address their immediate data quality and reliability concerns without overwhelming their IT resources. Their adoption is influenced by a growing awareness of data's value and the competitive pressure to leverage data effectively.
Regional Dominance:
While not explicitly a category to detail dominance in, it's worth noting that North America and Europe currently lead in the adoption of data observability tools, driven by mature technology markets, significant investment in data analytics, and strong regulatory frameworks. However, the Asia-Pacific region is rapidly emerging as a key growth market.
The interplay between cloud-native architectures and the strategic importance of data for both large enterprises and SMEs creates a powerful synergy, solidifying the dominance of cloud-based data observability solutions in the current market landscape.
Data Observability Tool Product Innovations: Enhancing Reliability and Performance
The Data Observability Tool market is experiencing a wave of transformative product innovations focused on enhancing data reliability, performance, and actionable insights. Vendors are increasingly embedding advanced capabilities such as AI-driven anomaly detection, automated root cause analysis, and intelligent data lineage tracing. Technologies like Prometheus and Jaeger are foundational for time-series monitoring and distributed tracing, while newer platforms like Monte Carlo, Databand, and Datafold are pushing the envelope with sophisticated data quality checks, data freshness monitoring, and proactive pipeline anomaly detection. Unique selling propositions now revolve around end-to-end data pipeline visibility, real-time error alerting with contextual information, and seamless integration with existing data stacks. These advancements empower organizations to not only identify data issues but also to understand their impact and resolve them swiftly, thereby minimizing data downtime and ensuring data integrity for critical business operations.
Propelling Factors for Data Observability Tool Growth
The exponential growth of the Data Observability Tool market is propelled by a confluence of powerful factors. Technologically, the increasing complexity of data architectures, the proliferation of cloud-native environments, and the surge in real-time data processing necessitate sophisticated tools for monitoring and managing data health. Economically, businesses are recognizing data as a critical asset, and the cost of data downtime or inaccuracy is becoming a significant concern, driving investment in solutions that ensure data reliability. Regulatory influences, such as GDPR and CCPA, are also playing a crucial role, compelling organizations to implement robust data governance and observability practices to ensure compliance and avoid hefty penalties. The rise of AI and machine learning further amplifies this need, as these technologies are critically dependent on high-quality, reliable data.
Obstacles in the Data Observability Tool Market
Despite the robust growth, the Data Observability Tool market faces several obstacles. The sheer complexity of integrating these tools into existing, often heterogeneous, data ecosystems can be a significant challenge, requiring substantial technical expertise and time. The cost of comprehensive data observability solutions can also be a barrier, particularly for smaller organizations with limited budgets, leading to a focus on more specific, less integrated tools. Furthermore, the rapidly evolving nature of data technologies means that observability tools must constantly adapt to new data sources, formats, and processing paradigms, demanding continuous development and investment from vendors. While not a direct obstacle to market entry, the cybersecurity landscape also presents a challenge, as data observability tools themselves become potential targets, necessitating strong security measures.
Future Opportunities in Data Observability Tool
The future of the Data Observability Tool market is brimming with opportunities. The increasing adoption of data mesh architectures will create a demand for decentralized observability solutions that can manage data products across different domains. The growing importance of real-time analytics and streaming data will fuel the need for low-latency, high-throughput observability platforms. Furthermore, the integration of data observability with broader AI operations (AIOps) and MLOps platforms presents a significant opportunity to create more intelligent and automated data pipelines. The expansion into emerging markets and industries that are just beginning to leverage data will also unlock substantial growth potential. The continued focus on democratizing data access and usability will also drive demand for tools that simplify data understanding and troubleshooting for a wider audience.
Major Players in the Data Observability Tool Ecosystem
- Logtail
- Datadog
- Dynatrace
- New Relic
- Sentry
- SigNoz.io
- Sumo Logic
- Splunk
- Jaeger
- Prometheus
- Monte Carlo
- Databand
- Acceldata
- Observe.ai
- Datafold
- Soda
Key Developments in Data Observability Tool Industry
- May 2024: Databricks launches new data observability features for its Lakehouse Platform, enhancing data quality and reliability for its users.
- April 2024: Monte Carlo secures $XX million in Series C funding to accelerate the development of its data observability platform, expanding its market reach.
- March 2024: SigNoz.io introduces enhanced support for distributed tracing and metrics, further solidifying its position as an open-source observability solution.
- February 2024: Databand announces strategic partnerships with major cloud providers to offer seamless integration of its data observability solutions.
- January 2024: Splunk announces advancements in its observability cloud, focusing on unified visibility across applications and infrastructure.
- December 2023: New Relic enhances its AI-powered anomaly detection capabilities, providing more proactive insights for data teams.
- November 2023: Acceldata expands its platform to include deeper insights into data pipeline performance and cost optimization.
- October 2023: Dynatrace introduces new features for automated root cause analysis of data quality issues within complex cloud environments.
- September 2023: Sentry releases major updates to its error tracking and performance monitoring, improving developer experience for data-intensive applications.
- August 2023: Datafold announces significant improvements in data diffing capabilities, enabling faster identification of data discrepancies.
- July 2023: Sumo Logic expands its cloud observability offerings with enhanced security and compliance features for data.
- June 2023: Logtail enhances its log management platform with improved search capabilities and real-time analytics for data troubleshooting.
- May 2023: Soda launches new features focused on data contract management and automated data quality testing.
- April 2023: Observe.ai integrates advanced AI for anomaly detection in data pipelines, offering predictive insights.
- March 2023: Prometheus and Jaeger continue to be instrumental open-source components, with ongoing community-driven enhancements.
Strategic Data Observability Tool Market Forecast
The strategic forecast for the Data Observability Tool market is overwhelmingly positive, projected to experience robust growth from 2025 to 2033. This expansion will be driven by the persistent need for data reliability in an increasingly complex digital landscape, coupled with the continuous innovation in AI and cloud-native technologies. Key growth catalysts include the growing adoption of data governance frameworks, the demand for end-to-end data pipeline visibility, and the critical role of accurate data in powering AI and machine learning initiatives. Emerging markets and the expansion of cloud adoption globally will further contribute to this upward trajectory, solidifying data observability as an indispensable component of modern data management strategies. The market is poised for significant investment and innovation, offering substantial opportunities for vendors and stakeholders alike.
Data Observability Tool Segmentation
-
1. Application
- 1.1. SMEs
- 1.2. Large Enterprises
-
2. Types
- 2.1. Cloud-based
- 2.2. On-premises
Data Observability Tool Segmentation By Geography
-
1. North America
- 1.1. United States
- 1.2. Canada
- 1.3. Mexico
-
2. South America
- 2.1. Brazil
- 2.2. Argentina
- 2.3. Rest of South America
-
3. Europe
- 3.1. United Kingdom
- 3.2. Germany
- 3.3. France
- 3.4. Italy
- 3.5. Spain
- 3.6. Russia
- 3.7. Benelux
- 3.8. Nordics
- 3.9. Rest of Europe
-
4. Middle East & Africa
- 4.1. Turkey
- 4.2. Israel
- 4.3. GCC
- 4.4. North Africa
- 4.5. South Africa
- 4.6. Rest of Middle East & Africa
-
5. Asia Pacific
- 5.1. China
- 5.2. India
- 5.3. Japan
- 5.4. South Korea
- 5.5. ASEAN
- 5.6. Oceania
- 5.7. Rest of Asia Pacific
Data Observability Tool Regional Market Share
Geographic Coverage of Data Observability Tool
Data Observability Tool REPORT HIGHLIGHTS
| Aspects | Details |
|---|---|
| Study Period | 2020-2034 |
| Base Year | 2025 |
| Estimated Year | 2026 |
| Forecast Period | 2026-2034 |
| Historical Period | 2020-2025 |
| Growth Rate | CAGR of XX% from 2020-2034 |
| Segmentation |
|
Table of Contents
- 1. Introduction
- 1.1. Research Scope
- 1.2. Market Segmentation
- 1.3. Research Objective
- 1.4. Definitions and Assumptions
- 2. Executive Summary
- 2.1. Market Snapshot
- 3. Market Dynamics
- 3.1. Market Drivers
- 3.2. Market Restrains
- 3.3. Market Trends
- 3.4. Market Opportunities
- 4. Market Factor Analysis
- 4.1. Porters Five Forces
- 4.1.1. Bargaining Power of Suppliers
- 4.1.2. Bargaining Power of Buyers
- 4.1.3. Threat of New Entrants
- 4.1.4. Threat of Substitutes
- 4.1.5. Competitive Rivalry
- 4.2. PESTEL analysis
- 4.3. BCG Analysis
- 4.3.1. Stars (High Growth, High Market Share)
- 4.3.2. Cash Cows (Low Growth, High Market Share)
- 4.3.3. Question Mark (High Growth, Low Market Share)
- 4.3.4. Dogs (Low Growth, Low Market Share)
- 4.4. Ansoff Matrix Analysis
- 4.5. Supply Chain Analysis
- 4.6. Regulatory Landscape
- 4.7. Current Market Potential and Opportunity Assessment (TAM–SAM–SOM Framework)
- 4.8. DMV Analyst Note
- 4.1. Porters Five Forces
- 5. Market Analysis, Insights and Forecast 2021-2033
- 5.1. Market Analysis, Insights and Forecast - by Application
- 5.1.1. SMEs
- 5.1.2. Large Enterprises
- 5.2. Market Analysis, Insights and Forecast - by Types
- 5.2.1. Cloud-based
- 5.2.2. On-premises
- 5.3. Market Analysis, Insights and Forecast - by Region
- 5.3.1. North America
- 5.3.2. South America
- 5.3.3. Europe
- 5.3.4. Middle East & Africa
- 5.3.5. Asia Pacific
- 5.1. Market Analysis, Insights and Forecast - by Application
- 6. Global Data Observability Tool Analysis, Insights and Forecast, 2021-2033
- 6.1. Market Analysis, Insights and Forecast - by Application
- 6.1.1. SMEs
- 6.1.2. Large Enterprises
- 6.2. Market Analysis, Insights and Forecast - by Types
- 6.2.1. Cloud-based
- 6.2.2. On-premises
- 6.1. Market Analysis, Insights and Forecast - by Application
- 7. North America Data Observability Tool Analysis, Insights and Forecast, 2020-2032
- 7.1. Market Analysis, Insights and Forecast - by Application
- 7.1.1. SMEs
- 7.1.2. Large Enterprises
- 7.2. Market Analysis, Insights and Forecast - by Types
- 7.2.1. Cloud-based
- 7.2.2. On-premises
- 7.1. Market Analysis, Insights and Forecast - by Application
- 8. South America Data Observability Tool Analysis, Insights and Forecast, 2020-2032
- 8.1. Market Analysis, Insights and Forecast - by Application
- 8.1.1. SMEs
- 8.1.2. Large Enterprises
- 8.2. Market Analysis, Insights and Forecast - by Types
- 8.2.1. Cloud-based
- 8.2.2. On-premises
- 8.1. Market Analysis, Insights and Forecast - by Application
- 9. Europe Data Observability Tool Analysis, Insights and Forecast, 2020-2032
- 9.1. Market Analysis, Insights and Forecast - by Application
- 9.1.1. SMEs
- 9.1.2. Large Enterprises
- 9.2. Market Analysis, Insights and Forecast - by Types
- 9.2.1. Cloud-based
- 9.2.2. On-premises
- 9.1. Market Analysis, Insights and Forecast - by Application
- 10. Middle East & Africa Data Observability Tool Analysis, Insights and Forecast, 2020-2032
- 10.1. Market Analysis, Insights and Forecast - by Application
- 10.1.1. SMEs
- 10.1.2. Large Enterprises
- 10.2. Market Analysis, Insights and Forecast - by Types
- 10.2.1. Cloud-based
- 10.2.2. On-premises
- 10.1. Market Analysis, Insights and Forecast - by Application
- 11. Asia Pacific Data Observability Tool Analysis, Insights and Forecast, 2020-2032
- 11.1. Market Analysis, Insights and Forecast - by Application
- 11.1.1. SMEs
- 11.1.2. Large Enterprises
- 11.2. Market Analysis, Insights and Forecast - by Types
- 11.2.1. Cloud-based
- 11.2.2. On-premises
- 11.1. Market Analysis, Insights and Forecast - by Application
- 12. Competitive Analysis
- 12.1. Company Profiles
- 12.1.1 Logtail
- 12.1.1.1. Company Overview
- 12.1.1.2. Products
- 12.1.1.3. Company Financials
- 12.1.1.4. SWOT Analysis
- 12.1.2 Datadog
- 12.1.2.1. Company Overview
- 12.1.2.2. Products
- 12.1.2.3. Company Financials
- 12.1.2.4. SWOT Analysis
- 12.1.3 Dynatrace
- 12.1.3.1. Company Overview
- 12.1.3.2. Products
- 12.1.3.3. Company Financials
- 12.1.3.4. SWOT Analysis
- 12.1.4 New Relic
- 12.1.4.1. Company Overview
- 12.1.4.2. Products
- 12.1.4.3. Company Financials
- 12.1.4.4. SWOT Analysis
- 12.1.5 Sentry
- 12.1.5.1. Company Overview
- 12.1.5.2. Products
- 12.1.5.3. Company Financials
- 12.1.5.4. SWOT Analysis
- 12.1.6 Signoz.io
- 12.1.6.1. Company Overview
- 12.1.6.2. Products
- 12.1.6.3. Company Financials
- 12.1.6.4. SWOT Analysis
- 12.1.7 Sumo Logic
- 12.1.7.1. Company Overview
- 12.1.7.2. Products
- 12.1.7.3. Company Financials
- 12.1.7.4. SWOT Analysis
- 12.1.8 Splunk
- 12.1.8.1. Company Overview
- 12.1.8.2. Products
- 12.1.8.3. Company Financials
- 12.1.8.4. SWOT Analysis
- 12.1.9 Jaeger
- 12.1.9.1. Company Overview
- 12.1.9.2. Products
- 12.1.9.3. Company Financials
- 12.1.9.4. SWOT Analysis
- 12.1.10 Prometheus
- 12.1.10.1. Company Overview
- 12.1.10.2. Products
- 12.1.10.3. Company Financials
- 12.1.10.4. SWOT Analysis
- 12.1.11 Monte Carlo
- 12.1.11.1. Company Overview
- 12.1.11.2. Products
- 12.1.11.3. Company Financials
- 12.1.11.4. SWOT Analysis
- 12.1.12 Databand
- 12.1.12.1. Company Overview
- 12.1.12.2. Products
- 12.1.12.3. Company Financials
- 12.1.12.4. SWOT Analysis
- 12.1.13 Acceldata
- 12.1.13.1. Company Overview
- 12.1.13.2. Products
- 12.1.13.3. Company Financials
- 12.1.13.4. SWOT Analysis
- 12.1.14 Observe.ai
- 12.1.14.1. Company Overview
- 12.1.14.2. Products
- 12.1.14.3. Company Financials
- 12.1.14.4. SWOT Analysis
- 12.1.15 Datafold
- 12.1.15.1. Company Overview
- 12.1.15.2. Products
- 12.1.15.3. Company Financials
- 12.1.15.4. SWOT Analysis
- 12.1.16 Soda
- 12.1.16.1. Company Overview
- 12.1.16.2. Products
- 12.1.16.3. Company Financials
- 12.1.16.4. SWOT Analysis
- 12.1.1 Logtail
- 12.2. Market Entropy
- 12.2.1 Company's Key Areas Served
- 12.2.2 Recent Developments
- 12.3. Company Market Share Analysis 2025
- 12.3.1 Top 5 Companies Market Share Analysis
- 12.3.2 Top 3 Companies Market Share Analysis
- 12.4. List of Potential Customers
- 13. Research Methodology
List of Figures
- Figure 1: Global Data Observability Tool Revenue Breakdown (million, %) by Region 2025 & 2033
- Figure 2: North America Data Observability Tool Revenue (million), by Application 2025 & 2033
- Figure 3: North America Data Observability Tool Revenue Share (%), by Application 2025 & 2033
- Figure 4: North America Data Observability Tool Revenue (million), by Types 2025 & 2033
- Figure 5: North America Data Observability Tool Revenue Share (%), by Types 2025 & 2033
- Figure 6: North America Data Observability Tool Revenue (million), by Country 2025 & 2033
- Figure 7: North America Data Observability Tool Revenue Share (%), by Country 2025 & 2033
- Figure 8: South America Data Observability Tool Revenue (million), by Application 2025 & 2033
- Figure 9: South America Data Observability Tool Revenue Share (%), by Application 2025 & 2033
- Figure 10: South America Data Observability Tool Revenue (million), by Types 2025 & 2033
- Figure 11: South America Data Observability Tool Revenue Share (%), by Types 2025 & 2033
- Figure 12: South America Data Observability Tool Revenue (million), by Country 2025 & 2033
- Figure 13: South America Data Observability Tool Revenue Share (%), by Country 2025 & 2033
- Figure 14: Europe Data Observability Tool Revenue (million), by Application 2025 & 2033
- Figure 15: Europe Data Observability Tool Revenue Share (%), by Application 2025 & 2033
- Figure 16: Europe Data Observability Tool Revenue (million), by Types 2025 & 2033
- Figure 17: Europe Data Observability Tool Revenue Share (%), by Types 2025 & 2033
- Figure 18: Europe Data Observability Tool Revenue (million), by Country 2025 & 2033
- Figure 19: Europe Data Observability Tool Revenue Share (%), by Country 2025 & 2033
- Figure 20: Middle East & Africa Data Observability Tool Revenue (million), by Application 2025 & 2033
- Figure 21: Middle East & Africa Data Observability Tool Revenue Share (%), by Application 2025 & 2033
- Figure 22: Middle East & Africa Data Observability Tool Revenue (million), by Types 2025 & 2033
- Figure 23: Middle East & Africa Data Observability Tool Revenue Share (%), by Types 2025 & 2033
- Figure 24: Middle East & Africa Data Observability Tool Revenue (million), by Country 2025 & 2033
- Figure 25: Middle East & Africa Data Observability Tool Revenue Share (%), by Country 2025 & 2033
- Figure 26: Asia Pacific Data Observability Tool Revenue (million), by Application 2025 & 2033
- Figure 27: Asia Pacific Data Observability Tool Revenue Share (%), by Application 2025 & 2033
- Figure 28: Asia Pacific Data Observability Tool Revenue (million), by Types 2025 & 2033
- Figure 29: Asia Pacific Data Observability Tool Revenue Share (%), by Types 2025 & 2033
- Figure 30: Asia Pacific Data Observability Tool Revenue (million), by Country 2025 & 2033
- Figure 31: Asia Pacific Data Observability Tool Revenue Share (%), by Country 2025 & 2033
List of Tables
- Table 1: Global Data Observability Tool Revenue million Forecast, by Application 2020 & 2033
- Table 2: Global Data Observability Tool Revenue million Forecast, by Types 2020 & 2033
- Table 3: Global Data Observability Tool Revenue million Forecast, by Region 2020 & 2033
- Table 4: Global Data Observability Tool Revenue million Forecast, by Application 2020 & 2033
- Table 5: Global Data Observability Tool Revenue million Forecast, by Types 2020 & 2033
- Table 6: Global Data Observability Tool Revenue million Forecast, by Country 2020 & 2033
- Table 7: United States Data Observability Tool Revenue (million) Forecast, by Application 2020 & 2033
- Table 8: Canada Data Observability Tool Revenue (million) Forecast, by Application 2020 & 2033
- Table 9: Mexico Data Observability Tool Revenue (million) Forecast, by Application 2020 & 2033
- Table 10: Global Data Observability Tool Revenue million Forecast, by Application 2020 & 2033
- Table 11: Global Data Observability Tool Revenue million Forecast, by Types 2020 & 2033
- Table 12: Global Data Observability Tool Revenue million Forecast, by Country 2020 & 2033
- Table 13: Brazil Data Observability Tool Revenue (million) Forecast, by Application 2020 & 2033
- Table 14: Argentina Data Observability Tool Revenue (million) Forecast, by Application 2020 & 2033
- Table 15: Rest of South America Data Observability Tool Revenue (million) Forecast, by Application 2020 & 2033
- Table 16: Global Data Observability Tool Revenue million Forecast, by Application 2020 & 2033
- Table 17: Global Data Observability Tool Revenue million Forecast, by Types 2020 & 2033
- Table 18: Global Data Observability Tool Revenue million Forecast, by Country 2020 & 2033
- Table 19: United Kingdom Data Observability Tool Revenue (million) Forecast, by Application 2020 & 2033
- Table 20: Germany Data Observability Tool Revenue (million) Forecast, by Application 2020 & 2033
- Table 21: France Data Observability Tool Revenue (million) Forecast, by Application 2020 & 2033
- Table 22: Italy Data Observability Tool Revenue (million) Forecast, by Application 2020 & 2033
- Table 23: Spain Data Observability Tool Revenue (million) Forecast, by Application 2020 & 2033
- Table 24: Russia Data Observability Tool Revenue (million) Forecast, by Application 2020 & 2033
- Table 25: Benelux Data Observability Tool Revenue (million) Forecast, by Application 2020 & 2033
- Table 26: Nordics Data Observability Tool Revenue (million) Forecast, by Application 2020 & 2033
- Table 27: Rest of Europe Data Observability Tool Revenue (million) Forecast, by Application 2020 & 2033
- Table 28: Global Data Observability Tool Revenue million Forecast, by Application 2020 & 2033
- Table 29: Global Data Observability Tool Revenue million Forecast, by Types 2020 & 2033
- Table 30: Global Data Observability Tool Revenue million Forecast, by Country 2020 & 2033
- Table 31: Turkey Data Observability Tool Revenue (million) Forecast, by Application 2020 & 2033
- Table 32: Israel Data Observability Tool Revenue (million) Forecast, by Application 2020 & 2033
- Table 33: GCC Data Observability Tool Revenue (million) Forecast, by Application 2020 & 2033
- Table 34: North Africa Data Observability Tool Revenue (million) Forecast, by Application 2020 & 2033
- Table 35: South Africa Data Observability Tool Revenue (million) Forecast, by Application 2020 & 2033
- Table 36: Rest of Middle East & Africa Data Observability Tool Revenue (million) Forecast, by Application 2020 & 2033
- Table 37: Global Data Observability Tool Revenue million Forecast, by Application 2020 & 2033
- Table 38: Global Data Observability Tool Revenue million Forecast, by Types 2020 & 2033
- Table 39: Global Data Observability Tool Revenue million Forecast, by Country 2020 & 2033
- Table 40: China Data Observability Tool Revenue (million) Forecast, by Application 2020 & 2033
- Table 41: India Data Observability Tool Revenue (million) Forecast, by Application 2020 & 2033
- Table 42: Japan Data Observability Tool Revenue (million) Forecast, by Application 2020 & 2033
- Table 43: South Korea Data Observability Tool Revenue (million) Forecast, by Application 2020 & 2033
- Table 44: ASEAN Data Observability Tool Revenue (million) Forecast, by Application 2020 & 2033
- Table 45: Oceania Data Observability Tool Revenue (million) Forecast, by Application 2020 & 2033
- Table 46: Rest of Asia Pacific Data Observability Tool Revenue (million) Forecast, by Application 2020 & 2033
Frequently Asked Questions
1. What is the projected Compound Annual Growth Rate (CAGR) of the Data Observability Tool?
The projected CAGR is approximately XX%.
2. Which companies are prominent players in the Data Observability Tool?
Key companies in the market include Logtail, Datadog, Dynatrace, New Relic, Sentry, Signoz.io, Sumo Logic, Splunk, Jaeger, Prometheus, Monte Carlo, Databand, Acceldata, Observe.ai, Datafold, Soda.
3. What are the main segments of the Data Observability Tool?
The market segments include Application, Types.
4. Can you provide details about the market size?
The market size is estimated to be USD XXX million as of 2022.
5. What are some drivers contributing to market growth?
N/A
6. What are the notable trends driving market growth?
N/A
7. Are there any restraints impacting market growth?
N/A
8. Can you provide examples of recent developments in the market?
N/A
9. What pricing options are available for accessing the report?
Pricing options include single-user, multi-user, and enterprise licenses priced at USD 3350.00, USD 5025.00, and USD 6700.00 respectively.
10. Is the market size provided in terms of value or volume?
The market size is provided in terms of value, measured in million.
11. Are there any specific market keywords associated with the report?
Yes, the market keyword associated with the report is "Data Observability Tool," which aids in identifying and referencing the specific market segment covered.
12. How do I determine which pricing option suits my needs best?
The pricing options vary based on user requirements and access needs. Individual users may opt for single-user licenses, while businesses requiring broader access may choose multi-user or enterprise licenses for cost-effective access to the report.
13. Are there any additional resources or data provided in the Data Observability Tool report?
While the report offers comprehensive insights, it's advisable to review the specific contents or supplementary materials provided to ascertain if additional resources or data are available.
14. How can I stay updated on further developments or reports in the Data Observability Tool?
To stay informed about further developments, trends, and reports in the Data Observability Tool, consider subscribing to industry newsletters, following relevant companies and organizations, or regularly checking reputable industry news sources and publications.
Methodology
Step 1 - Identification of Relevant Samples Size from Population Database


Step 2 - Approaches for Defining Global Market Size (Value, Volume* & Price*)

Note*: In applicable scenarios
Step 3 - Data Sources
Primary Research
- Web Analytics
- Survey Reports
- Research Institute
- Latest Research Reports
- Opinion Leaders
Secondary Research
- Annual Reports
- White Paper
- Latest Press Release
- Industry Association
- Paid Database
- Investor Presentations

Step 4 - Data Triangulation
Involves using different sources of information in order to increase the validity of a study
These sources are likely to be stakeholders in a program - participants, other researchers, program staff, other community members, and so on.
Then we put all data in single framework & apply various statistical tools to find out the dynamic on the market.
During the analysis stage, feedback from the stakeholder groups would be compared to determine areas of agreement as well as areas of divergence