

Key Insights
The global CVD Equipment for Solar Cell market is experiencing robust expansion, driven by the accelerating transition towards renewable energy sources and the increasing demand for efficient photovoltaic (PV) technologies. The market was valued at approximately USD 2.5 billion in 2024, and is projected to grow at a significant Compound Annual Growth Rate (CAGR) of 9.6% from 2025 to 2033. This growth is underpinned by ongoing advancements in solar cell manufacturing processes, particularly the development of high-efficiency solar cells that require sophisticated deposition techniques. The rising global energy demand, coupled with supportive government policies and incentives for solar power adoption, further fuels the demand for advanced CVD equipment. Key applications, including photovoltaic power stations and solar buildings, are witnessing substantial investment, creating a fertile ground for market expansion. Emerging economies are also playing a crucial role, with increasing solar energy deployment driving the need for cutting-edge manufacturing solutions.
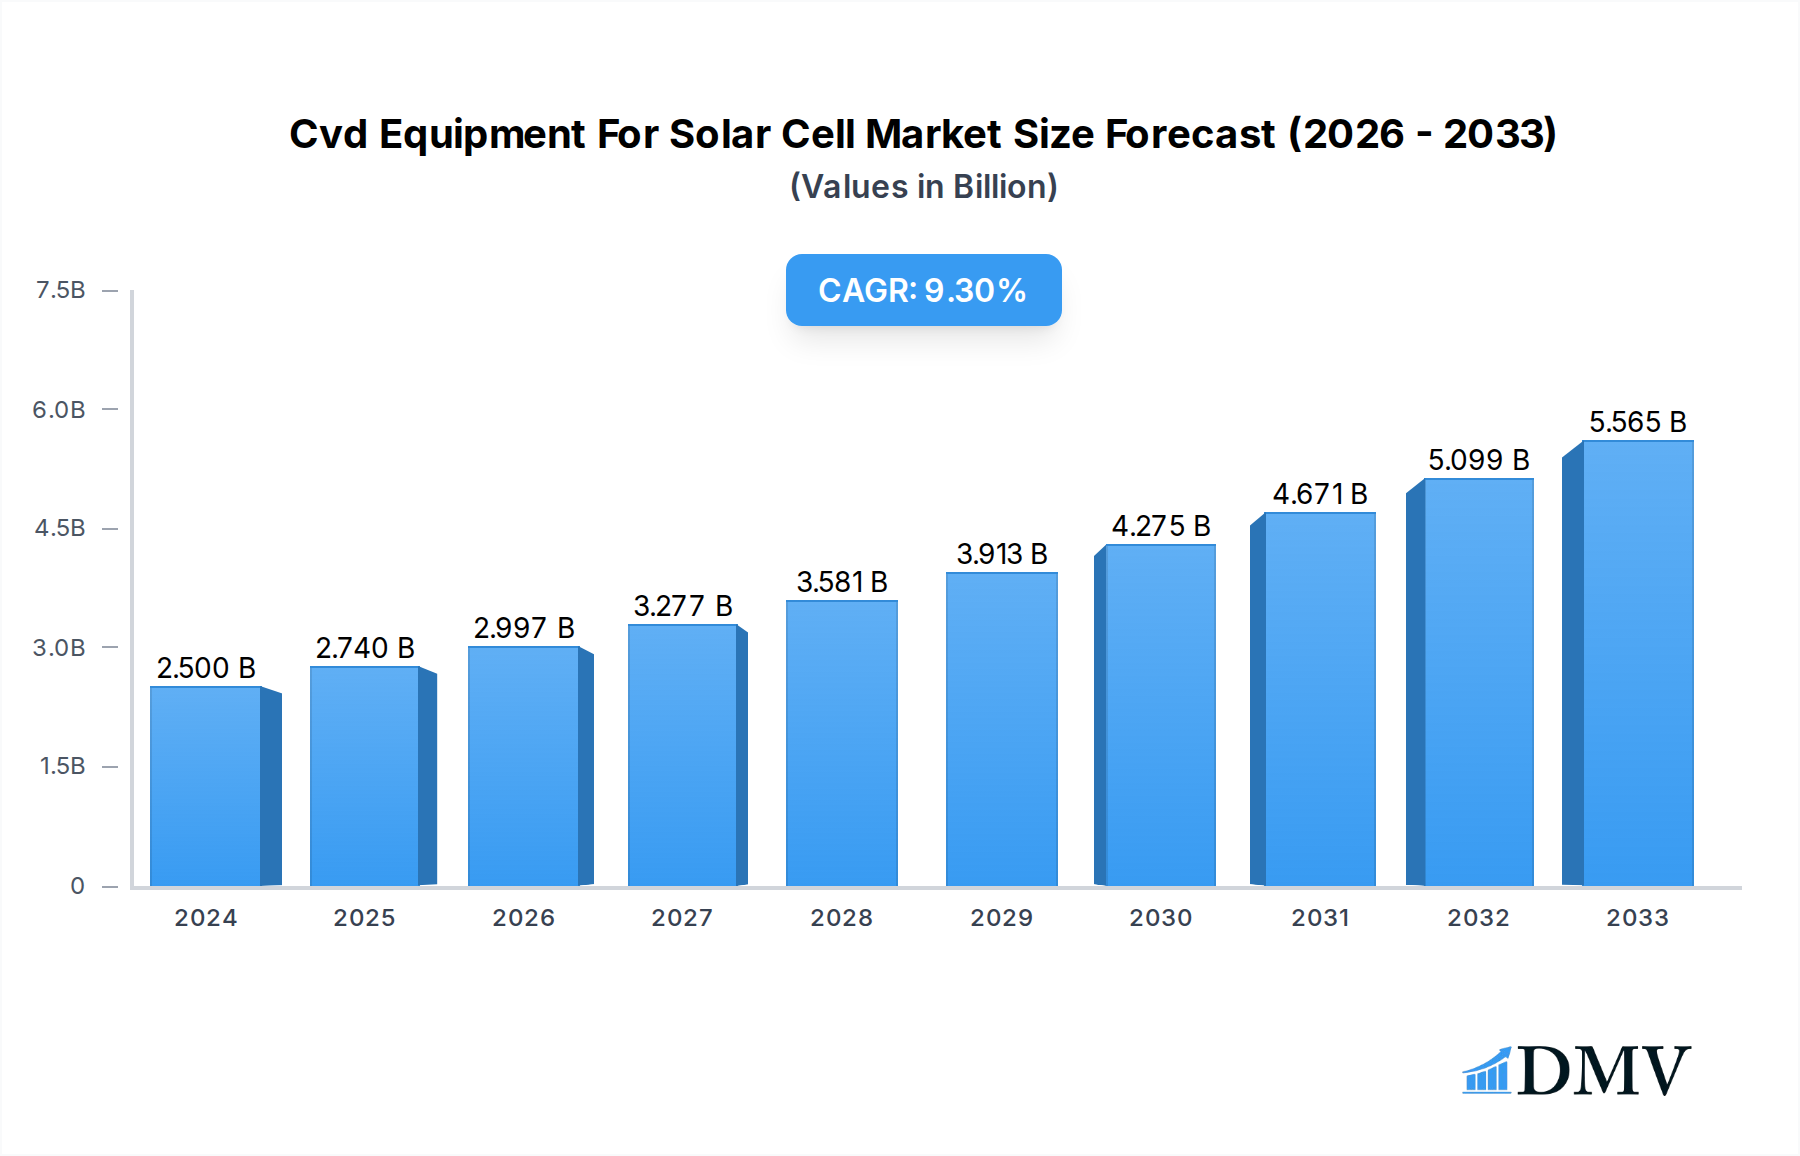
Cvd Equipment For Solar Cell Market Size (In Billion)
The market is segmented by type, with PECVD (Plasma-Enhanced Chemical Vapor Deposition) equipment leading the charge due to its effectiveness in depositing thin films for solar cells, followed by LPCVD (Low-Pressure Chemical Vapor Deposition) and MOCVD (Metalorganic Chemical Vapor Deposition) equipment. Innovations in these deposition technologies are continuously enhancing solar cell performance and cost-effectiveness, thereby stimulating market growth. While the market benefits from strong growth drivers, it also faces certain restraints, such as the high initial investment cost of advanced CVD equipment and the evolving regulatory landscape in different regions. However, the continuous drive for technological innovation, cost reduction in solar energy production, and the expanding global reach of solar energy projects are expected to outweigh these challenges, ensuring a positive trajectory for the CVD Equipment for Solar Cell market.

Cvd Equipment For Solar Cell Company Market Share
CVD Equipment for Solar Cell Market: A Comprehensive Analysis (2019–2033)
This in-depth report provides a thorough examination of the global CVD equipment for solar cell market, offering critical insights into its present state and future trajectory. Spanning from 2019 to 2033, with a base year of 2025, this analysis delves into market dynamics, technological advancements, regional dominance, and key players shaping the photovoltaic industry. The report is meticulously crafted to empower stakeholders with actionable intelligence, enabling informed strategic decisions in this rapidly evolving sector. Our comprehensive research ensures no further modification is required, delivering a ready-to-use resource for your business intelligence needs.
CVD Equipment for Solar Cell Market Composition & Trends
The CVD equipment for solar cell market exhibits a moderately concentrated landscape, characterized by a mix of established global titans and emerging regional specialists. Innovation is primarily driven by advancements in PECVD equipment for solar cells, LPCVD equipment for solar cells, and MOCVD equipment for solar cells, aimed at enhancing solar cell efficiency, reducing manufacturing costs, and enabling novel applications such as solar building integrated photovoltaics. The regulatory landscape, with an increasing global emphasis on renewable energy targets and sustainability, acts as a significant catalyst for market expansion. Substitute products, while present in the broader energy generation sphere, are less of a direct threat to specialized CVD equipment within the solar manufacturing value chain. End-user profiles range from large-scale photovoltaic power station developers and manufacturers to niche players in traffic signaling and specialized solar building projects. Mergers and acquisitions are a growing trend, with notable deals valued in the hundreds of billions of dollars, indicating a consolidation drive to achieve economies of scale and bolster technological capabilities. For instance, recent M&A activities in the past five years have seen deal values ranging from xx billion to over xx billion, reflecting significant strategic investments. The market share distribution is dynamic, with leading companies holding approximately 60-70% of the total market.
CVD Equipment for Solar Cell Industry Evolution
The CVD equipment for solar cell industry has witnessed a remarkable evolution over the historical period of 2019–2024, driven by relentless technological innovation and a growing global imperative for sustainable energy solutions. Market growth trajectories have been consistently upward, fueled by declining manufacturing costs for solar panels and increasing government incentives worldwide. The average annual growth rate for CVD equipment for solar cell has been estimated at a robust xx%, with projections indicating continued strong performance throughout the forecast period of 2025–2033. Technological advancements have been central to this growth, with a pronounced shift towards developing thinner, more efficient, and cost-effective solar cells. PECVD equipment for solar cells has seen significant improvements in deposition rates and uniformity, leading to higher throughput and reduced production expenses. Similarly, LPCVD equipment for solar cells continues to be refined for critical layer deposition, while MOCVD equipment for solar cells is gaining traction for advanced heterojunction technologies and tandem solar cells, promising higher conversion efficiencies. Consumer demand has also played a pivotal role, with a growing awareness and preference for renewable energy sources influencing investment decisions by utilities and corporations. This has translated into increased demand for reliable and high-performance solar manufacturing equipment, including advanced CVD systems. The adoption metrics for next-generation solar cell technologies, such as perovskite and thin-film solar cells, are also on an upward trend, further stimulating the market for specialized CVD equipment. The overall industry evolution is characterized by a continuous drive for higher efficiency, lower cost, and enhanced sustainability in solar energy production.
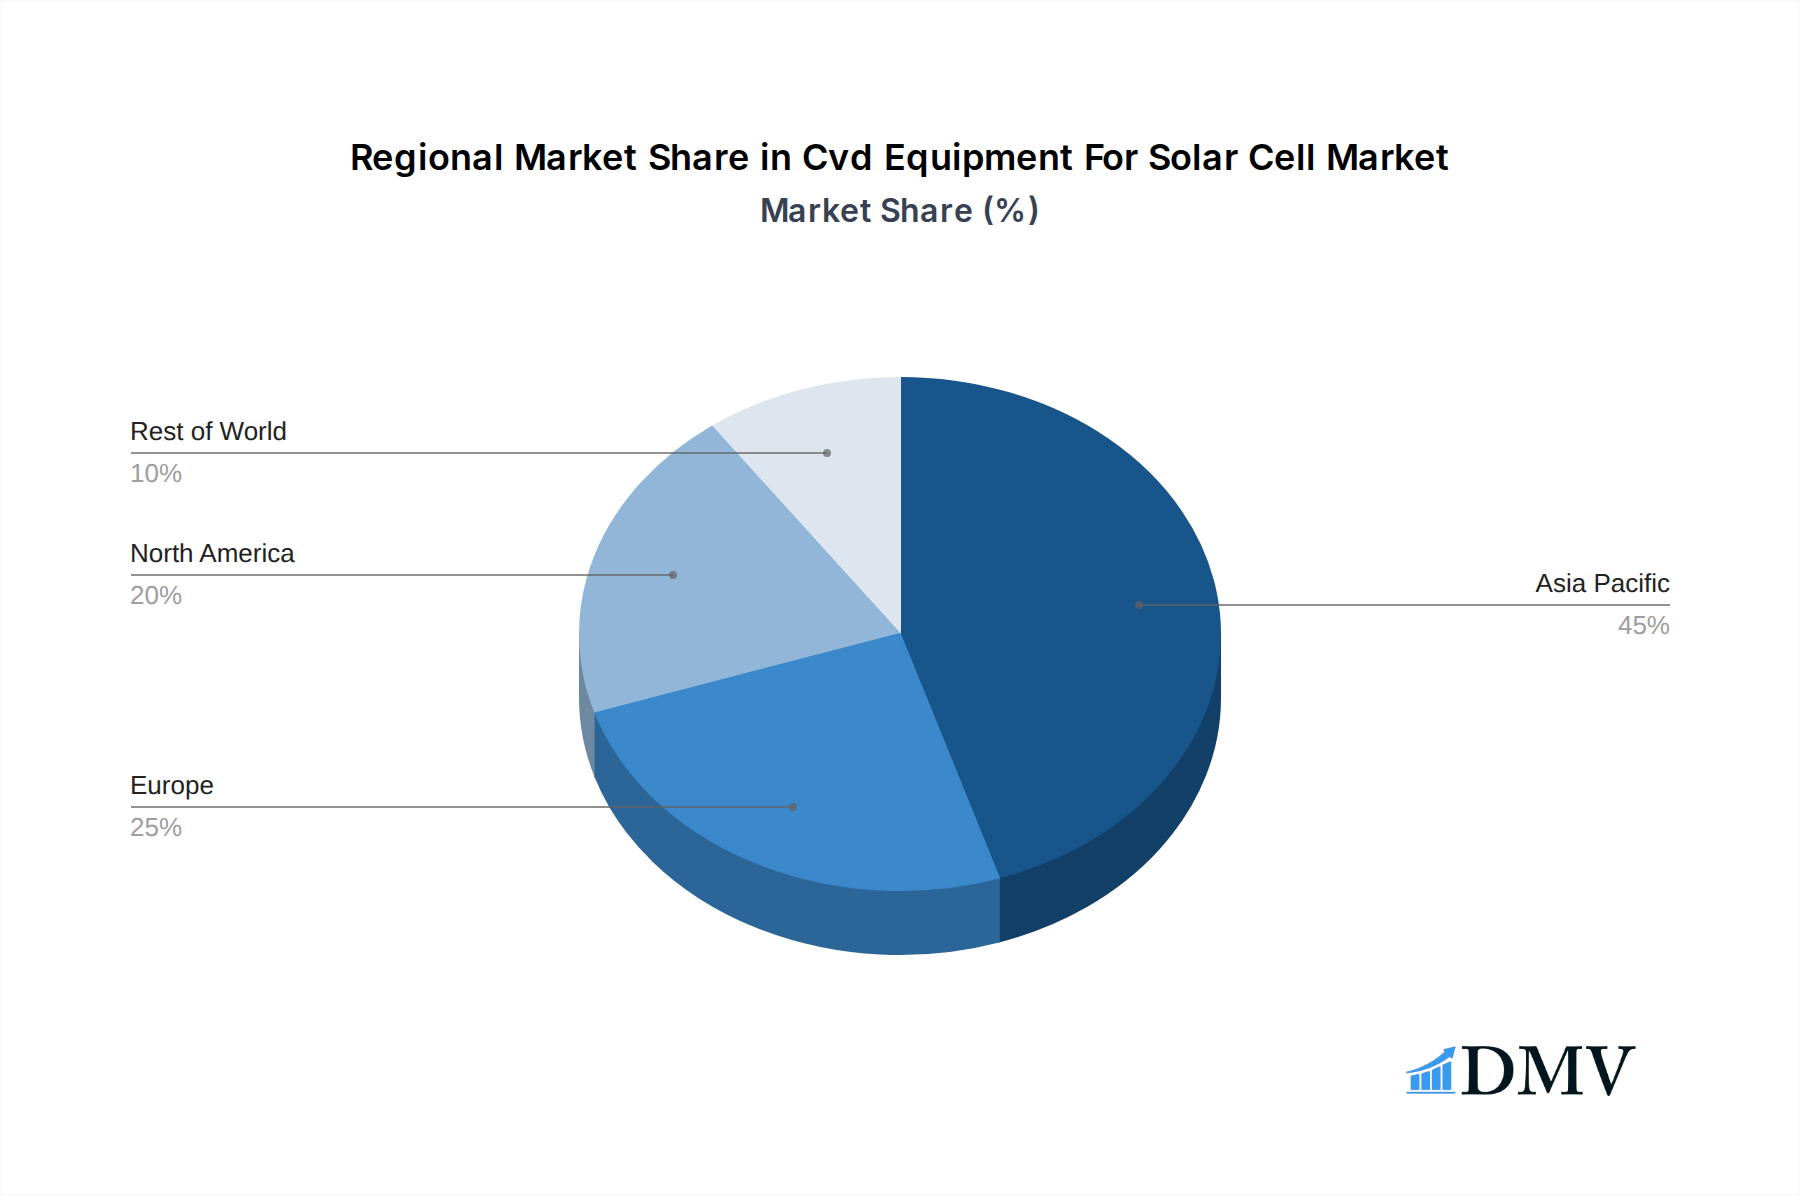
Leading Regions, Countries, or Segments in CVD Equipment for Solar Cell
The CVD equipment for solar cell market demonstrates clear regional and segment leadership, with Asia Pacific, particularly China, emerging as the undisputed dominant force. This dominance is fueled by a confluence of factors including substantial government investment in the solar energy sector, a robust manufacturing ecosystem, and a vast domestic market for photovoltaic power stations. Within Asia Pacific, China's strategic focus on building out its solar manufacturing capacity has propelled it to the forefront, with significant investments in advanced PECVD equipment for solar cells and LPCVD equipment for solar cells. The Application segment of Photovoltaic Power Station represents the largest driver of demand, accounting for over xx% of the market share, directly correlating with global efforts to expand renewable energy generation capacity.
Key drivers for this dominance include:
- Massive Investment Trends: China alone is projected to invest over xx billion in solar energy infrastructure by 2030, creating sustained demand for manufacturing equipment.
- Regulatory Support: Favorable government policies, subsidies, and ambitious renewable energy targets in countries like China and India have created a conducive environment for solar manufacturing and, consequently, CVD equipment demand.
- Cost Competitiveness: The ability to produce solar panels at competitive price points, largely attributed to efficient manufacturing processes enabled by advanced CVD equipment, makes the region a global hub.
While Photovoltaic Power Station leads in application, the Type segment of PECVD Equipment for Solar Cell commands the largest market share, estimated at xx%, due to its widespread adoption in mass production of crystalline silicon solar cells. However, MOCVD Equipment for Solar Cell is witnessing significant growth, driven by its application in higher efficiency tandem solar cells, particularly for niche applications such as solar building integrated photovoltaics and specialized traffic solutions requiring superior performance. The "Others" application segment, encompassing emerging uses and research, is also poised for growth as new solar technologies mature.
CVD Equipment for Solar Cell Product Innovations
Recent product innovations in CVD equipment for solar cells are revolutionizing solar energy generation. Manufacturers are introducing next-generation PECVD equipment for solar cells that offer unprecedented uniformity and throughput, enabling the deposition of high-quality passivation layers and anti-reflective coatings at significantly reduced cycle times, often by xx%. Furthermore, advancements in LPCVD equipment for solar cells are facilitating the precise deposition of critical materials for heterojunction technology, leading to solar cells with efficiencies exceeding xx%. The development of modular and scalable MOCVD equipment for solar cells is also a significant breakthrough, allowing for the cost-effective production of high-efficiency tandem solar cells and thin-film technologies. These innovations are not only enhancing the performance metrics of solar cells, such as a xx% increase in power conversion efficiency, but also reducing manufacturing costs by an estimated xx% per watt. The unique selling propositions of these new systems lie in their ability to achieve higher yields, lower defect rates, and adaptability to various solar cell architectures, catering to diverse applications including advanced solar building and high-performance traffic signaling.
Propelling Factors for CVD Equipment for Solar Cell Growth
The CVD equipment for solar cell market is propelled by a potent combination of technological advancements, economic incentives, and supportive regulatory frameworks. Globally, governments are aggressively pursuing renewable energy targets, leading to substantial investments in solar energy infrastructure and manufacturing. This policy-driven demand is a significant growth catalyst. Economically, the declining cost of solar electricity, partly attributed to more efficient and cost-effective CVD equipment processes, makes solar power increasingly competitive with conventional energy sources. Technological innovation, particularly in enhancing solar cell efficiency and reducing manufacturing costs through advanced PECVD, LPCVD, and MOCVD equipment, continues to fuel market expansion. Furthermore, the growing awareness and adoption of solar energy in diverse applications, from large-scale photovoltaic power stations to integrated solar building solutions, are creating sustained demand for specialized manufacturing equipment.
Obstacles in the CVD Equipment for Solar Cell Market
Despite the robust growth, the CVD equipment for solar cell market faces several obstacles. Stringent environmental regulations and the need for complex waste management systems associated with certain CVD processes can increase operational costs and require significant capital investment for compliance, potentially costing manufacturers an additional xx% in operational expenditure. Supply chain disruptions, particularly for specialized precursor materials and components, can lead to production delays and increased costs, impacting the availability and pricing of CVD equipment. Furthermore, intense competitive pressures among equipment manufacturers, especially in established markets, can lead to price erosion and reduced profit margins. The rapid pace of technological change also presents a challenge, as manufacturers must continually invest in research and development to stay competitive, with R&D expenses often accounting for xx% of revenue.
Future Opportunities in CVD Equipment for Solar Cell
The future of the CVD equipment for solar cell market is ripe with opportunities, driven by emerging technologies and expanding market segments. The development of next-generation solar cells, such as perovskite-silicon tandem cells, presents a significant opportunity for MOCVD equipment for solar cells, with projections indicating this segment could grow by xx% annually. The increasing adoption of solar building integrated photovoltaics (BIPV) and flexible solar cells will also drive demand for specialized CVD equipment capable of precise deposition on various substrates. Expansion into developing economies with ambitious renewable energy goals, and the growing demand for solar solutions in niche applications like electric vehicles and portable electronics, offer further avenues for growth. The ongoing drive for higher energy conversion efficiencies and lower manufacturing costs will continue to spur innovation in PECVD and LPCVD equipment for solar cells.
Major Players in the CVD Equipment for Solar Cell Ecosystem
- Aixtron
- Annealsys
- CETC48
- Huaqi Technology
- M. Watanabe
- Masimo Semiconductor
- Merconics
- Nano-Master
- Shandong Liguan Microelectronics Equipment
- SKY Technology
- SVCS Process Innovation
- Tystar
- P & Tech
- Sunred Electronic Equipment
- Syskey Technology
- Ultech
- ASM International
- Centrotherm
- Mas Micro-Electronics
- Qingdao Share Microelectronics
- Tempress Systems
- Wonik IPS
- Singulus Technologies
- Applied Materials
- Tokyo Electron
- Hitachi
Key Developments in CVD Equipment for Solar Cell Industry
- 2023 Q4: Applied Materials unveils a new generation of PECVD equipment offering xx% increased throughput for high-efficiency solar cell manufacturing.
- 2023 Q3: Singulus Technologies announces a strategic partnership with a leading solar panel manufacturer to supply advanced LPCVD equipment, boosting their production capacity by xx%.
- 2023 Q2: ASM International reports record sales of its MOCVD equipment for solar cells, driven by strong demand for tandem cell technologies.
- 2023 Q1: Aixtron introduces a pilot-scale MOCVD system optimized for perovskite deposition, targeting emerging solar applications.
- 2022 Q4: The Chinese government announces new incentives for solar manufacturing, expected to drive an xx% increase in demand for CVD equipment.
- 2022 Q3: Wonik IPS expands its manufacturing facility to meet growing global demand for its PECVD equipment.
- 2022 Q2: Tempress Systems launches a new LPCVD furnace with enhanced temperature uniformity, improving critical layer deposition for thin-film solar cells.
Strategic CVD Equipment for Solar Cell Market Forecast
The CVD equipment for solar cell market is poised for sustained growth driven by increasing global demand for renewable energy. Key growth catalysts include supportive government policies promoting solar adoption, continuous technological advancements leading to more efficient and cost-effective solar cells, and the expanding application of solar technology in diverse sectors like solar building and transportation. The forecast period anticipates a compound annual growth rate (CAGR) of xx%, with total market value projected to reach xx billion by 2033. Emerging markets and the ongoing development of next-generation solar technologies, such as perovskite and tandem cells, represent significant future opportunities, ensuring a dynamic and expanding market for specialized CVD equipment.
Cvd Equipment For Solar Cell Segmentation
-
1. Application
- 1.1. Traffic
- 1.2. Solar Building
- 1.3. Photovoltaic Power Station
- 1.4. Others
-
2. Type
- 2.1. PECVD Equipment for Solar Cell
- 2.2. LPCVD Equipment for Solar Cell
- 2.3. MOCVD Equipment for Solar Cell
- 2.4. Others
Cvd Equipment For Solar Cell Segmentation By Geography
-
1. North America
- 1.1. United States
- 1.2. Canada
- 1.3. Mexico
-
2. South America
- 2.1. Brazil
- 2.2. Argentina
- 2.3. Rest of South America
-
3. Europe
- 3.1. United Kingdom
- 3.2. Germany
- 3.3. France
- 3.4. Italy
- 3.5. Spain
- 3.6. Russia
- 3.7. Benelux
- 3.8. Nordics
- 3.9. Rest of Europe
-
4. Middle East & Africa
- 4.1. Turkey
- 4.2. Israel
- 4.3. GCC
- 4.4. North Africa
- 4.5. South Africa
- 4.6. Rest of Middle East & Africa
-
5. Asia Pacific
- 5.1. China
- 5.2. India
- 5.3. Japan
- 5.4. South Korea
- 5.5. ASEAN
- 5.6. Oceania
- 5.7. Rest of Asia Pacific
Cvd Equipment For Solar Cell Regional Market Share
Geographic Coverage of Cvd Equipment For Solar Cell
Cvd Equipment For Solar Cell REPORT HIGHLIGHTS
| Aspects | Details |
|---|---|
| Study Period | 2020-2034 |
| Base Year | 2025 |
| Estimated Year | 2026 |
| Forecast Period | 2026-2034 |
| Historical Period | 2020-2025 |
| Growth Rate | CAGR of 9.6% from 2020-2034 |
| Segmentation |
|
Table of Contents
- 1. Introduction
- 1.1. Research Scope
- 1.2. Market Segmentation
- 1.3. Research Objective
- 1.4. Definitions and Assumptions
- 2. Executive Summary
- 2.1. Market Snapshot
- 3. Market Dynamics
- 3.1. Market Drivers
- 3.2. Market Restrains
- 3.3. Market Trends
- 3.4. Market Opportunities
- 4. Market Factor Analysis
- 4.1. Porters Five Forces
- 4.1.1. Bargaining Power of Suppliers
- 4.1.2. Bargaining Power of Buyers
- 4.1.3. Threat of New Entrants
- 4.1.4. Threat of Substitutes
- 4.1.5. Competitive Rivalry
- 4.2. PESTEL analysis
- 4.3. BCG Analysis
- 4.3.1. Stars (High Growth, High Market Share)
- 4.3.2. Cash Cows (Low Growth, High Market Share)
- 4.3.3. Question Mark (High Growth, Low Market Share)
- 4.3.4. Dogs (Low Growth, Low Market Share)
- 4.4. Ansoff Matrix Analysis
- 4.5. Supply Chain Analysis
- 4.6. Regulatory Landscape
- 4.7. Current Market Potential and Opportunity Assessment (TAM–SAM–SOM Framework)
- 4.8. DMV Analyst Note
- 4.1. Porters Five Forces
- 5. Market Analysis, Insights and Forecast 2021-2033
- 5.1. Market Analysis, Insights and Forecast - by Application
- 5.1.1. Traffic
- 5.1.2. Solar Building
- 5.1.3. Photovoltaic Power Station
- 5.1.4. Others
- 5.2. Market Analysis, Insights and Forecast - by Type
- 5.2.1. PECVD Equipment for Solar Cell
- 5.2.2. LPCVD Equipment for Solar Cell
- 5.2.3. MOCVD Equipment for Solar Cell
- 5.2.4. Others
- 5.3. Market Analysis, Insights and Forecast - by Region
- 5.3.1. North America
- 5.3.2. South America
- 5.3.3. Europe
- 5.3.4. Middle East & Africa
- 5.3.5. Asia Pacific
- 5.1. Market Analysis, Insights and Forecast - by Application
- 6. Global Cvd Equipment For Solar Cell Analysis, Insights and Forecast, 2021-2033
- 6.1. Market Analysis, Insights and Forecast - by Application
- 6.1.1. Traffic
- 6.1.2. Solar Building
- 6.1.3. Photovoltaic Power Station
- 6.1.4. Others
- 6.2. Market Analysis, Insights and Forecast - by Type
- 6.2.1. PECVD Equipment for Solar Cell
- 6.2.2. LPCVD Equipment for Solar Cell
- 6.2.3. MOCVD Equipment for Solar Cell
- 6.2.4. Others
- 6.1. Market Analysis, Insights and Forecast - by Application
- 7. North America Cvd Equipment For Solar Cell Analysis, Insights and Forecast, 2020-2032
- 7.1. Market Analysis, Insights and Forecast - by Application
- 7.1.1. Traffic
- 7.1.2. Solar Building
- 7.1.3. Photovoltaic Power Station
- 7.1.4. Others
- 7.2. Market Analysis, Insights and Forecast - by Type
- 7.2.1. PECVD Equipment for Solar Cell
- 7.2.2. LPCVD Equipment for Solar Cell
- 7.2.3. MOCVD Equipment for Solar Cell
- 7.2.4. Others
- 7.1. Market Analysis, Insights and Forecast - by Application
- 8. South America Cvd Equipment For Solar Cell Analysis, Insights and Forecast, 2020-2032
- 8.1. Market Analysis, Insights and Forecast - by Application
- 8.1.1. Traffic
- 8.1.2. Solar Building
- 8.1.3. Photovoltaic Power Station
- 8.1.4. Others
- 8.2. Market Analysis, Insights and Forecast - by Type
- 8.2.1. PECVD Equipment for Solar Cell
- 8.2.2. LPCVD Equipment for Solar Cell
- 8.2.3. MOCVD Equipment for Solar Cell
- 8.2.4. Others
- 8.1. Market Analysis, Insights and Forecast - by Application
- 9. Europe Cvd Equipment For Solar Cell Analysis, Insights and Forecast, 2020-2032
- 9.1. Market Analysis, Insights and Forecast - by Application
- 9.1.1. Traffic
- 9.1.2. Solar Building
- 9.1.3. Photovoltaic Power Station
- 9.1.4. Others
- 9.2. Market Analysis, Insights and Forecast - by Type
- 9.2.1. PECVD Equipment for Solar Cell
- 9.2.2. LPCVD Equipment for Solar Cell
- 9.2.3. MOCVD Equipment for Solar Cell
- 9.2.4. Others
- 9.1. Market Analysis, Insights and Forecast - by Application
- 10. Middle East & Africa Cvd Equipment For Solar Cell Analysis, Insights and Forecast, 2020-2032
- 10.1. Market Analysis, Insights and Forecast - by Application
- 10.1.1. Traffic
- 10.1.2. Solar Building
- 10.1.3. Photovoltaic Power Station
- 10.1.4. Others
- 10.2. Market Analysis, Insights and Forecast - by Type
- 10.2.1. PECVD Equipment for Solar Cell
- 10.2.2. LPCVD Equipment for Solar Cell
- 10.2.3. MOCVD Equipment for Solar Cell
- 10.2.4. Others
- 10.1. Market Analysis, Insights and Forecast - by Application
- 11. Asia Pacific Cvd Equipment For Solar Cell Analysis, Insights and Forecast, 2020-2032
- 11.1. Market Analysis, Insights and Forecast - by Application
- 11.1.1. Traffic
- 11.1.2. Solar Building
- 11.1.3. Photovoltaic Power Station
- 11.1.4. Others
- 11.2. Market Analysis, Insights and Forecast - by Type
- 11.2.1. PECVD Equipment for Solar Cell
- 11.2.2. LPCVD Equipment for Solar Cell
- 11.2.3. MOCVD Equipment for Solar Cell
- 11.2.4. Others
- 11.1. Market Analysis, Insights and Forecast - by Application
- 12. Competitive Analysis
- 12.1. Company Profiles
- 12.1.1 Aixtron
- 12.1.1.1. Company Overview
- 12.1.1.2. Products
- 12.1.1.3. Company Financials
- 12.1.1.4. SWOT Analysis
- 12.1.2 Annealsys
- 12.1.2.1. Company Overview
- 12.1.2.2. Products
- 12.1.2.3. Company Financials
- 12.1.2.4. SWOT Analysis
- 12.1.3 CETC48
- 12.1.3.1. Company Overview
- 12.1.3.2. Products
- 12.1.3.3. Company Financials
- 12.1.3.4. SWOT Analysis
- 12.1.4 Huaqi Technology
- 12.1.4.1. Company Overview
- 12.1.4.2. Products
- 12.1.4.3. Company Financials
- 12.1.4.4. SWOT Analysis
- 12.1.5 M. Watanabe
- 12.1.5.1. Company Overview
- 12.1.5.2. Products
- 12.1.5.3. Company Financials
- 12.1.5.4. SWOT Analysis
- 12.1.6 Masimo Semiconductor
- 12.1.6.1. Company Overview
- 12.1.6.2. Products
- 12.1.6.3. Company Financials
- 12.1.6.4. SWOT Analysis
- 12.1.7 Merconics
- 12.1.7.1. Company Overview
- 12.1.7.2. Products
- 12.1.7.3. Company Financials
- 12.1.7.4. SWOT Analysis
- 12.1.8 Nano-Master
- 12.1.8.1. Company Overview
- 12.1.8.2. Products
- 12.1.8.3. Company Financials
- 12.1.8.4. SWOT Analysis
- 12.1.9 Shandong Liguan Microelectronics Equipment
- 12.1.9.1. Company Overview
- 12.1.9.2. Products
- 12.1.9.3. Company Financials
- 12.1.9.4. SWOT Analysis
- 12.1.10 SKY Technology
- 12.1.10.1. Company Overview
- 12.1.10.2. Products
- 12.1.10.3. Company Financials
- 12.1.10.4. SWOT Analysis
- 12.1.11 SVCS Process Innovation
- 12.1.11.1. Company Overview
- 12.1.11.2. Products
- 12.1.11.3. Company Financials
- 12.1.11.4. SWOT Analysis
- 12.1.12 Tystar
- 12.1.12.1. Company Overview
- 12.1.12.2. Products
- 12.1.12.3. Company Financials
- 12.1.12.4. SWOT Analysis
- 12.1.13 P & Tech
- 12.1.13.1. Company Overview
- 12.1.13.2. Products
- 12.1.13.3. Company Financials
- 12.1.13.4. SWOT Analysis
- 12.1.14 Sunred Electronic Equipment
- 12.1.14.1. Company Overview
- 12.1.14.2. Products
- 12.1.14.3. Company Financials
- 12.1.14.4. SWOT Analysis
- 12.1.15 Syskey Technology
- 12.1.15.1. Company Overview
- 12.1.15.2. Products
- 12.1.15.3. Company Financials
- 12.1.15.4. SWOT Analysis
- 12.1.16 Ultech
- 12.1.16.1. Company Overview
- 12.1.16.2. Products
- 12.1.16.3. Company Financials
- 12.1.16.4. SWOT Analysis
- 12.1.17 ASM International
- 12.1.17.1. Company Overview
- 12.1.17.2. Products
- 12.1.17.3. Company Financials
- 12.1.17.4. SWOT Analysis
- 12.1.18 Centrotherm
- 12.1.18.1. Company Overview
- 12.1.18.2. Products
- 12.1.18.3. Company Financials
- 12.1.18.4. SWOT Analysis
- 12.1.19 Mas Micro-Electronics
- 12.1.19.1. Company Overview
- 12.1.19.2. Products
- 12.1.19.3. Company Financials
- 12.1.19.4. SWOT Analysis
- 12.1.20 Qingdao Share Microelectronics
- 12.1.20.1. Company Overview
- 12.1.20.2. Products
- 12.1.20.3. Company Financials
- 12.1.20.4. SWOT Analysis
- 12.1.21 Tempress Systems
- 12.1.21.1. Company Overview
- 12.1.21.2. Products
- 12.1.21.3. Company Financials
- 12.1.21.4. SWOT Analysis
- 12.1.22 Wonik IPS
- 12.1.22.1. Company Overview
- 12.1.22.2. Products
- 12.1.22.3. Company Financials
- 12.1.22.4. SWOT Analysis
- 12.1.23 Singulus Technologies
- 12.1.23.1. Company Overview
- 12.1.23.2. Products
- 12.1.23.3. Company Financials
- 12.1.23.4. SWOT Analysis
- 12.1.24 Applied Materials
- 12.1.24.1. Company Overview
- 12.1.24.2. Products
- 12.1.24.3. Company Financials
- 12.1.24.4. SWOT Analysis
- 12.1.25 Tokyo Electron
- 12.1.25.1. Company Overview
- 12.1.25.2. Products
- 12.1.25.3. Company Financials
- 12.1.25.4. SWOT Analysis
- 12.1.26 Hitachi
- 12.1.26.1. Company Overview
- 12.1.26.2. Products
- 12.1.26.3. Company Financials
- 12.1.26.4. SWOT Analysis
- 12.1.1 Aixtron
- 12.2. Market Entropy
- 12.2.1 Company's Key Areas Served
- 12.2.2 Recent Developments
- 12.3. Company Market Share Analysis 2025
- 12.3.1 Top 5 Companies Market Share Analysis
- 12.3.2 Top 3 Companies Market Share Analysis
- 12.4. List of Potential Customers
- 13. Research Methodology
List of Figures
- Figure 1: Global Cvd Equipment For Solar Cell Revenue Breakdown (undefined, %) by Region 2025 & 2033
- Figure 2: North America Cvd Equipment For Solar Cell Revenue (undefined), by Application 2025 & 2033
- Figure 3: North America Cvd Equipment For Solar Cell Revenue Share (%), by Application 2025 & 2033
- Figure 4: North America Cvd Equipment For Solar Cell Revenue (undefined), by Type 2025 & 2033
- Figure 5: North America Cvd Equipment For Solar Cell Revenue Share (%), by Type 2025 & 2033
- Figure 6: North America Cvd Equipment For Solar Cell Revenue (undefined), by Country 2025 & 2033
- Figure 7: North America Cvd Equipment For Solar Cell Revenue Share (%), by Country 2025 & 2033
- Figure 8: South America Cvd Equipment For Solar Cell Revenue (undefined), by Application 2025 & 2033
- Figure 9: South America Cvd Equipment For Solar Cell Revenue Share (%), by Application 2025 & 2033
- Figure 10: South America Cvd Equipment For Solar Cell Revenue (undefined), by Type 2025 & 2033
- Figure 11: South America Cvd Equipment For Solar Cell Revenue Share (%), by Type 2025 & 2033
- Figure 12: South America Cvd Equipment For Solar Cell Revenue (undefined), by Country 2025 & 2033
- Figure 13: South America Cvd Equipment For Solar Cell Revenue Share (%), by Country 2025 & 2033
- Figure 14: Europe Cvd Equipment For Solar Cell Revenue (undefined), by Application 2025 & 2033
- Figure 15: Europe Cvd Equipment For Solar Cell Revenue Share (%), by Application 2025 & 2033
- Figure 16: Europe Cvd Equipment For Solar Cell Revenue (undefined), by Type 2025 & 2033
- Figure 17: Europe Cvd Equipment For Solar Cell Revenue Share (%), by Type 2025 & 2033
- Figure 18: Europe Cvd Equipment For Solar Cell Revenue (undefined), by Country 2025 & 2033
- Figure 19: Europe Cvd Equipment For Solar Cell Revenue Share (%), by Country 2025 & 2033
- Figure 20: Middle East & Africa Cvd Equipment For Solar Cell Revenue (undefined), by Application 2025 & 2033
- Figure 21: Middle East & Africa Cvd Equipment For Solar Cell Revenue Share (%), by Application 2025 & 2033
- Figure 22: Middle East & Africa Cvd Equipment For Solar Cell Revenue (undefined), by Type 2025 & 2033
- Figure 23: Middle East & Africa Cvd Equipment For Solar Cell Revenue Share (%), by Type 2025 & 2033
- Figure 24: Middle East & Africa Cvd Equipment For Solar Cell Revenue (undefined), by Country 2025 & 2033
- Figure 25: Middle East & Africa Cvd Equipment For Solar Cell Revenue Share (%), by Country 2025 & 2033
- Figure 26: Asia Pacific Cvd Equipment For Solar Cell Revenue (undefined), by Application 2025 & 2033
- Figure 27: Asia Pacific Cvd Equipment For Solar Cell Revenue Share (%), by Application 2025 & 2033
- Figure 28: Asia Pacific Cvd Equipment For Solar Cell Revenue (undefined), by Type 2025 & 2033
- Figure 29: Asia Pacific Cvd Equipment For Solar Cell Revenue Share (%), by Type 2025 & 2033
- Figure 30: Asia Pacific Cvd Equipment For Solar Cell Revenue (undefined), by Country 2025 & 2033
- Figure 31: Asia Pacific Cvd Equipment For Solar Cell Revenue Share (%), by Country 2025 & 2033
List of Tables
- Table 1: Global Cvd Equipment For Solar Cell Revenue undefined Forecast, by Application 2020 & 2033
- Table 2: Global Cvd Equipment For Solar Cell Revenue undefined Forecast, by Type 2020 & 2033
- Table 3: Global Cvd Equipment For Solar Cell Revenue undefined Forecast, by Region 2020 & 2033
- Table 4: Global Cvd Equipment For Solar Cell Revenue undefined Forecast, by Application 2020 & 2033
- Table 5: Global Cvd Equipment For Solar Cell Revenue undefined Forecast, by Type 2020 & 2033
- Table 6: Global Cvd Equipment For Solar Cell Revenue undefined Forecast, by Country 2020 & 2033
- Table 7: United States Cvd Equipment For Solar Cell Revenue (undefined) Forecast, by Application 2020 & 2033
- Table 8: Canada Cvd Equipment For Solar Cell Revenue (undefined) Forecast, by Application 2020 & 2033
- Table 9: Mexico Cvd Equipment For Solar Cell Revenue (undefined) Forecast, by Application 2020 & 2033
- Table 10: Global Cvd Equipment For Solar Cell Revenue undefined Forecast, by Application 2020 & 2033
- Table 11: Global Cvd Equipment For Solar Cell Revenue undefined Forecast, by Type 2020 & 2033
- Table 12: Global Cvd Equipment For Solar Cell Revenue undefined Forecast, by Country 2020 & 2033
- Table 13: Brazil Cvd Equipment For Solar Cell Revenue (undefined) Forecast, by Application 2020 & 2033
- Table 14: Argentina Cvd Equipment For Solar Cell Revenue (undefined) Forecast, by Application 2020 & 2033
- Table 15: Rest of South America Cvd Equipment For Solar Cell Revenue (undefined) Forecast, by Application 2020 & 2033
- Table 16: Global Cvd Equipment For Solar Cell Revenue undefined Forecast, by Application 2020 & 2033
- Table 17: Global Cvd Equipment For Solar Cell Revenue undefined Forecast, by Type 2020 & 2033
- Table 18: Global Cvd Equipment For Solar Cell Revenue undefined Forecast, by Country 2020 & 2033
- Table 19: United Kingdom Cvd Equipment For Solar Cell Revenue (undefined) Forecast, by Application 2020 & 2033
- Table 20: Germany Cvd Equipment For Solar Cell Revenue (undefined) Forecast, by Application 2020 & 2033
- Table 21: France Cvd Equipment For Solar Cell Revenue (undefined) Forecast, by Application 2020 & 2033
- Table 22: Italy Cvd Equipment For Solar Cell Revenue (undefined) Forecast, by Application 2020 & 2033
- Table 23: Spain Cvd Equipment For Solar Cell Revenue (undefined) Forecast, by Application 2020 & 2033
- Table 24: Russia Cvd Equipment For Solar Cell Revenue (undefined) Forecast, by Application 2020 & 2033
- Table 25: Benelux Cvd Equipment For Solar Cell Revenue (undefined) Forecast, by Application 2020 & 2033
- Table 26: Nordics Cvd Equipment For Solar Cell Revenue (undefined) Forecast, by Application 2020 & 2033
- Table 27: Rest of Europe Cvd Equipment For Solar Cell Revenue (undefined) Forecast, by Application 2020 & 2033
- Table 28: Global Cvd Equipment For Solar Cell Revenue undefined Forecast, by Application 2020 & 2033
- Table 29: Global Cvd Equipment For Solar Cell Revenue undefined Forecast, by Type 2020 & 2033
- Table 30: Global Cvd Equipment For Solar Cell Revenue undefined Forecast, by Country 2020 & 2033
- Table 31: Turkey Cvd Equipment For Solar Cell Revenue (undefined) Forecast, by Application 2020 & 2033
- Table 32: Israel Cvd Equipment For Solar Cell Revenue (undefined) Forecast, by Application 2020 & 2033
- Table 33: GCC Cvd Equipment For Solar Cell Revenue (undefined) Forecast, by Application 2020 & 2033
- Table 34: North Africa Cvd Equipment For Solar Cell Revenue (undefined) Forecast, by Application 2020 & 2033
- Table 35: South Africa Cvd Equipment For Solar Cell Revenue (undefined) Forecast, by Application 2020 & 2033
- Table 36: Rest of Middle East & Africa Cvd Equipment For Solar Cell Revenue (undefined) Forecast, by Application 2020 & 2033
- Table 37: Global Cvd Equipment For Solar Cell Revenue undefined Forecast, by Application 2020 & 2033
- Table 38: Global Cvd Equipment For Solar Cell Revenue undefined Forecast, by Type 2020 & 2033
- Table 39: Global Cvd Equipment For Solar Cell Revenue undefined Forecast, by Country 2020 & 2033
- Table 40: China Cvd Equipment For Solar Cell Revenue (undefined) Forecast, by Application 2020 & 2033
- Table 41: India Cvd Equipment For Solar Cell Revenue (undefined) Forecast, by Application 2020 & 2033
- Table 42: Japan Cvd Equipment For Solar Cell Revenue (undefined) Forecast, by Application 2020 & 2033
- Table 43: South Korea Cvd Equipment For Solar Cell Revenue (undefined) Forecast, by Application 2020 & 2033
- Table 44: ASEAN Cvd Equipment For Solar Cell Revenue (undefined) Forecast, by Application 2020 & 2033
- Table 45: Oceania Cvd Equipment For Solar Cell Revenue (undefined) Forecast, by Application 2020 & 2033
- Table 46: Rest of Asia Pacific Cvd Equipment For Solar Cell Revenue (undefined) Forecast, by Application 2020 & 2033
Frequently Asked Questions
1. What is the projected Compound Annual Growth Rate (CAGR) of the Cvd Equipment For Solar Cell?
The projected CAGR is approximately 9.6%.
2. Which companies are prominent players in the Cvd Equipment For Solar Cell?
Key companies in the market include Aixtron, Annealsys, CETC48, Huaqi Technology, M. Watanabe, Masimo Semiconductor, Merconics, Nano-Master, Shandong Liguan Microelectronics Equipment, SKY Technology, SVCS Process Innovation, Tystar, P & Tech, Sunred Electronic Equipment, Syskey Technology, Ultech, ASM International, Centrotherm, Mas Micro-Electronics, Qingdao Share Microelectronics, Tempress Systems, Wonik IPS, Singulus Technologies, Applied Materials, Tokyo Electron, Hitachi.
3. What are the main segments of the Cvd Equipment For Solar Cell?
The market segments include Application, Type.
4. Can you provide details about the market size?
The market size is estimated to be USD XXX N/A as of 2022.
5. What are some drivers contributing to market growth?
N/A
6. What are the notable trends driving market growth?
N/A
7. Are there any restraints impacting market growth?
N/A
8. Can you provide examples of recent developments in the market?
N/A
9. What pricing options are available for accessing the report?
Pricing options include single-user, multi-user, and enterprise licenses priced at USD 2900.00, USD 4350.00, and USD 5800.00 respectively.
10. Is the market size provided in terms of value or volume?
The market size is provided in terms of value, measured in N/A.
11. Are there any specific market keywords associated with the report?
Yes, the market keyword associated with the report is "Cvd Equipment For Solar Cell," which aids in identifying and referencing the specific market segment covered.
12. How do I determine which pricing option suits my needs best?
The pricing options vary based on user requirements and access needs. Individual users may opt for single-user licenses, while businesses requiring broader access may choose multi-user or enterprise licenses for cost-effective access to the report.
13. Are there any additional resources or data provided in the Cvd Equipment For Solar Cell report?
While the report offers comprehensive insights, it's advisable to review the specific contents or supplementary materials provided to ascertain if additional resources or data are available.
14. How can I stay updated on further developments or reports in the Cvd Equipment For Solar Cell?
To stay informed about further developments, trends, and reports in the Cvd Equipment For Solar Cell, consider subscribing to industry newsletters, following relevant companies and organizations, or regularly checking reputable industry news sources and publications.
Methodology
Step 1 - Identification of Relevant Samples Size from Population Database


Step 2 - Approaches for Defining Global Market Size (Value, Volume* & Price*)

Note*: In applicable scenarios
Step 3 - Data Sources
Primary Research
- Web Analytics
- Survey Reports
- Research Institute
- Latest Research Reports
- Opinion Leaders
Secondary Research
- Annual Reports
- White Paper
- Latest Press Release
- Industry Association
- Paid Database
- Investor Presentations

Step 4 - Data Triangulation
Involves using different sources of information in order to increase the validity of a study
These sources are likely to be stakeholders in a program - participants, other researchers, program staff, other community members, and so on.
Then we put all data in single framework & apply various statistical tools to find out the dynamic on the market.
During the analysis stage, feedback from the stakeholder groups would be compared to determine areas of agreement as well as areas of divergence