

Key Insights
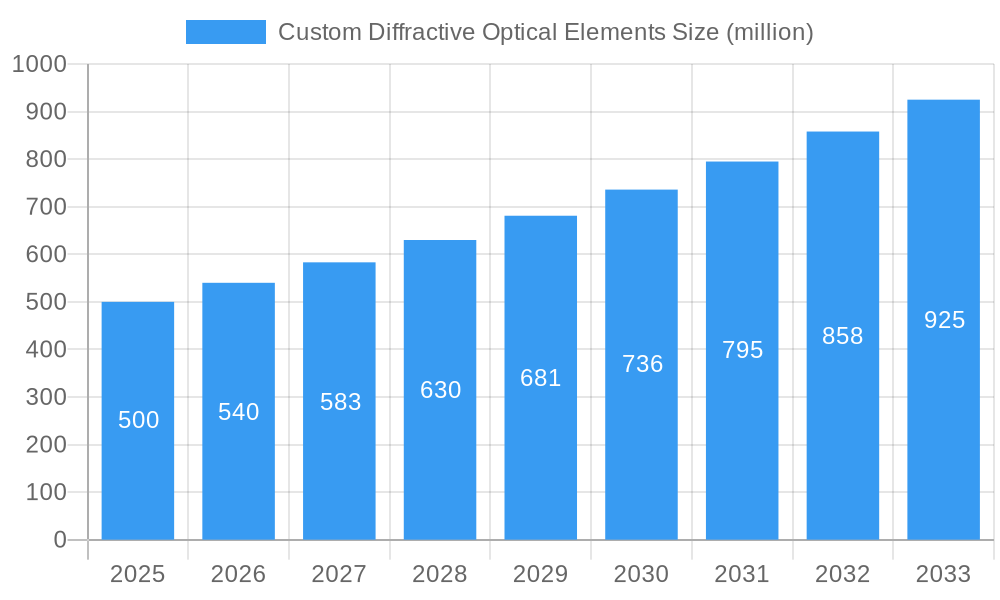
The global market for custom diffractive optical elements (DOEs) is experiencing robust growth, driven by increasing demand across diverse sectors like telecommunications, medical imaging, and augmented/virtual reality (AR/VR). The market, estimated at $500 million in 2025, is projected to exhibit a Compound Annual Growth Rate (CAGR) of 8% from 2025 to 2033, reaching approximately $950 million by 2033. This expansion is fueled by several key factors. Advancements in nanofabrication techniques are enabling the creation of highly complex and efficient DOEs with intricate designs. Furthermore, the rising adoption of DOEs in miniaturized optical systems, particularly in smartphones and wearable devices, contributes significantly to market growth. The automotive industry's increasing reliance on advanced driver-assistance systems (ADAS) and autonomous driving technologies further stimulates demand for high-precision DOEs for lidar and other sensing applications. Finally, ongoing research and development in areas such as holographic displays and free-space optical communication are expected to unlock new market opportunities in the coming years.
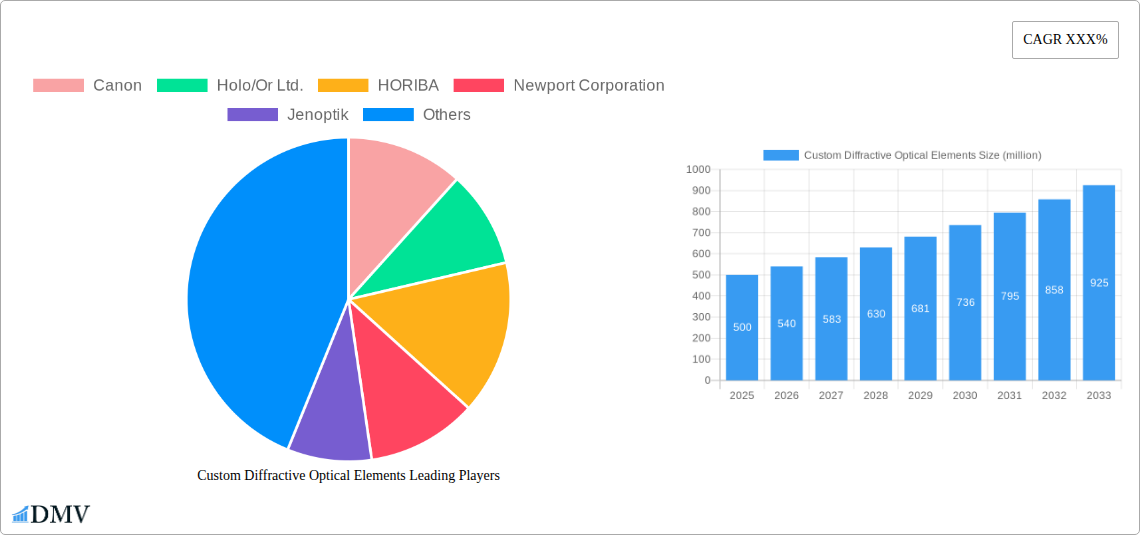
Custom Diffractive Optical Elements Market Size (In Million)
Competition in the custom DOE market is intense, with established players like Canon, Zeiss, and HORIBA alongside specialized companies like Wasatch Photonics and Lightsmyth (Finisar) vying for market share. However, the market presents opportunities for smaller, innovative companies focusing on niche applications or offering bespoke design and manufacturing services. Potential restraints include the high cost of specialized equipment and expertise required for DOE fabrication, as well as the challenges associated with ensuring precise control over DOE performance characteristics. Despite these challenges, the long-term outlook for the custom DOE market remains positive, underpinned by continuous technological advancements and the growing need for sophisticated optical solutions across a wide range of industries. Segmentation within the market includes applications (e.g., laser beam shaping, optical sensing, microscopy), materials (e.g., glass, polymers), and manufacturing techniques (e.g., lithography, etching).
Custom Diffractive Optical Elements Company Market Share
Custom Diffractive Optical Elements Market Report: A Comprehensive Analysis (2019-2033)
This insightful report provides a detailed analysis of the Custom Diffractive Optical Elements market, projecting a multi-million dollar valuation by 2033. It meticulously examines market dynamics, technological advancements, leading players, and future growth opportunities, offering invaluable insights for stakeholders across the industry. The study period covers 2019-2033, with 2025 serving as the base and estimated year, and the forecast period spanning 2025-2033. The historical period analyzed is 2019-2024. This report is final and requires no further modification.
Custom Diffractive Optical Elements Market Composition & Trends
This section delves into the intricate composition of the Custom Diffractive Optical Elements market, examining market concentration, innovative drivers, regulatory landscapes, substitute products, end-user profiles, and mergers & acquisitions (M&A) activities. The report reveals a dynamic market landscape characterized by both established players and emerging innovators.
Market Concentration: The market exhibits a moderately concentrated structure with a few major players holding significant market share. The top five companies—Canon, Newport Corporation, Zeiss, Jenoptik, and HORIBA—account for an estimated xx% of the total market revenue in 2025. Market share distribution is further analyzed in detail within the report.
Innovation Catalysts: Continuous advancements in nanofabrication techniques, design software, and material science drive innovation, pushing the boundaries of performance and application possibilities. The growing demand for higher resolution and efficiency in various applications fuels further R&D efforts.
Regulatory Landscape: Regional and international regulations pertaining to safety and environmental impact influence the manufacturing and application of Custom Diffractive Optical Elements. The report analyzes the specific regulatory frameworks affecting market growth.
Substitute Products: While Custom Diffractive Optical Elements offer unique advantages, they face competition from alternative technologies such as refractive and reflective optical components. The report analyzes the competitive landscape and the strengths and weaknesses of each technology.
End-User Profiles: Major end-users span diverse sectors including medical imaging, telecommunications, defense, and industrial automation, with the report providing a segment-wise breakdown of market demand.
M&A Activities: The market has witnessed significant M&A activity in recent years, with deal values exceeding xx million dollars in the last five years. The report analyzes these activities, identifying key drivers and implications for market consolidation.
Custom Diffractive Optical Elements Industry Evolution
This section provides a comprehensive overview of the evolution of the Custom Diffractive Optical Elements industry, outlining market growth trajectories, technological breakthroughs, and shifting consumer demands. The analysis reveals a market experiencing robust growth, driven by technological advancements and expanding applications. The compound annual growth rate (CAGR) for the period 2025-2033 is projected at xx%.
The increasing adoption of Custom Diffractive Optical Elements across various industries, coupled with ongoing research and development efforts focused on enhancing performance and expanding applications, is further driving market growth. This includes advancements in material science, fabrication techniques, and design software that are leading to more efficient and cost-effective solutions. The market is also witnessing a shift towards customized solutions tailored to specific application requirements, resulting in a growing demand for high-precision and specialized components.
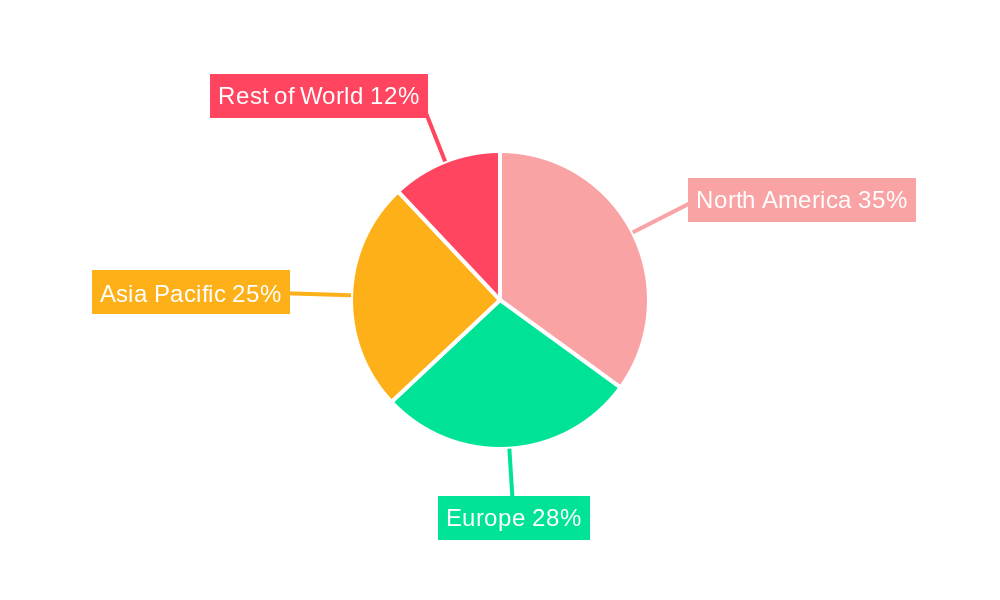
Leading Regions, Countries, or Segments in Custom Diffractive Optical Elements
This section identifies the dominant regions, countries, and segments within the Custom Diffractive Optical Elements market.
Dominant Region: North America holds the leading position in the market, driven by substantial investments in research and development, a strong presence of key players, and high demand from various end-use sectors.
Key Drivers in North America:
- Significant government funding for advanced technologies.
- A strong base of technology-driven companies.
- High demand from sectors such as medical imaging and telecommunications.
Other Regions: Europe and Asia-Pacific also exhibit significant growth potential, driven by expanding applications, rising R&D investments, and supportive government policies. The report provides a detailed regional breakdown, analyzing factors that contribute to regional market share.
Custom Diffractive Optical Elements Product Innovations
Recent advancements include the development of more efficient manufacturing techniques enabling high-volume production, resulting in cost reductions. This has broadened the accessibility of Custom Diffractive Optical Elements across diverse sectors. Further innovations focus on materials with improved durability, environmental stability, and performance parameters. The integration of advanced design software enables the creation of increasingly complex and customized optical elements.
Propelling Factors for Custom Diffractive Optical Elements Growth
The Custom Diffractive Optical Elements market is fueled by several key factors. Technological advancements, including improved fabrication techniques and design software, are creating more efficient and cost-effective solutions. The increasing demand for higher resolution and efficiency across various applications is another significant driver. Favorable government regulations and incentives in key regions further stimulate market expansion.
Obstacles in the Custom Diffractive Optical Elements Market
Despite the significant growth potential, the market faces challenges. Supply chain disruptions, particularly in the procurement of specialized materials, can lead to production delays and increased costs. Intense competition from established players and emerging companies necessitates continuous innovation and cost optimization. Strict regulatory compliance requirements also present hurdles for manufacturers.
Future Opportunities in Custom Diffractive Optical Elements
The market presents significant future opportunities. Emerging applications in augmented reality (AR) and virtual reality (VR) technologies are expected to drive strong demand for advanced Custom Diffractive Optical Elements. The development of novel materials with enhanced performance characteristics will further unlock new possibilities. Expanding into developing economies presents further significant growth prospects.
Major Players in the Custom Diffractive Optical Elements Ecosystem
- Canon
- Holo/Or Ltd.
- HORIBA
- Newport Corporation
- Jenoptik
- Shimadzu Corporation
- Zeiss
- SUSS MicroTec AG.
- Lightsmyth (Finisar)
- Edmund Optics
- Optometrics (Dynasil)
- Headwall Photonics
- Plymouth Grating Lab
- Wasatch Photonics
- Spectrogon AB
- GratingWorks
Key Developments in Custom Diffractive Optical Elements Industry
- 2022-Q4: Canon launched a new line of high-precision diffractive optical elements, expanding its product portfolio.
- 2023-Q1: Newport Corporation acquired a smaller competitor, consolidating its market position. (Specifics on the deal are available in the full report.)
- 2024-Q3: Significant investments in R&D were announced by several major players across the industry.
Strategic Custom Diffractive Optical Elements Market Forecast
The Custom Diffractive Optical Elements market is poised for robust growth in the coming years, driven by continuous innovation, expanding applications, and substantial investments in research and development. The market is projected to exceed xx million dollars in value by 2033, presenting lucrative opportunities for both established players and emerging companies. The convergence of advanced technologies, coupled with supportive regulatory environments, is expected to further accelerate market expansion.
Custom Diffractive Optical Elements Segmentation
-
1. Application
- 1.1. Industrial
- 1.2. Medical Industry
- 1.3. Others
-
2. Type
- 2.1. Beam Shapers
- 2.2. Beam Splitters
- 2.3. Diffusers
Custom Diffractive Optical Elements Segmentation By Geography
-
1. North America
- 1.1. United States
- 1.2. Canada
- 1.3. Mexico
-
2. South America
- 2.1. Brazil
- 2.2. Argentina
- 2.3. Rest of South America
-
3. Europe
- 3.1. United Kingdom
- 3.2. Germany
- 3.3. France
- 3.4. Italy
- 3.5. Spain
- 3.6. Russia
- 3.7. Benelux
- 3.8. Nordics
- 3.9. Rest of Europe
-
4. Middle East & Africa
- 4.1. Turkey
- 4.2. Israel
- 4.3. GCC
- 4.4. North Africa
- 4.5. South Africa
- 4.6. Rest of Middle East & Africa
-
5. Asia Pacific
- 5.1. China
- 5.2. India
- 5.3. Japan
- 5.4. South Korea
- 5.5. ASEAN
- 5.6. Oceania
- 5.7. Rest of Asia Pacific
Custom Diffractive Optical Elements Regional Market Share
Geographic Coverage of Custom Diffractive Optical Elements
Custom Diffractive Optical Elements REPORT HIGHLIGHTS
| Aspects | Details |
|---|---|
| Study Period | 2020-2034 |
| Base Year | 2025 |
| Estimated Year | 2026 |
| Forecast Period | 2026-2034 |
| Historical Period | 2020-2025 |
| Growth Rate | CAGR of XXX% from 2020-2034 |
| Segmentation |
|
Table of Contents
- 1. Introduction
- 1.1. Research Scope
- 1.2. Market Segmentation
- 1.3. Research Objective
- 1.4. Definitions and Assumptions
- 2. Executive Summary
- 2.1. Market Snapshot
- 3. Market Dynamics
- 3.1. Market Drivers
- 3.2. Market Restrains
- 3.3. Market Trends
- 3.4. Market Opportunities
- 4. Market Factor Analysis
- 4.1. Porters Five Forces
- 4.1.1. Bargaining Power of Suppliers
- 4.1.2. Bargaining Power of Buyers
- 4.1.3. Threat of New Entrants
- 4.1.4. Threat of Substitutes
- 4.1.5. Competitive Rivalry
- 4.2. PESTEL analysis
- 4.3. BCG Analysis
- 4.3.1. Stars (High Growth, High Market Share)
- 4.3.2. Cash Cows (Low Growth, High Market Share)
- 4.3.3. Question Mark (High Growth, Low Market Share)
- 4.3.4. Dogs (Low Growth, Low Market Share)
- 4.4. Ansoff Matrix Analysis
- 4.5. Supply Chain Analysis
- 4.6. Regulatory Landscape
- 4.7. Current Market Potential and Opportunity Assessment (TAM–SAM–SOM Framework)
- 4.8. DMV Analyst Note
- 4.1. Porters Five Forces
- 5. Market Analysis, Insights and Forecast 2021-2033
- 5.1. Market Analysis, Insights and Forecast - by Application
- 5.1.1. Industrial
- 5.1.2. Medical Industry
- 5.1.3. Others
- 5.2. Market Analysis, Insights and Forecast - by Type
- 5.2.1. Beam Shapers
- 5.2.2. Beam Splitters
- 5.2.3. Diffusers
- 5.3. Market Analysis, Insights and Forecast - by Region
- 5.3.1. North America
- 5.3.2. South America
- 5.3.3. Europe
- 5.3.4. Middle East & Africa
- 5.3.5. Asia Pacific
- 5.1. Market Analysis, Insights and Forecast - by Application
- 6. Global Custom Diffractive Optical Elements Analysis, Insights and Forecast, 2021-2033
- 6.1. Market Analysis, Insights and Forecast - by Application
- 6.1.1. Industrial
- 6.1.2. Medical Industry
- 6.1.3. Others
- 6.2. Market Analysis, Insights and Forecast - by Type
- 6.2.1. Beam Shapers
- 6.2.2. Beam Splitters
- 6.2.3. Diffusers
- 6.1. Market Analysis, Insights and Forecast - by Application
- 7. North America Custom Diffractive Optical Elements Analysis, Insights and Forecast, 2020-2032
- 7.1. Market Analysis, Insights and Forecast - by Application
- 7.1.1. Industrial
- 7.1.2. Medical Industry
- 7.1.3. Others
- 7.2. Market Analysis, Insights and Forecast - by Type
- 7.2.1. Beam Shapers
- 7.2.2. Beam Splitters
- 7.2.3. Diffusers
- 7.1. Market Analysis, Insights and Forecast - by Application
- 8. South America Custom Diffractive Optical Elements Analysis, Insights and Forecast, 2020-2032
- 8.1. Market Analysis, Insights and Forecast - by Application
- 8.1.1. Industrial
- 8.1.2. Medical Industry
- 8.1.3. Others
- 8.2. Market Analysis, Insights and Forecast - by Type
- 8.2.1. Beam Shapers
- 8.2.2. Beam Splitters
- 8.2.3. Diffusers
- 8.1. Market Analysis, Insights and Forecast - by Application
- 9. Europe Custom Diffractive Optical Elements Analysis, Insights and Forecast, 2020-2032
- 9.1. Market Analysis, Insights and Forecast - by Application
- 9.1.1. Industrial
- 9.1.2. Medical Industry
- 9.1.3. Others
- 9.2. Market Analysis, Insights and Forecast - by Type
- 9.2.1. Beam Shapers
- 9.2.2. Beam Splitters
- 9.2.3. Diffusers
- 9.1. Market Analysis, Insights and Forecast - by Application
- 10. Middle East & Africa Custom Diffractive Optical Elements Analysis, Insights and Forecast, 2020-2032
- 10.1. Market Analysis, Insights and Forecast - by Application
- 10.1.1. Industrial
- 10.1.2. Medical Industry
- 10.1.3. Others
- 10.2. Market Analysis, Insights and Forecast - by Type
- 10.2.1. Beam Shapers
- 10.2.2. Beam Splitters
- 10.2.3. Diffusers
- 10.1. Market Analysis, Insights and Forecast - by Application
- 11. Asia Pacific Custom Diffractive Optical Elements Analysis, Insights and Forecast, 2020-2032
- 11.1. Market Analysis, Insights and Forecast - by Application
- 11.1.1. Industrial
- 11.1.2. Medical Industry
- 11.1.3. Others
- 11.2. Market Analysis, Insights and Forecast - by Type
- 11.2.1. Beam Shapers
- 11.2.2. Beam Splitters
- 11.2.3. Diffusers
- 11.1. Market Analysis, Insights and Forecast - by Application
- 12. Competitive Analysis
- 12.1. Company Profiles
- 12.1.1 Canon
- 12.1.1.1. Company Overview
- 12.1.1.2. Products
- 12.1.1.3. Company Financials
- 12.1.1.4. SWOT Analysis
- 12.1.2 Holo/Or Ltd.
- 12.1.2.1. Company Overview
- 12.1.2.2. Products
- 12.1.2.3. Company Financials
- 12.1.2.4. SWOT Analysis
- 12.1.3 HORIBA
- 12.1.3.1. Company Overview
- 12.1.3.2. Products
- 12.1.3.3. Company Financials
- 12.1.3.4. SWOT Analysis
- 12.1.4 Newport Corporation
- 12.1.4.1. Company Overview
- 12.1.4.2. Products
- 12.1.4.3. Company Financials
- 12.1.4.4. SWOT Analysis
- 12.1.5 Jenoptik
- 12.1.5.1. Company Overview
- 12.1.5.2. Products
- 12.1.5.3. Company Financials
- 12.1.5.4. SWOT Analysis
- 12.1.6 Shimadzu Corporation
- 12.1.6.1. Company Overview
- 12.1.6.2. Products
- 12.1.6.3. Company Financials
- 12.1.6.4. SWOT Analysis
- 12.1.7 Zeiss
- 12.1.7.1. Company Overview
- 12.1.7.2. Products
- 12.1.7.3. Company Financials
- 12.1.7.4. SWOT Analysis
- 12.1.8 SUSS MicroTec AG.
- 12.1.8.1. Company Overview
- 12.1.8.2. Products
- 12.1.8.3. Company Financials
- 12.1.8.4. SWOT Analysis
- 12.1.9 Lightsmyth (Finisar)
- 12.1.9.1. Company Overview
- 12.1.9.2. Products
- 12.1.9.3. Company Financials
- 12.1.9.4. SWOT Analysis
- 12.1.10 Edmund Optics
- 12.1.10.1. Company Overview
- 12.1.10.2. Products
- 12.1.10.3. Company Financials
- 12.1.10.4. SWOT Analysis
- 12.1.11 Optometrics (Dynasil)
- 12.1.11.1. Company Overview
- 12.1.11.2. Products
- 12.1.11.3. Company Financials
- 12.1.11.4. SWOT Analysis
- 12.1.12 Headwall Photonics
- 12.1.12.1. Company Overview
- 12.1.12.2. Products
- 12.1.12.3. Company Financials
- 12.1.12.4. SWOT Analysis
- 12.1.13 Plymouth Grating Lab
- 12.1.13.1. Company Overview
- 12.1.13.2. Products
- 12.1.13.3. Company Financials
- 12.1.13.4. SWOT Analysis
- 12.1.14 Wasatch Photonics
- 12.1.14.1. Company Overview
- 12.1.14.2. Products
- 12.1.14.3. Company Financials
- 12.1.14.4. SWOT Analysis
- 12.1.15 Spectrogon AB
- 12.1.15.1. Company Overview
- 12.1.15.2. Products
- 12.1.15.3. Company Financials
- 12.1.15.4. SWOT Analysis
- 12.1.16 GratingWorks
- 12.1.16.1. Company Overview
- 12.1.16.2. Products
- 12.1.16.3. Company Financials
- 12.1.16.4. SWOT Analysis
- 12.1.1 Canon
- 12.2. Market Entropy
- 12.2.1 Company's Key Areas Served
- 12.2.2 Recent Developments
- 12.3. Company Market Share Analysis 2025
- 12.3.1 Top 5 Companies Market Share Analysis
- 12.3.2 Top 3 Companies Market Share Analysis
- 12.4. List of Potential Customers
- 13. Research Methodology
List of Figures
- Figure 1: Global Custom Diffractive Optical Elements Revenue Breakdown (million, %) by Region 2025 & 2033
- Figure 2: North America Custom Diffractive Optical Elements Revenue (million), by Application 2025 & 2033
- Figure 3: North America Custom Diffractive Optical Elements Revenue Share (%), by Application 2025 & 2033
- Figure 4: North America Custom Diffractive Optical Elements Revenue (million), by Type 2025 & 2033
- Figure 5: North America Custom Diffractive Optical Elements Revenue Share (%), by Type 2025 & 2033
- Figure 6: North America Custom Diffractive Optical Elements Revenue (million), by Country 2025 & 2033
- Figure 7: North America Custom Diffractive Optical Elements Revenue Share (%), by Country 2025 & 2033
- Figure 8: South America Custom Diffractive Optical Elements Revenue (million), by Application 2025 & 2033
- Figure 9: South America Custom Diffractive Optical Elements Revenue Share (%), by Application 2025 & 2033
- Figure 10: South America Custom Diffractive Optical Elements Revenue (million), by Type 2025 & 2033
- Figure 11: South America Custom Diffractive Optical Elements Revenue Share (%), by Type 2025 & 2033
- Figure 12: South America Custom Diffractive Optical Elements Revenue (million), by Country 2025 & 2033
- Figure 13: South America Custom Diffractive Optical Elements Revenue Share (%), by Country 2025 & 2033
- Figure 14: Europe Custom Diffractive Optical Elements Revenue (million), by Application 2025 & 2033
- Figure 15: Europe Custom Diffractive Optical Elements Revenue Share (%), by Application 2025 & 2033
- Figure 16: Europe Custom Diffractive Optical Elements Revenue (million), by Type 2025 & 2033
- Figure 17: Europe Custom Diffractive Optical Elements Revenue Share (%), by Type 2025 & 2033
- Figure 18: Europe Custom Diffractive Optical Elements Revenue (million), by Country 2025 & 2033
- Figure 19: Europe Custom Diffractive Optical Elements Revenue Share (%), by Country 2025 & 2033
- Figure 20: Middle East & Africa Custom Diffractive Optical Elements Revenue (million), by Application 2025 & 2033
- Figure 21: Middle East & Africa Custom Diffractive Optical Elements Revenue Share (%), by Application 2025 & 2033
- Figure 22: Middle East & Africa Custom Diffractive Optical Elements Revenue (million), by Type 2025 & 2033
- Figure 23: Middle East & Africa Custom Diffractive Optical Elements Revenue Share (%), by Type 2025 & 2033
- Figure 24: Middle East & Africa Custom Diffractive Optical Elements Revenue (million), by Country 2025 & 2033
- Figure 25: Middle East & Africa Custom Diffractive Optical Elements Revenue Share (%), by Country 2025 & 2033
- Figure 26: Asia Pacific Custom Diffractive Optical Elements Revenue (million), by Application 2025 & 2033
- Figure 27: Asia Pacific Custom Diffractive Optical Elements Revenue Share (%), by Application 2025 & 2033
- Figure 28: Asia Pacific Custom Diffractive Optical Elements Revenue (million), by Type 2025 & 2033
- Figure 29: Asia Pacific Custom Diffractive Optical Elements Revenue Share (%), by Type 2025 & 2033
- Figure 30: Asia Pacific Custom Diffractive Optical Elements Revenue (million), by Country 2025 & 2033
- Figure 31: Asia Pacific Custom Diffractive Optical Elements Revenue Share (%), by Country 2025 & 2033
List of Tables
- Table 1: Global Custom Diffractive Optical Elements Revenue million Forecast, by Application 2020 & 2033
- Table 2: Global Custom Diffractive Optical Elements Revenue million Forecast, by Type 2020 & 2033
- Table 3: Global Custom Diffractive Optical Elements Revenue million Forecast, by Region 2020 & 2033
- Table 4: Global Custom Diffractive Optical Elements Revenue million Forecast, by Application 2020 & 2033
- Table 5: Global Custom Diffractive Optical Elements Revenue million Forecast, by Type 2020 & 2033
- Table 6: Global Custom Diffractive Optical Elements Revenue million Forecast, by Country 2020 & 2033
- Table 7: United States Custom Diffractive Optical Elements Revenue (million) Forecast, by Application 2020 & 2033
- Table 8: Canada Custom Diffractive Optical Elements Revenue (million) Forecast, by Application 2020 & 2033
- Table 9: Mexico Custom Diffractive Optical Elements Revenue (million) Forecast, by Application 2020 & 2033
- Table 10: Global Custom Diffractive Optical Elements Revenue million Forecast, by Application 2020 & 2033
- Table 11: Global Custom Diffractive Optical Elements Revenue million Forecast, by Type 2020 & 2033
- Table 12: Global Custom Diffractive Optical Elements Revenue million Forecast, by Country 2020 & 2033
- Table 13: Brazil Custom Diffractive Optical Elements Revenue (million) Forecast, by Application 2020 & 2033
- Table 14: Argentina Custom Diffractive Optical Elements Revenue (million) Forecast, by Application 2020 & 2033
- Table 15: Rest of South America Custom Diffractive Optical Elements Revenue (million) Forecast, by Application 2020 & 2033
- Table 16: Global Custom Diffractive Optical Elements Revenue million Forecast, by Application 2020 & 2033
- Table 17: Global Custom Diffractive Optical Elements Revenue million Forecast, by Type 2020 & 2033
- Table 18: Global Custom Diffractive Optical Elements Revenue million Forecast, by Country 2020 & 2033
- Table 19: United Kingdom Custom Diffractive Optical Elements Revenue (million) Forecast, by Application 2020 & 2033
- Table 20: Germany Custom Diffractive Optical Elements Revenue (million) Forecast, by Application 2020 & 2033
- Table 21: France Custom Diffractive Optical Elements Revenue (million) Forecast, by Application 2020 & 2033
- Table 22: Italy Custom Diffractive Optical Elements Revenue (million) Forecast, by Application 2020 & 2033
- Table 23: Spain Custom Diffractive Optical Elements Revenue (million) Forecast, by Application 2020 & 2033
- Table 24: Russia Custom Diffractive Optical Elements Revenue (million) Forecast, by Application 2020 & 2033
- Table 25: Benelux Custom Diffractive Optical Elements Revenue (million) Forecast, by Application 2020 & 2033
- Table 26: Nordics Custom Diffractive Optical Elements Revenue (million) Forecast, by Application 2020 & 2033
- Table 27: Rest of Europe Custom Diffractive Optical Elements Revenue (million) Forecast, by Application 2020 & 2033
- Table 28: Global Custom Diffractive Optical Elements Revenue million Forecast, by Application 2020 & 2033
- Table 29: Global Custom Diffractive Optical Elements Revenue million Forecast, by Type 2020 & 2033
- Table 30: Global Custom Diffractive Optical Elements Revenue million Forecast, by Country 2020 & 2033
- Table 31: Turkey Custom Diffractive Optical Elements Revenue (million) Forecast, by Application 2020 & 2033
- Table 32: Israel Custom Diffractive Optical Elements Revenue (million) Forecast, by Application 2020 & 2033
- Table 33: GCC Custom Diffractive Optical Elements Revenue (million) Forecast, by Application 2020 & 2033
- Table 34: North Africa Custom Diffractive Optical Elements Revenue (million) Forecast, by Application 2020 & 2033
- Table 35: South Africa Custom Diffractive Optical Elements Revenue (million) Forecast, by Application 2020 & 2033
- Table 36: Rest of Middle East & Africa Custom Diffractive Optical Elements Revenue (million) Forecast, by Application 2020 & 2033
- Table 37: Global Custom Diffractive Optical Elements Revenue million Forecast, by Application 2020 & 2033
- Table 38: Global Custom Diffractive Optical Elements Revenue million Forecast, by Type 2020 & 2033
- Table 39: Global Custom Diffractive Optical Elements Revenue million Forecast, by Country 2020 & 2033
- Table 40: China Custom Diffractive Optical Elements Revenue (million) Forecast, by Application 2020 & 2033
- Table 41: India Custom Diffractive Optical Elements Revenue (million) Forecast, by Application 2020 & 2033
- Table 42: Japan Custom Diffractive Optical Elements Revenue (million) Forecast, by Application 2020 & 2033
- Table 43: South Korea Custom Diffractive Optical Elements Revenue (million) Forecast, by Application 2020 & 2033
- Table 44: ASEAN Custom Diffractive Optical Elements Revenue (million) Forecast, by Application 2020 & 2033
- Table 45: Oceania Custom Diffractive Optical Elements Revenue (million) Forecast, by Application 2020 & 2033
- Table 46: Rest of Asia Pacific Custom Diffractive Optical Elements Revenue (million) Forecast, by Application 2020 & 2033
Frequently Asked Questions
1. What is the projected Compound Annual Growth Rate (CAGR) of the Custom Diffractive Optical Elements?
The projected CAGR is approximately XXX%.
2. Which companies are prominent players in the Custom Diffractive Optical Elements?
Key companies in the market include Canon, Holo/Or Ltd., HORIBA, Newport Corporation, Jenoptik, Shimadzu Corporation, Zeiss, SUSS MicroTec AG., Lightsmyth (Finisar), Edmund Optics, Optometrics (Dynasil), Headwall Photonics, Plymouth Grating Lab, Wasatch Photonics, Spectrogon AB, GratingWorks.
3. What are the main segments of the Custom Diffractive Optical Elements?
The market segments include Application, Type.
4. Can you provide details about the market size?
The market size is estimated to be USD XXX million as of 2022.
5. What are some drivers contributing to market growth?
N/A
6. What are the notable trends driving market growth?
N/A
7. Are there any restraints impacting market growth?
N/A
8. Can you provide examples of recent developments in the market?
N/A
9. What pricing options are available for accessing the report?
Pricing options include single-user, multi-user, and enterprise licenses priced at USD 2900.00, USD 4350.00, and USD 5800.00 respectively.
10. Is the market size provided in terms of value or volume?
The market size is provided in terms of value, measured in million.
11. Are there any specific market keywords associated with the report?
Yes, the market keyword associated with the report is "Custom Diffractive Optical Elements," which aids in identifying and referencing the specific market segment covered.
12. How do I determine which pricing option suits my needs best?
The pricing options vary based on user requirements and access needs. Individual users may opt for single-user licenses, while businesses requiring broader access may choose multi-user or enterprise licenses for cost-effective access to the report.
13. Are there any additional resources or data provided in the Custom Diffractive Optical Elements report?
While the report offers comprehensive insights, it's advisable to review the specific contents or supplementary materials provided to ascertain if additional resources or data are available.
14. How can I stay updated on further developments or reports in the Custom Diffractive Optical Elements?
To stay informed about further developments, trends, and reports in the Custom Diffractive Optical Elements, consider subscribing to industry newsletters, following relevant companies and organizations, or regularly checking reputable industry news sources and publications.
Methodology
Step 1 - Identification of Relevant Samples Size from Population Database


Step 2 - Approaches for Defining Global Market Size (Value, Volume* & Price*)

Note*: In applicable scenarios
Step 3 - Data Sources
Primary Research
- Web Analytics
- Survey Reports
- Research Institute
- Latest Research Reports
- Opinion Leaders
Secondary Research
- Annual Reports
- White Paper
- Latest Press Release
- Industry Association
- Paid Database
- Investor Presentations

Step 4 - Data Triangulation
Involves using different sources of information in order to increase the validity of a study
These sources are likely to be stakeholders in a program - participants, other researchers, program staff, other community members, and so on.
Then we put all data in single framework & apply various statistical tools to find out the dynamic on the market.
During the analysis stage, feedback from the stakeholder groups would be compared to determine areas of agreement as well as areas of divergence