

Key Insights
The curved screen display market is experiencing robust growth, driven by increasing demand for immersive visual experiences across various applications. The market, encompassing monitors, televisions, and other display types, is witnessing a Compound Annual Growth Rate (CAGR) that, considering current industry trends, we can reasonably estimate to be around 8-10% from 2025-2033. This growth is fueled by factors such as the rising popularity of gaming, the increasing adoption of virtual reality (VR) and augmented reality (AR) technologies, and the growing preference for aesthetically pleasing and ergonomic displays in professional and home environments. Key players like Samsung, LG, and ASUS are driving innovation with higher resolutions, improved refresh rates, and enhanced color accuracy, catering to the evolving needs of consumers and businesses. The market is segmented by screen size, resolution, technology (e.g., OLED, LED, QLED), and application (e.g., gaming, professional use, home entertainment). While pricing remains a barrier for mass adoption, particularly in larger screen sizes, technological advancements are leading to cost reductions, making curved displays more accessible.
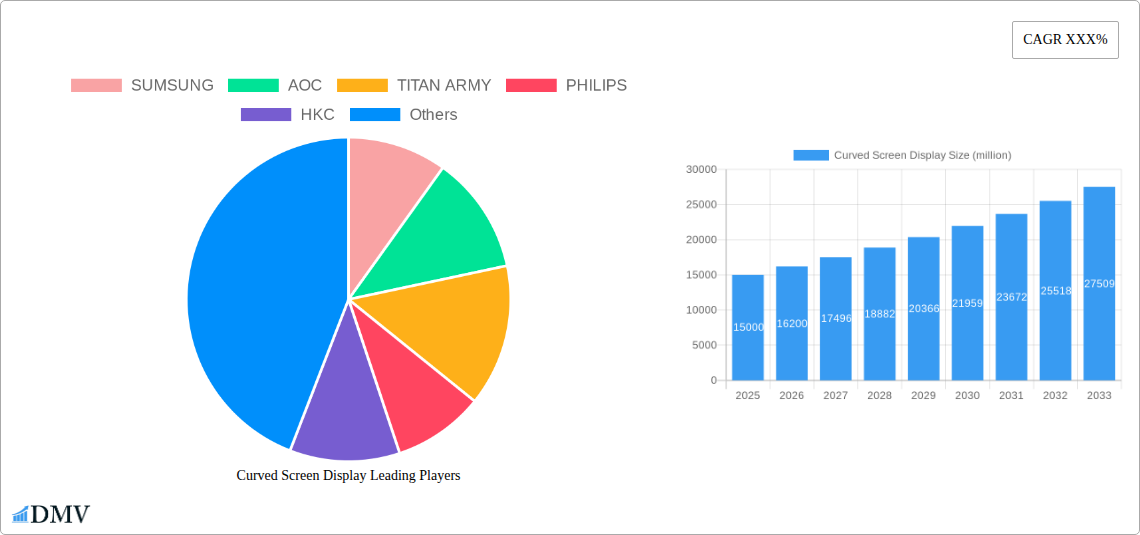
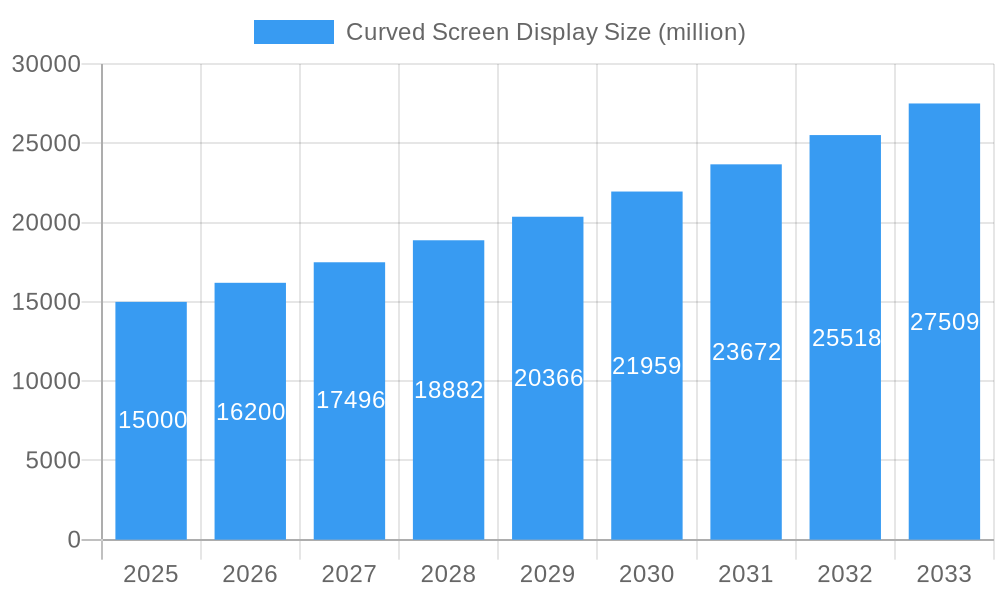
Curved Screen Display Market Size (In Billion)
Despite the growth trajectory, challenges remain. Competition is intensifying with numerous manufacturers vying for market share. The emergence of alternative display technologies, such as foldable screens, could pose a long-term threat. Furthermore, concerns about potential health issues associated with prolonged use of curved screens need to be addressed to ensure continued market acceptance. Geographical variations in market penetration exist, with developed regions like North America and Europe currently exhibiting higher adoption rates. However, emerging markets in Asia and Latin America are showing promising growth potential, driven by rising disposable incomes and increasing digitalization. The forecast period of 2025-2033 is expected to witness significant market expansion, driven by continuous technological innovation and expanding consumer demand.
Curved Screen Display Company Market Share
Curved Screen Display Market: A Comprehensive Report (2019-2033)
This insightful report provides a detailed analysis of the global curved screen display market, projecting a multi-million dollar valuation by 2033. We examine market trends, technological advancements, leading players, and future opportunities, offering valuable insights for stakeholders across the value chain. The study period covers 2019-2033, with 2025 as the base and estimated year. The forecast period spans 2025-2033, while the historical period encompasses 2019-2024.
Curved Screen Display Market Composition & Trends
This section delves into the competitive landscape of the curved screen display market, analyzing market concentration, innovation drivers, regulatory influences, substitute products, end-user demographics, and mergers & acquisitions (M&A) activities. The market is characterized by a moderate level of concentration, with key players like Samsung, LG, and ASUS holding significant shares. However, the emergence of several Chinese manufacturers, like AOC and HKC, is increasing competition. Innovation is primarily driven by advancements in display technologies, such as improved curvature radius, higher resolutions, and HDR capabilities. Regulatory landscapes vary across regions, impacting material sourcing and emission standards. Substitute products include flat-panel displays and other immersive technologies, such as VR headsets. End-user profiles include gaming enthusiasts, professionals in design and media, and general consumers seeking enhanced viewing experiences.
- Market Share Distribution (2024): Samsung (xx%), LG (xx%), ASUS (xx%), AOC (xx%), Others (xx%).
- M&A Activity (2019-2024): A total of xx M&A deals were recorded, with a cumulative value of approximately $xx million. Notable deals include (details to be provided in the full report).
Curved Screen Display Industry Evolution
This section explores the dynamic evolution of the curved screen display industry, detailing market growth trajectories, technological advancements, and evolving consumer preferences. The market experienced significant growth during the historical period (2019-2024), driven by increasing consumer demand for superior visual experiences and technological advancements in display panel manufacturing. The Compound Annual Growth Rate (CAGR) during this period was approximately xx%. Key technological advancements include the transition from VA to OLED panels, the introduction of mini-LED backlighting, and improvements in refresh rates and response times. Consumer demand is shifting towards larger screen sizes, higher resolutions, and improved color accuracy. The forecast period (2025-2033) is expected to see continued growth, although at a slightly moderated rate, with projected CAGR of xx%, driven by factors including the rising adoption of curved displays in gaming monitors, TVs and automotive dashboards. The total market size is projected to reach $xx million by 2033.
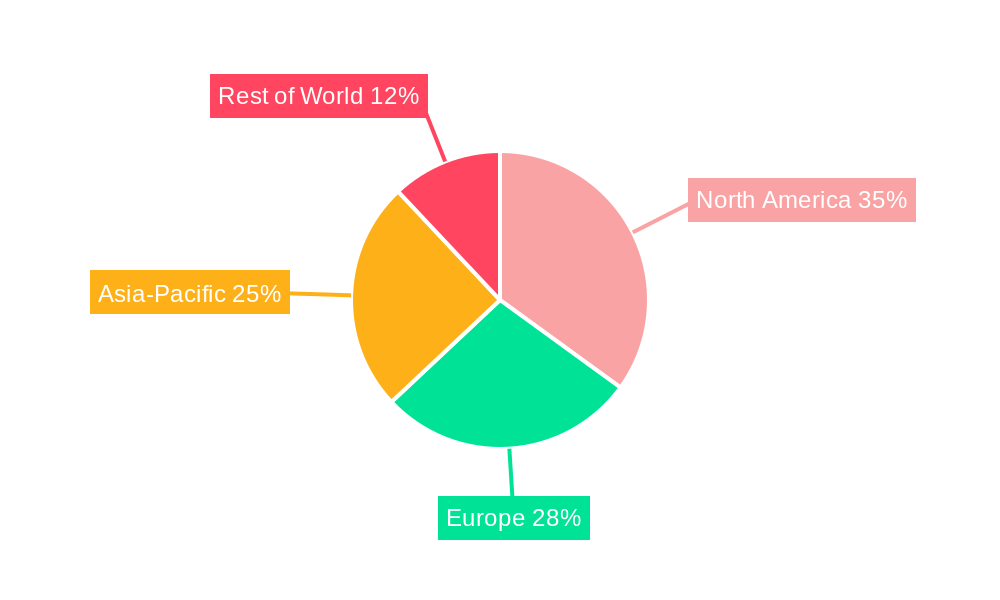
Leading Regions, Countries, or Segments in Curved Screen Display
This section identifies the dominant regions, countries, and segments within the curved screen display market. North America and Asia currently dominate the market, fueled by strong consumer demand and significant manufacturing capacity.
- Key Drivers in North America: High disposable incomes, early adoption of new technologies, and a strong presence of key players.
- Key Drivers in Asia: Large consumer base, expanding manufacturing capabilities, and cost-effectiveness.
- Dominant Segment: The gaming monitor segment is currently the largest, owing to the immersive experience offered by curved screens. However, growth is anticipated across other segments including televisions and automotive displays.
The dominance of these regions and segments stems from a combination of factors, including high consumer demand, robust manufacturing infrastructure, favorable regulatory environments, and significant investments in research and development. The full report will provide a granular analysis of regional and segmental performance.
Curved Screen Display Product Innovations
Recent product innovations in curved screen displays focus on enhanced visual fidelity, including higher resolutions (up to 8K), wider color gamuts (covering 100% of DCI-P3), and improved refresh rates (exceeding 240Hz). The integration of mini-LED backlighting offers improved contrast ratios and local dimming capabilities, resulting in more vivid and detailed images. Unique selling propositions revolve around features such as ultra-low response times for smoother gaming experiences and adaptive sync technologies for tear-free visuals.
Propelling Factors for Curved Screen Display Growth
Several factors are driving the growth of the curved screen display market. Technological advancements such as improved panel technologies and mini-LED backlighting are enhancing display quality and reducing costs. Economic factors, including increased disposable incomes and the affordability of curved displays, are broadening market reach. Government initiatives supporting technological innovation and environmental sustainability are providing further impetus.
Obstacles in the Curved Screen Display Market
The curved screen display market faces several challenges. Supply chain disruptions, including material shortages and logistical bottlenecks, impact production capacity and increase costs. Intense competition from established and emerging players puts pressure on pricing and profit margins. Furthermore, the high initial investment costs for manufacturing advanced curved displays can be a barrier to entry for smaller players.
Future Opportunities in Curved Screen Display
The future of the curved screen display market is bright, with several emerging opportunities. The expansion into new markets, especially developing economies, presents substantial growth potential. The adoption of flexible OLED technology, enabling even more radical curvatures and foldable displays, is also a significant opportunity. Emerging applications in augmented reality (AR) and virtual reality (VR) devices will further fuel market expansion.
Key Developments in Curved Screen Display Industry
- 2022 Q4: Samsung launched its new Odyssey Neo G9 monitor with Mini-LED technology.
- 2023 Q1: LG announced its new series of curved OLED TVs.
- 2023 Q2: AOC unveiled its first curved gaming monitor with a 320Hz refresh rate.
- (Further developments to be included in the full report)
Strategic Curved Screen Display Market Forecast
The curved screen display market is poised for continued growth, driven by technological advancements, expanding applications, and rising consumer demand. The market is expected to witness strong growth across various segments, especially gaming monitors and premium televisions. The adoption of innovative technologies, such as micro-LED and improved OLED panel technology, will further drive market expansion and product diversification. The overall market is expected to reach a valuation of $xx million by 2033, demonstrating a substantial growth trajectory.
Curved Screen Display Segmentation
-
1. Application
- 1.1. Internet Cafe
- 1.2. Family
- 1.3. Others
-
2. Type
- 2.1. IPS Panel
- 2.2. VA Panel
- 2.3. TN Panel
- 2.4. Others
Curved Screen Display Segmentation By Geography
-
1. North America
- 1.1. United States
- 1.2. Canada
- 1.3. Mexico
-
2. South America
- 2.1. Brazil
- 2.2. Argentina
- 2.3. Rest of South America
-
3. Europe
- 3.1. United Kingdom
- 3.2. Germany
- 3.3. France
- 3.4. Italy
- 3.5. Spain
- 3.6. Russia
- 3.7. Benelux
- 3.8. Nordics
- 3.9. Rest of Europe
-
4. Middle East & Africa
- 4.1. Turkey
- 4.2. Israel
- 4.3. GCC
- 4.4. North Africa
- 4.5. South Africa
- 4.6. Rest of Middle East & Africa
-
5. Asia Pacific
- 5.1. China
- 5.2. India
- 5.3. Japan
- 5.4. South Korea
- 5.5. ASEAN
- 5.6. Oceania
- 5.7. Rest of Asia Pacific
Curved Screen Display Regional Market Share
Geographic Coverage of Curved Screen Display
Curved Screen Display REPORT HIGHLIGHTS
| Aspects | Details |
|---|---|
| Study Period | 2020-2034 |
| Base Year | 2025 |
| Estimated Year | 2026 |
| Forecast Period | 2026-2034 |
| Historical Period | 2020-2025 |
| Growth Rate | CAGR of XXX% from 2020-2034 |
| Segmentation |
|
Table of Contents
- 1. Introduction
- 1.1. Research Scope
- 1.2. Market Segmentation
- 1.3. Research Objective
- 1.4. Definitions and Assumptions
- 2. Executive Summary
- 2.1. Market Snapshot
- 3. Market Dynamics
- 3.1. Market Drivers
- 3.2. Market Restrains
- 3.3. Market Trends
- 3.4. Market Opportunities
- 4. Market Factor Analysis
- 4.1. Porters Five Forces
- 4.1.1. Bargaining Power of Suppliers
- 4.1.2. Bargaining Power of Buyers
- 4.1.3. Threat of New Entrants
- 4.1.4. Threat of Substitutes
- 4.1.5. Competitive Rivalry
- 4.2. PESTEL analysis
- 4.3. BCG Analysis
- 4.3.1. Stars (High Growth, High Market Share)
- 4.3.2. Cash Cows (Low Growth, High Market Share)
- 4.3.3. Question Mark (High Growth, Low Market Share)
- 4.3.4. Dogs (Low Growth, Low Market Share)
- 4.4. Ansoff Matrix Analysis
- 4.5. Supply Chain Analysis
- 4.6. Regulatory Landscape
- 4.7. Current Market Potential and Opportunity Assessment (TAM–SAM–SOM Framework)
- 4.8. DMV Analyst Note
- 4.1. Porters Five Forces
- 5. Market Analysis, Insights and Forecast 2021-2033
- 5.1. Market Analysis, Insights and Forecast - by Application
- 5.1.1. Internet Cafe
- 5.1.2. Family
- 5.1.3. Others
- 5.2. Market Analysis, Insights and Forecast - by Type
- 5.2.1. IPS Panel
- 5.2.2. VA Panel
- 5.2.3. TN Panel
- 5.2.4. Others
- 5.3. Market Analysis, Insights and Forecast - by Region
- 5.3.1. North America
- 5.3.2. South America
- 5.3.3. Europe
- 5.3.4. Middle East & Africa
- 5.3.5. Asia Pacific
- 5.1. Market Analysis, Insights and Forecast - by Application
- 6. Global Curved Screen Display Analysis, Insights and Forecast, 2021-2033
- 6.1. Market Analysis, Insights and Forecast - by Application
- 6.1.1. Internet Cafe
- 6.1.2. Family
- 6.1.3. Others
- 6.2. Market Analysis, Insights and Forecast - by Type
- 6.2.1. IPS Panel
- 6.2.2. VA Panel
- 6.2.3. TN Panel
- 6.2.4. Others
- 6.1. Market Analysis, Insights and Forecast - by Application
- 7. North America Curved Screen Display Analysis, Insights and Forecast, 2020-2032
- 7.1. Market Analysis, Insights and Forecast - by Application
- 7.1.1. Internet Cafe
- 7.1.2. Family
- 7.1.3. Others
- 7.2. Market Analysis, Insights and Forecast - by Type
- 7.2.1. IPS Panel
- 7.2.2. VA Panel
- 7.2.3. TN Panel
- 7.2.4. Others
- 7.1. Market Analysis, Insights and Forecast - by Application
- 8. South America Curved Screen Display Analysis, Insights and Forecast, 2020-2032
- 8.1. Market Analysis, Insights and Forecast - by Application
- 8.1.1. Internet Cafe
- 8.1.2. Family
- 8.1.3. Others
- 8.2. Market Analysis, Insights and Forecast - by Type
- 8.2.1. IPS Panel
- 8.2.2. VA Panel
- 8.2.3. TN Panel
- 8.2.4. Others
- 8.1. Market Analysis, Insights and Forecast - by Application
- 9. Europe Curved Screen Display Analysis, Insights and Forecast, 2020-2032
- 9.1. Market Analysis, Insights and Forecast - by Application
- 9.1.1. Internet Cafe
- 9.1.2. Family
- 9.1.3. Others
- 9.2. Market Analysis, Insights and Forecast - by Type
- 9.2.1. IPS Panel
- 9.2.2. VA Panel
- 9.2.3. TN Panel
- 9.2.4. Others
- 9.1. Market Analysis, Insights and Forecast - by Application
- 10. Middle East & Africa Curved Screen Display Analysis, Insights and Forecast, 2020-2032
- 10.1. Market Analysis, Insights and Forecast - by Application
- 10.1.1. Internet Cafe
- 10.1.2. Family
- 10.1.3. Others
- 10.2. Market Analysis, Insights and Forecast - by Type
- 10.2.1. IPS Panel
- 10.2.2. VA Panel
- 10.2.3. TN Panel
- 10.2.4. Others
- 10.1. Market Analysis, Insights and Forecast - by Application
- 11. Asia Pacific Curved Screen Display Analysis, Insights and Forecast, 2020-2032
- 11.1. Market Analysis, Insights and Forecast - by Application
- 11.1.1. Internet Cafe
- 11.1.2. Family
- 11.1.3. Others
- 11.2. Market Analysis, Insights and Forecast - by Type
- 11.2.1. IPS Panel
- 11.2.2. VA Panel
- 11.2.3. TN Panel
- 11.2.4. Others
- 11.1. Market Analysis, Insights and Forecast - by Application
- 12. Competitive Analysis
- 12.1. Company Profiles
- 12.1.1 SUMSUNG
- 12.1.1.1. Company Overview
- 12.1.1.2. Products
- 12.1.1.3. Company Financials
- 12.1.1.4. SWOT Analysis
- 12.1.2 AOC
- 12.1.2.1. Company Overview
- 12.1.2.2. Products
- 12.1.2.3. Company Financials
- 12.1.2.4. SWOT Analysis
- 12.1.3 TITAN ARMY
- 12.1.3.1. Company Overview
- 12.1.3.2. Products
- 12.1.3.3. Company Financials
- 12.1.3.4. SWOT Analysis
- 12.1.4 PHILIPS
- 12.1.4.1. Company Overview
- 12.1.4.2. Products
- 12.1.4.3. Company Financials
- 12.1.4.4. SWOT Analysis
- 12.1.5 HKC
- 12.1.5.1. Company Overview
- 12.1.5.2. Products
- 12.1.5.3. Company Financials
- 12.1.5.4. SWOT Analysis
- 12.1.6 DELL
- 12.1.6.1. Company Overview
- 12.1.6.2. Products
- 12.1.6.3. Company Financials
- 12.1.6.4. SWOT Analysis
- 12.1.7 AOCSXM
- 12.1.7.1. Company Overview
- 12.1.7.2. Products
- 12.1.7.3. Company Financials
- 12.1.7.4. SWOT Analysis
- 12.1.8 MI
- 12.1.8.1. Company Overview
- 12.1.8.2. Products
- 12.1.8.3. Company Financials
- 12.1.8.4. SWOT Analysis
- 12.1.9 ASUS
- 12.1.9.1. Company Overview
- 12.1.9.2. Products
- 12.1.9.3. Company Financials
- 12.1.9.4. SWOT Analysis
- 12.1.10 ACER
- 12.1.10.1. Company Overview
- 12.1.10.2. Products
- 12.1.10.3. Company Financials
- 12.1.10.4. SWOT Analysis
- 12.1.11 YSNO
- 12.1.11.1. Company Overview
- 12.1.11.2. Products
- 12.1.11.3. Company Financials
- 12.1.11.4. SWOT Analysis
- 12.1.12 HUAWEI
- 12.1.12.1. Company Overview
- 12.1.12.2. Products
- 12.1.12.3. Company Financials
- 12.1.12.4. SWOT Analysis
- 12.1.13 MSI
- 12.1.13.1. Company Overview
- 12.1.13.2. Products
- 12.1.13.3. Company Financials
- 12.1.13.4. SWOT Analysis
- 12.1.14 LG
- 12.1.14.1. Company Overview
- 12.1.14.2. Products
- 12.1.14.3. Company Financials
- 12.1.14.4. SWOT Analysis
- 12.1.15 Skyworth
- 12.1.15.1. Company Overview
- 12.1.15.2. Products
- 12.1.15.3. Company Financials
- 12.1.15.4. SWOT Analysis
- 12.1.16 Thunderobot
- 12.1.16.1. Company Overview
- 12.1.16.2. Products
- 12.1.16.3. Company Financials
- 12.1.16.4. SWOT Analysis
- 12.1.17 Viewsonic
- 12.1.17.1. Company Overview
- 12.1.17.2. Products
- 12.1.17.3. Company Financials
- 12.1.17.4. SWOT Analysis
- 12.1.18 KTC
- 12.1.18.1. Company Overview
- 12.1.18.2. Products
- 12.1.18.3. Company Financials
- 12.1.18.4. SWOT Analysis
- 12.1.19 HP
- 12.1.19.1. Company Overview
- 12.1.19.2. Products
- 12.1.19.3. Company Financials
- 12.1.19.4. SWOT Analysis
- 12.1.20 LECOO
- 12.1.20.1. Company Overview
- 12.1.20.2. Products
- 12.1.20.3. Company Financials
- 12.1.20.4. SWOT Analysis
- 12.1.21 HPC
- 12.1.21.1. Company Overview
- 12.1.21.2. Products
- 12.1.21.3. Company Financials
- 12.1.21.4. SWOT Analysis
- 12.1.1 SUMSUNG
- 12.2. Market Entropy
- 12.2.1 Company's Key Areas Served
- 12.2.2 Recent Developments
- 12.3. Company Market Share Analysis 2025
- 12.3.1 Top 5 Companies Market Share Analysis
- 12.3.2 Top 3 Companies Market Share Analysis
- 12.4. List of Potential Customers
- 13. Research Methodology
List of Figures
- Figure 1: Global Curved Screen Display Revenue Breakdown (million, %) by Region 2025 & 2033
- Figure 2: Global Curved Screen Display Volume Breakdown (K, %) by Region 2025 & 2033
- Figure 3: North America Curved Screen Display Revenue (million), by Application 2025 & 2033
- Figure 4: North America Curved Screen Display Volume (K), by Application 2025 & 2033
- Figure 5: North America Curved Screen Display Revenue Share (%), by Application 2025 & 2033
- Figure 6: North America Curved Screen Display Volume Share (%), by Application 2025 & 2033
- Figure 7: North America Curved Screen Display Revenue (million), by Type 2025 & 2033
- Figure 8: North America Curved Screen Display Volume (K), by Type 2025 & 2033
- Figure 9: North America Curved Screen Display Revenue Share (%), by Type 2025 & 2033
- Figure 10: North America Curved Screen Display Volume Share (%), by Type 2025 & 2033
- Figure 11: North America Curved Screen Display Revenue (million), by Country 2025 & 2033
- Figure 12: North America Curved Screen Display Volume (K), by Country 2025 & 2033
- Figure 13: North America Curved Screen Display Revenue Share (%), by Country 2025 & 2033
- Figure 14: North America Curved Screen Display Volume Share (%), by Country 2025 & 2033
- Figure 15: South America Curved Screen Display Revenue (million), by Application 2025 & 2033
- Figure 16: South America Curved Screen Display Volume (K), by Application 2025 & 2033
- Figure 17: South America Curved Screen Display Revenue Share (%), by Application 2025 & 2033
- Figure 18: South America Curved Screen Display Volume Share (%), by Application 2025 & 2033
- Figure 19: South America Curved Screen Display Revenue (million), by Type 2025 & 2033
- Figure 20: South America Curved Screen Display Volume (K), by Type 2025 & 2033
- Figure 21: South America Curved Screen Display Revenue Share (%), by Type 2025 & 2033
- Figure 22: South America Curved Screen Display Volume Share (%), by Type 2025 & 2033
- Figure 23: South America Curved Screen Display Revenue (million), by Country 2025 & 2033
- Figure 24: South America Curved Screen Display Volume (K), by Country 2025 & 2033
- Figure 25: South America Curved Screen Display Revenue Share (%), by Country 2025 & 2033
- Figure 26: South America Curved Screen Display Volume Share (%), by Country 2025 & 2033
- Figure 27: Europe Curved Screen Display Revenue (million), by Application 2025 & 2033
- Figure 28: Europe Curved Screen Display Volume (K), by Application 2025 & 2033
- Figure 29: Europe Curved Screen Display Revenue Share (%), by Application 2025 & 2033
- Figure 30: Europe Curved Screen Display Volume Share (%), by Application 2025 & 2033
- Figure 31: Europe Curved Screen Display Revenue (million), by Type 2025 & 2033
- Figure 32: Europe Curved Screen Display Volume (K), by Type 2025 & 2033
- Figure 33: Europe Curved Screen Display Revenue Share (%), by Type 2025 & 2033
- Figure 34: Europe Curved Screen Display Volume Share (%), by Type 2025 & 2033
- Figure 35: Europe Curved Screen Display Revenue (million), by Country 2025 & 2033
- Figure 36: Europe Curved Screen Display Volume (K), by Country 2025 & 2033
- Figure 37: Europe Curved Screen Display Revenue Share (%), by Country 2025 & 2033
- Figure 38: Europe Curved Screen Display Volume Share (%), by Country 2025 & 2033
- Figure 39: Middle East & Africa Curved Screen Display Revenue (million), by Application 2025 & 2033
- Figure 40: Middle East & Africa Curved Screen Display Volume (K), by Application 2025 & 2033
- Figure 41: Middle East & Africa Curved Screen Display Revenue Share (%), by Application 2025 & 2033
- Figure 42: Middle East & Africa Curved Screen Display Volume Share (%), by Application 2025 & 2033
- Figure 43: Middle East & Africa Curved Screen Display Revenue (million), by Type 2025 & 2033
- Figure 44: Middle East & Africa Curved Screen Display Volume (K), by Type 2025 & 2033
- Figure 45: Middle East & Africa Curved Screen Display Revenue Share (%), by Type 2025 & 2033
- Figure 46: Middle East & Africa Curved Screen Display Volume Share (%), by Type 2025 & 2033
- Figure 47: Middle East & Africa Curved Screen Display Revenue (million), by Country 2025 & 2033
- Figure 48: Middle East & Africa Curved Screen Display Volume (K), by Country 2025 & 2033
- Figure 49: Middle East & Africa Curved Screen Display Revenue Share (%), by Country 2025 & 2033
- Figure 50: Middle East & Africa Curved Screen Display Volume Share (%), by Country 2025 & 2033
- Figure 51: Asia Pacific Curved Screen Display Revenue (million), by Application 2025 & 2033
- Figure 52: Asia Pacific Curved Screen Display Volume (K), by Application 2025 & 2033
- Figure 53: Asia Pacific Curved Screen Display Revenue Share (%), by Application 2025 & 2033
- Figure 54: Asia Pacific Curved Screen Display Volume Share (%), by Application 2025 & 2033
- Figure 55: Asia Pacific Curved Screen Display Revenue (million), by Type 2025 & 2033
- Figure 56: Asia Pacific Curved Screen Display Volume (K), by Type 2025 & 2033
- Figure 57: Asia Pacific Curved Screen Display Revenue Share (%), by Type 2025 & 2033
- Figure 58: Asia Pacific Curved Screen Display Volume Share (%), by Type 2025 & 2033
- Figure 59: Asia Pacific Curved Screen Display Revenue (million), by Country 2025 & 2033
- Figure 60: Asia Pacific Curved Screen Display Volume (K), by Country 2025 & 2033
- Figure 61: Asia Pacific Curved Screen Display Revenue Share (%), by Country 2025 & 2033
- Figure 62: Asia Pacific Curved Screen Display Volume Share (%), by Country 2025 & 2033
List of Tables
- Table 1: Global Curved Screen Display Revenue million Forecast, by Application 2020 & 2033
- Table 2: Global Curved Screen Display Volume K Forecast, by Application 2020 & 2033
- Table 3: Global Curved Screen Display Revenue million Forecast, by Type 2020 & 2033
- Table 4: Global Curved Screen Display Volume K Forecast, by Type 2020 & 2033
- Table 5: Global Curved Screen Display Revenue million Forecast, by Region 2020 & 2033
- Table 6: Global Curved Screen Display Volume K Forecast, by Region 2020 & 2033
- Table 7: Global Curved Screen Display Revenue million Forecast, by Application 2020 & 2033
- Table 8: Global Curved Screen Display Volume K Forecast, by Application 2020 & 2033
- Table 9: Global Curved Screen Display Revenue million Forecast, by Type 2020 & 2033
- Table 10: Global Curved Screen Display Volume K Forecast, by Type 2020 & 2033
- Table 11: Global Curved Screen Display Revenue million Forecast, by Country 2020 & 2033
- Table 12: Global Curved Screen Display Volume K Forecast, by Country 2020 & 2033
- Table 13: United States Curved Screen Display Revenue (million) Forecast, by Application 2020 & 2033
- Table 14: United States Curved Screen Display Volume (K) Forecast, by Application 2020 & 2033
- Table 15: Canada Curved Screen Display Revenue (million) Forecast, by Application 2020 & 2033
- Table 16: Canada Curved Screen Display Volume (K) Forecast, by Application 2020 & 2033
- Table 17: Mexico Curved Screen Display Revenue (million) Forecast, by Application 2020 & 2033
- Table 18: Mexico Curved Screen Display Volume (K) Forecast, by Application 2020 & 2033
- Table 19: Global Curved Screen Display Revenue million Forecast, by Application 2020 & 2033
- Table 20: Global Curved Screen Display Volume K Forecast, by Application 2020 & 2033
- Table 21: Global Curved Screen Display Revenue million Forecast, by Type 2020 & 2033
- Table 22: Global Curved Screen Display Volume K Forecast, by Type 2020 & 2033
- Table 23: Global Curved Screen Display Revenue million Forecast, by Country 2020 & 2033
- Table 24: Global Curved Screen Display Volume K Forecast, by Country 2020 & 2033
- Table 25: Brazil Curved Screen Display Revenue (million) Forecast, by Application 2020 & 2033
- Table 26: Brazil Curved Screen Display Volume (K) Forecast, by Application 2020 & 2033
- Table 27: Argentina Curved Screen Display Revenue (million) Forecast, by Application 2020 & 2033
- Table 28: Argentina Curved Screen Display Volume (K) Forecast, by Application 2020 & 2033
- Table 29: Rest of South America Curved Screen Display Revenue (million) Forecast, by Application 2020 & 2033
- Table 30: Rest of South America Curved Screen Display Volume (K) Forecast, by Application 2020 & 2033
- Table 31: Global Curved Screen Display Revenue million Forecast, by Application 2020 & 2033
- Table 32: Global Curved Screen Display Volume K Forecast, by Application 2020 & 2033
- Table 33: Global Curved Screen Display Revenue million Forecast, by Type 2020 & 2033
- Table 34: Global Curved Screen Display Volume K Forecast, by Type 2020 & 2033
- Table 35: Global Curved Screen Display Revenue million Forecast, by Country 2020 & 2033
- Table 36: Global Curved Screen Display Volume K Forecast, by Country 2020 & 2033
- Table 37: United Kingdom Curved Screen Display Revenue (million) Forecast, by Application 2020 & 2033
- Table 38: United Kingdom Curved Screen Display Volume (K) Forecast, by Application 2020 & 2033
- Table 39: Germany Curved Screen Display Revenue (million) Forecast, by Application 2020 & 2033
- Table 40: Germany Curved Screen Display Volume (K) Forecast, by Application 2020 & 2033
- Table 41: France Curved Screen Display Revenue (million) Forecast, by Application 2020 & 2033
- Table 42: France Curved Screen Display Volume (K) Forecast, by Application 2020 & 2033
- Table 43: Italy Curved Screen Display Revenue (million) Forecast, by Application 2020 & 2033
- Table 44: Italy Curved Screen Display Volume (K) Forecast, by Application 2020 & 2033
- Table 45: Spain Curved Screen Display Revenue (million) Forecast, by Application 2020 & 2033
- Table 46: Spain Curved Screen Display Volume (K) Forecast, by Application 2020 & 2033
- Table 47: Russia Curved Screen Display Revenue (million) Forecast, by Application 2020 & 2033
- Table 48: Russia Curved Screen Display Volume (K) Forecast, by Application 2020 & 2033
- Table 49: Benelux Curved Screen Display Revenue (million) Forecast, by Application 2020 & 2033
- Table 50: Benelux Curved Screen Display Volume (K) Forecast, by Application 2020 & 2033
- Table 51: Nordics Curved Screen Display Revenue (million) Forecast, by Application 2020 & 2033
- Table 52: Nordics Curved Screen Display Volume (K) Forecast, by Application 2020 & 2033
- Table 53: Rest of Europe Curved Screen Display Revenue (million) Forecast, by Application 2020 & 2033
- Table 54: Rest of Europe Curved Screen Display Volume (K) Forecast, by Application 2020 & 2033
- Table 55: Global Curved Screen Display Revenue million Forecast, by Application 2020 & 2033
- Table 56: Global Curved Screen Display Volume K Forecast, by Application 2020 & 2033
- Table 57: Global Curved Screen Display Revenue million Forecast, by Type 2020 & 2033
- Table 58: Global Curved Screen Display Volume K Forecast, by Type 2020 & 2033
- Table 59: Global Curved Screen Display Revenue million Forecast, by Country 2020 & 2033
- Table 60: Global Curved Screen Display Volume K Forecast, by Country 2020 & 2033
- Table 61: Turkey Curved Screen Display Revenue (million) Forecast, by Application 2020 & 2033
- Table 62: Turkey Curved Screen Display Volume (K) Forecast, by Application 2020 & 2033
- Table 63: Israel Curved Screen Display Revenue (million) Forecast, by Application 2020 & 2033
- Table 64: Israel Curved Screen Display Volume (K) Forecast, by Application 2020 & 2033
- Table 65: GCC Curved Screen Display Revenue (million) Forecast, by Application 2020 & 2033
- Table 66: GCC Curved Screen Display Volume (K) Forecast, by Application 2020 & 2033
- Table 67: North Africa Curved Screen Display Revenue (million) Forecast, by Application 2020 & 2033
- Table 68: North Africa Curved Screen Display Volume (K) Forecast, by Application 2020 & 2033
- Table 69: South Africa Curved Screen Display Revenue (million) Forecast, by Application 2020 & 2033
- Table 70: South Africa Curved Screen Display Volume (K) Forecast, by Application 2020 & 2033
- Table 71: Rest of Middle East & Africa Curved Screen Display Revenue (million) Forecast, by Application 2020 & 2033
- Table 72: Rest of Middle East & Africa Curved Screen Display Volume (K) Forecast, by Application 2020 & 2033
- Table 73: Global Curved Screen Display Revenue million Forecast, by Application 2020 & 2033
- Table 74: Global Curved Screen Display Volume K Forecast, by Application 2020 & 2033
- Table 75: Global Curved Screen Display Revenue million Forecast, by Type 2020 & 2033
- Table 76: Global Curved Screen Display Volume K Forecast, by Type 2020 & 2033
- Table 77: Global Curved Screen Display Revenue million Forecast, by Country 2020 & 2033
- Table 78: Global Curved Screen Display Volume K Forecast, by Country 2020 & 2033
- Table 79: China Curved Screen Display Revenue (million) Forecast, by Application 2020 & 2033
- Table 80: China Curved Screen Display Volume (K) Forecast, by Application 2020 & 2033
- Table 81: India Curved Screen Display Revenue (million) Forecast, by Application 2020 & 2033
- Table 82: India Curved Screen Display Volume (K) Forecast, by Application 2020 & 2033
- Table 83: Japan Curved Screen Display Revenue (million) Forecast, by Application 2020 & 2033
- Table 84: Japan Curved Screen Display Volume (K) Forecast, by Application 2020 & 2033
- Table 85: South Korea Curved Screen Display Revenue (million) Forecast, by Application 2020 & 2033
- Table 86: South Korea Curved Screen Display Volume (K) Forecast, by Application 2020 & 2033
- Table 87: ASEAN Curved Screen Display Revenue (million) Forecast, by Application 2020 & 2033
- Table 88: ASEAN Curved Screen Display Volume (K) Forecast, by Application 2020 & 2033
- Table 89: Oceania Curved Screen Display Revenue (million) Forecast, by Application 2020 & 2033
- Table 90: Oceania Curved Screen Display Volume (K) Forecast, by Application 2020 & 2033
- Table 91: Rest of Asia Pacific Curved Screen Display Revenue (million) Forecast, by Application 2020 & 2033
- Table 92: Rest of Asia Pacific Curved Screen Display Volume (K) Forecast, by Application 2020 & 2033
Frequently Asked Questions
1. What is the projected Compound Annual Growth Rate (CAGR) of the Curved Screen Display?
The projected CAGR is approximately XXX%.
2. Which companies are prominent players in the Curved Screen Display?
Key companies in the market include SUMSUNG, AOC, TITAN ARMY, PHILIPS, HKC, DELL, AOCSXM, MI, ASUS, ACER, YSNO, HUAWEI, MSI, LG, Skyworth, Thunderobot, Viewsonic, KTC, HP, LECOO, HPC.
3. What are the main segments of the Curved Screen Display?
The market segments include Application, Type.
4. Can you provide details about the market size?
The market size is estimated to be USD XXX million as of 2022.
5. What are some drivers contributing to market growth?
N/A
6. What are the notable trends driving market growth?
N/A
7. Are there any restraints impacting market growth?
N/A
8. Can you provide examples of recent developments in the market?
N/A
9. What pricing options are available for accessing the report?
Pricing options include single-user, multi-user, and enterprise licenses priced at USD 3950.00, USD 5925.00, and USD 7900.00 respectively.
10. Is the market size provided in terms of value or volume?
The market size is provided in terms of value, measured in million and volume, measured in K.
11. Are there any specific market keywords associated with the report?
Yes, the market keyword associated with the report is "Curved Screen Display," which aids in identifying and referencing the specific market segment covered.
12. How do I determine which pricing option suits my needs best?
The pricing options vary based on user requirements and access needs. Individual users may opt for single-user licenses, while businesses requiring broader access may choose multi-user or enterprise licenses for cost-effective access to the report.
13. Are there any additional resources or data provided in the Curved Screen Display report?
While the report offers comprehensive insights, it's advisable to review the specific contents or supplementary materials provided to ascertain if additional resources or data are available.
14. How can I stay updated on further developments or reports in the Curved Screen Display?
To stay informed about further developments, trends, and reports in the Curved Screen Display, consider subscribing to industry newsletters, following relevant companies and organizations, or regularly checking reputable industry news sources and publications.
Methodology
Step 1 - Identification of Relevant Samples Size from Population Database


Step 2 - Approaches for Defining Global Market Size (Value, Volume* & Price*)

Note*: In applicable scenarios
Step 3 - Data Sources
Primary Research
- Web Analytics
- Survey Reports
- Research Institute
- Latest Research Reports
- Opinion Leaders
Secondary Research
- Annual Reports
- White Paper
- Latest Press Release
- Industry Association
- Paid Database
- Investor Presentations

Step 4 - Data Triangulation
Involves using different sources of information in order to increase the validity of a study
These sources are likely to be stakeholders in a program - participants, other researchers, program staff, other community members, and so on.
Then we put all data in single framework & apply various statistical tools to find out the dynamic on the market.
During the analysis stage, feedback from the stakeholder groups would be compared to determine areas of agreement as well as areas of divergence