

Key Insights
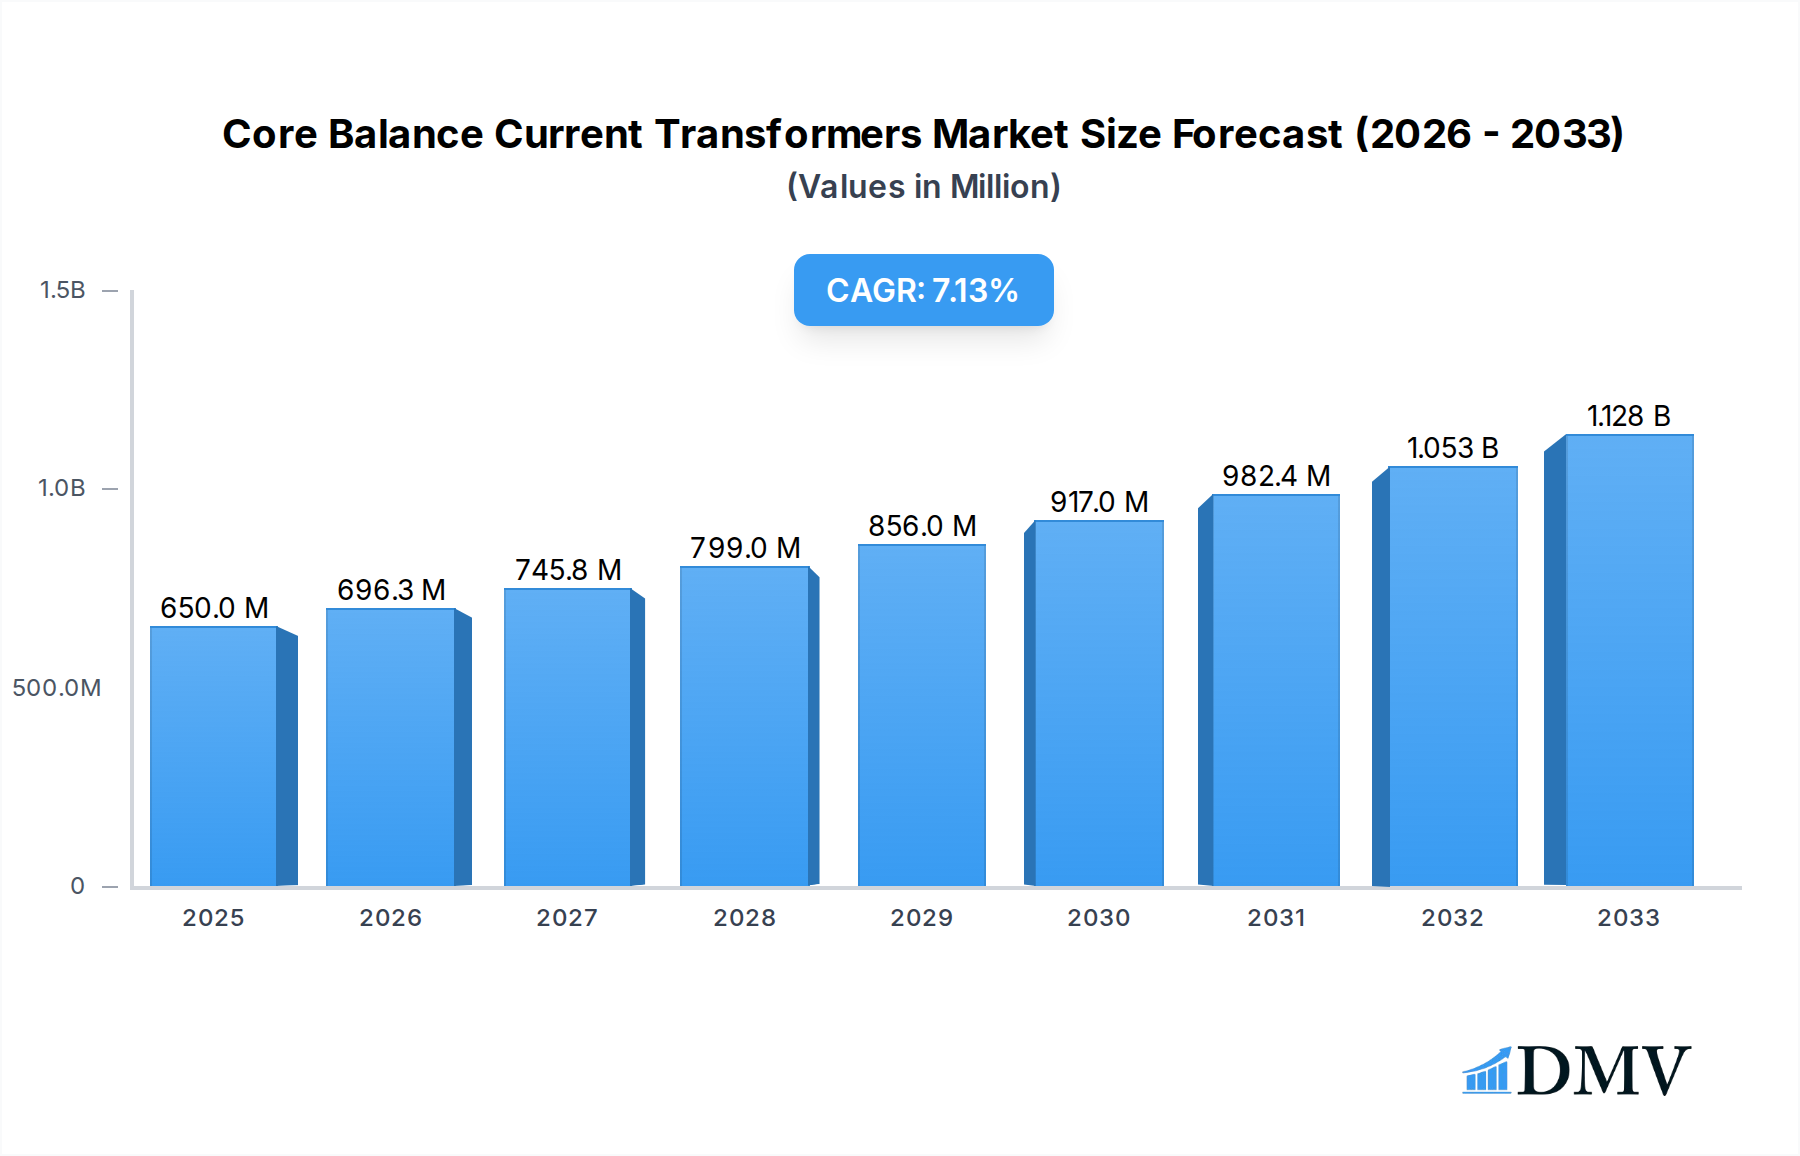
The global Core Balance Current Transformers (CBCT) market is projected to reach a substantial USD 650 million in 2025, demonstrating robust growth with a Compound Annual Growth Rate (CAGR) of 7.5% throughout the forecast period of 2025-2033. This expansion is primarily fueled by the increasing adoption of advanced electrical infrastructure and the critical role of CBCTs in ensuring the safety and efficiency of power systems. The surge in demand for sophisticated electrical protection, particularly in the wake of rising smart grid initiatives and the integration of renewable energy sources, underscores the market's upward trajectory. Furthermore, the growing need for precise current measurement in various applications, including electrical measuring instruments and switch mode power supplies, is a significant driver. Key market participants are investing in research and development to innovate and expand their product portfolios, catering to diverse application needs such as electrical protective devices and current sensing modules.

Core Balance Current Transformers Market Size (In Million)
The market is segmented by application and type, with Electrical Measuring Instruments, Electrical Protective Devices, and Current Metering expected to witness significant demand. The rise of smart grids and the increasing complexity of power distribution networks necessitate reliable and accurate current monitoring, where CBCTs play an indispensable role. The "Split Type" and "Through Type" configurations offer flexibility for diverse installation scenarios, further contributing to market penetration. Geographically, Asia Pacific, led by China and India, is anticipated to be a major growth engine due to rapid industrialization and escalating energy consumption. North America and Europe also represent substantial markets, driven by stringent safety regulations and the ongoing modernization of their electrical grids. Despite the positive outlook, potential restraints such as fluctuating raw material prices and the emergence of alternative protection technologies could pose challenges. However, the overall market sentiment remains optimistic, propelled by technological advancements and the indispensable nature of CBCTs in modern electrical systems.
Core Balance Current Transformers Company Market Share
This comprehensive report delves into the dynamic Core Balance Current Transformers market, offering an in-depth analysis of market composition, industry evolution, regional dominance, product innovations, growth drivers, challenges, future opportunities, and strategic forecasts. The study spans the historical period of 2019–2024, with a base year of 2025, and projects market trends through 2033. We provide actionable insights for stakeholders looking to navigate this critical sector of the electrical industry, driven by increasing demand for precision electrical measurement and protection.
Core Balance Current Transformers Market Composition & Trends
The Core Balance Current Transformers market exhibits a moderately concentrated landscape, with key players like Siemens, ABB, and Schneider Electric holding significant market share, estimated at over XXX million USD collectively. Innovation is primarily driven by the increasing demand for highly accurate Current Sensing Modules and Current Metering applications, particularly within the Electrical Measuring Instruments and Electrical Protective Devices segments. Regulatory landscapes are evolving, with stricter energy efficiency standards and grid modernization initiatives acting as catalysts for advanced Core Balance Current Transformer adoption. Substitute products, such as Hall effect sensors, offer alternative solutions, but Core Balance Current Transformers maintain an edge in specific high-current, high-accuracy scenarios. End-user profiles range from utility companies and industrial manufacturers to smart grid integrators and manufacturers of Switch Mode Power Supply (SMPS) systems. Mergers and Acquisitions (M&A) activities, with an estimated aggregate deal value of XXX million USD over the historical period, are shaping market consolidation and technological integration.
- Market Concentration: Dominated by a few major global players, with a growing presence of specialized manufacturers.
- Innovation Catalysts: Demand for smart grid technologies, renewable energy integration, and enhanced electrical safety.
- Regulatory Landscapes: Increasingly stringent standards for energy monitoring and fault detection.
- Substitute Products: Hall effect sensors, Rogowski coils, and resistive shunts.
- End-User Profiles: Utilities, industrial automation, renewable energy sector, EV charging infrastructure.
- M&A Activities: Focused on acquiring technological capabilities and expanding market reach.
Core Balance Current Transformers Industry Evolution
The Core Balance Current Transformers industry has witnessed a consistent upward trajectory, driven by the relentless global push for electrification, improved grid stability, and sophisticated electrical monitoring. Over the study period, the market has evolved from catering primarily to basic electrical protection to supporting advanced functionalities within smart grids and renewable energy systems. The historical period (2019–2024) saw an average annual growth rate of approximately XX% for Core Balance Current Transformers, fueled by significant investments in power infrastructure and the increasing adoption of sophisticated Electrical Measuring Instruments.
Technological advancements have been pivotal, with manufacturers continuously refining core materials for enhanced accuracy, reduced magnetic losses, and improved frequency response. The development of Split Type Core Balance Current Transformers has revolutionized installation processes, allowing for retrofitting without disrupting existing power lines, thus significantly boosting adoption rates in industrial settings. Concurrently, the demand for Through Type Current Transformers remains robust for new installations and panel meter applications where ease of integration is paramount.
Shifting consumer demands are increasingly emphasizing energy efficiency and real-time data analytics. This has led to the development of Core Balance Current Transformers with integrated communication capabilities, enabling seamless data flow to SCADA systems and cloud-based platforms for predictive maintenance and operational optimization. The rise of Electric Vehicles (EVs) and the expansion of EV charging infrastructure have opened new avenues for high-performance Core Balance Current Transformers, essential for managing charging loads and ensuring grid stability. The Composite Meter and Panel Meter segments, in particular, have seen an influx of demand for compact, high-precision Core Balance Current Transformers that offer reliable metering solutions for diverse applications. The market is projected to continue its growth, with an estimated Compound Annual Growth Rate (CAGR) of XX% during the forecast period (2025–2033), indicating sustained innovation and expanding application scope.
Leading Regions, Countries, or Segments in Core Balance Current Transformers
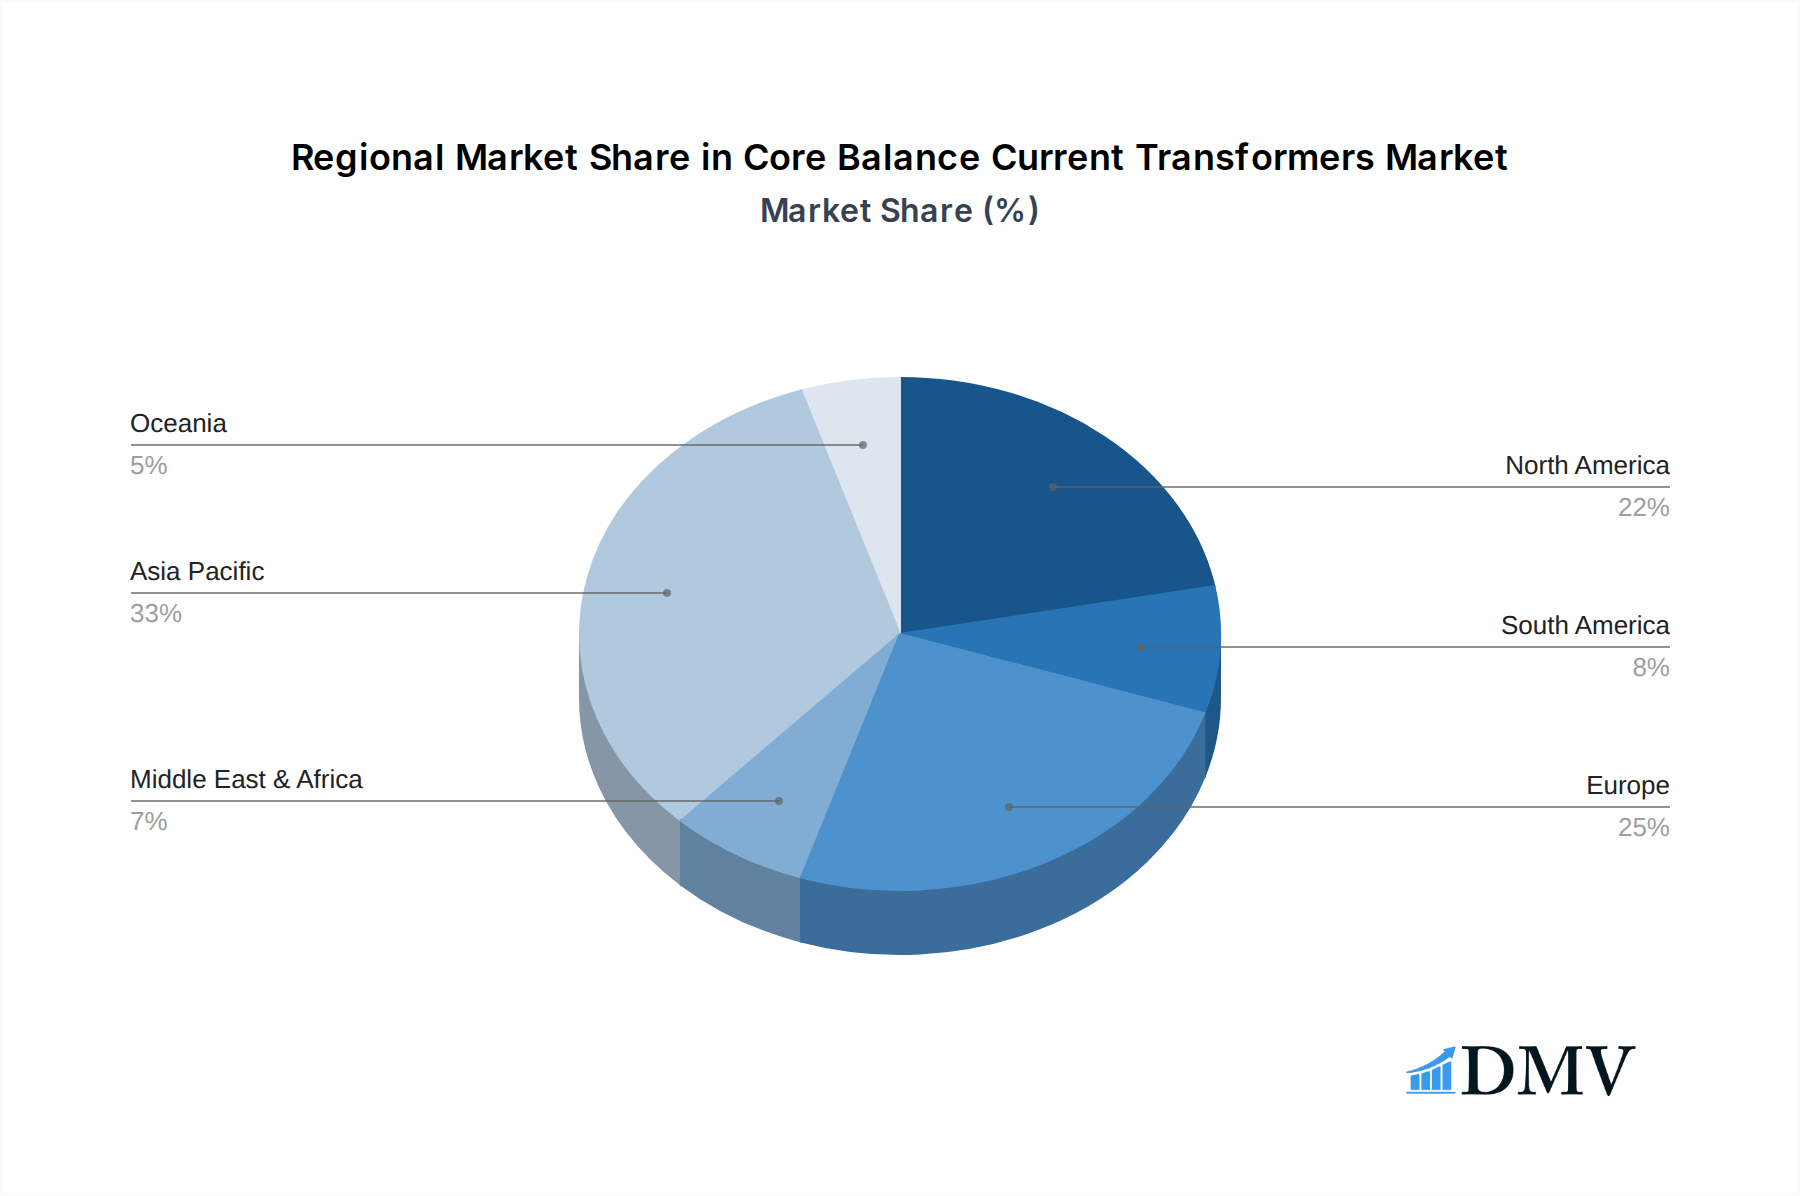
The global Core Balance Current Transformers market exhibits distinct regional strengths and segment dominance. North America and Europe currently lead in market penetration, driven by mature electrical infrastructure, substantial investments in smart grid technologies, and stringent safety regulations. Asia Pacific, however, is emerging as the fastest-growing region, propelled by rapid industrialization, expanding power generation capacity, and the increasing adoption of advanced electrical measuring instruments in countries like China and India.
Within the application segments, Electrical Protective Devices and Current Metering applications represent the largest and most influential segments. The imperative for enhanced grid reliability and fault detection in power distribution networks underpins the demand for Core Balance Current Transformers in protective devices. Similarly, the proliferation of smart meters and sophisticated energy monitoring systems has cemented the dominance of the Current Metering segment.
The Split Type Current Transformers have gained significant traction, particularly in retrofitting existing industrial facilities and upgrading substations. Their ease of installation without requiring power disconnection offers a compelling advantage, leading to a substantial market share within the Type segment. However, the Through Type Current Transformers remain a critical component for new installations and integration into panel boards and compact electrical assemblies, ensuring their continued importance.
Key drivers for regional and segment dominance include:
- Investment Trends: Substantial government and private sector investments in grid modernization and renewable energy integration.
- Regulatory Support: Favorable policies and standards promoting the adoption of advanced electrical monitoring and safety devices.
- Industrial Growth: Expansion of manufacturing sectors and infrastructure development in emerging economies.
- Technological Adoption: High receptiveness to new technologies like smart grids and IoT-enabled devices.
- Demand for Accuracy: Increasing need for precise current measurement in both protective and metering functions.
Core Balance Current Transformers Product Innovations
Recent product innovations in Core Balance Current Transformers are centered around miniaturization, enhanced accuracy, and integration capabilities. Manufacturers are developing Core Balance Current Transformers with significantly reduced footprints, catering to the growing demand for compact solutions in Switch Mode Power Supply (SMPS) and panel meter applications. Advancements in amorphous and nanocrystalline core materials are leading to transformers with extremely low insertion loss and high linearity across a wide range of frequencies, crucial for sophisticated current sensing modules. Furthermore, the integration of digital communication interfaces, such as Modbus or CAN bus, directly into Core Balance Current Transformer units is enabling real-time data transmission and remote monitoring, a significant leap for smart grid applications and electrical protective devices.
Propelling Factors for Core Balance Current Transformers Growth
The growth of the Core Balance Current Transformers market is propelled by several key factors. The increasing global demand for electricity, coupled with the ongoing integration of renewable energy sources like solar and wind, necessitates robust and reliable grid monitoring and protection, driving demand for these transformers. Government initiatives focused on smart grid development and energy efficiency are further stimulating market expansion. Technological advancements, leading to more accurate, compact, and feature-rich Core Balance Current Transformers, are making them indispensable across various applications, from electrical measuring instruments to industrial automation. The rising emphasis on electrical safety and the need to prevent equipment damage and power outages are also significant growth drivers.
Obstacles in the Core Balance Current Transformers Market
Despite strong growth prospects, the Core Balance Current Transformers market faces certain obstacles. Intense price competition among manufacturers, particularly in commoditized segments, can squeeze profit margins. Supply chain disruptions, exacerbated by geopolitical uncertainties and raw material price volatility, can impact production costs and lead times. Regulatory hurdles and varying standards across different regions can also create challenges for market entry and product compliance. Furthermore, the evolving landscape of substitute technologies, like advanced Hall effect sensors, poses a continuous competitive pressure, requiring continuous innovation to maintain market share.
Future Opportunities in Core Balance Current Transformers
Emerging opportunities in the Core Balance Current Transformers market are abundant and diverse. The rapid expansion of the Electric Vehicle (EV) charging infrastructure presents a significant growth avenue, requiring specialized transformers for managing charging loads and grid impact. The ongoing digital transformation of industrial sectors, including Industry 4.0 initiatives, will drive demand for smart and connected Core Balance Current Transformers capable of data acquisition and analysis. The increasing adoption of microgrids and distributed energy resources creates a need for localized and efficient current monitoring solutions. Furthermore, the development of advanced materials and manufacturing techniques promises further miniaturization and enhanced performance, opening up new application possibilities in areas like portable power solutions and advanced medical equipment.
Major Players in the Core Balance Current Transformers Ecosystem
- Siemens
- ABB
- Schneider Electric
- Socomec
- SEL
- KEMET Corporation
- LIOU Current Transformer
- IVY METERING
- FLEX-CORE
- Hirai Denkeiki Co.,Ltd.
- NAVAGO Electronics & Electricals
- Kappa Electricals
- Hammond Power Solutions
- Dechang Electronics
- Shaanxi Fullstar Electronics CO.,LTD
- Zhejiang Kripal Electric Co., Ltd.
- Xiamen ZTC Technology Co.,Ltd.
- Zhejiang Zhegui Electric Co., Ltd.
- Hubei Tianrui Electronic Co., Ltd.
- Beijing GFUVE Electronics Co., Ltd.
Key Developments in Core Balance Current Transformers Industry
- 2024: Launch of highly accurate Split Type Core Balance Current Transformers with integrated digital communication by Siemens, enhancing smart grid capabilities.
- 2023: ABB announces significant investment in R&D for advanced nanocrystalline core materials, aiming for unprecedented accuracy in Current Metering applications.
- 2023: Schneider Electric acquires a leading manufacturer of Current Sensing Modules, strengthening its portfolio in the industrial automation segment.
- 2022: KEMET Corporation introduces a new range of ultra-compact Core Balance Current Transformers for Switch Mode Power Supply applications.
- 2021: Socomec expands its offering of Composite Meter solutions featuring enhanced Core Balance Current Transformer technology.
- 2020: SEL develops a new generation of Core Balance Current Transformers optimized for high-frequency applications in renewable energy inverters.
- 2019: LIOU Current Transformer releases a series of cost-effective Through Type Core Balance Current Transformers, targeting emerging markets.
Strategic Core Balance Current Transformers Market Forecast
The strategic outlook for the Core Balance Current Transformers market remains highly optimistic. Growth will be fueled by the relentless expansion of global electrification, smart grid initiatives, and the increasing need for precision in electrical monitoring and protection. Innovations in material science and digital integration will unlock new application frontiers, particularly in renewable energy, electric mobility, and industrial automation. Companies that focus on developing highly accurate, compact, and digitally enabled Core Balance Current Transformers, while adeptly navigating regulatory landscapes and supply chain complexities, are poised for significant market leadership and sustained growth in the coming years. The market is projected to reach an estimated XXX million USD by 2033.
Core Balance Current Transformers Segmentation
-
1. Application
- 1.1. Electrical Measuring Instruments
- 1.2. Electrical Protective Devices
- 1.3. Current Sensing Modules
- 1.4. Current Metering
- 1.5. Composite Meter
- 1.6. Panel Meter
- 1.7. Switch Mode Power Supply (SMPS)
-
2. Type
- 2.1. Split Type
- 2.2. Through Type
Core Balance Current Transformers Segmentation By Geography
-
1. North America
- 1.1. United States
- 1.2. Canada
- 1.3. Mexico
-
2. South America
- 2.1. Brazil
- 2.2. Argentina
- 2.3. Rest of South America
-
3. Europe
- 3.1. United Kingdom
- 3.2. Germany
- 3.3. France
- 3.4. Italy
- 3.5. Spain
- 3.6. Russia
- 3.7. Benelux
- 3.8. Nordics
- 3.9. Rest of Europe
-
4. Middle East & Africa
- 4.1. Turkey
- 4.2. Israel
- 4.3. GCC
- 4.4. North Africa
- 4.5. South Africa
- 4.6. Rest of Middle East & Africa
-
5. Asia Pacific
- 5.1. China
- 5.2. India
- 5.3. Japan
- 5.4. South Korea
- 5.5. ASEAN
- 5.6. Oceania
- 5.7. Rest of Asia Pacific
Core Balance Current Transformers Regional Market Share
Geographic Coverage of Core Balance Current Transformers
Core Balance Current Transformers REPORT HIGHLIGHTS
| Aspects | Details |
|---|---|
| Study Period | 2020-2034 |
| Base Year | 2025 |
| Estimated Year | 2026 |
| Forecast Period | 2026-2034 |
| Historical Period | 2020-2025 |
| Growth Rate | CAGR of 7.5% from 2020-2034 |
| Segmentation |
|
Table of Contents
- 1. Introduction
- 1.1. Research Scope
- 1.2. Market Segmentation
- 1.3. Research Objective
- 1.4. Definitions and Assumptions
- 2. Executive Summary
- 2.1. Market Snapshot
- 3. Market Dynamics
- 3.1. Market Drivers
- 3.2. Market Restrains
- 3.3. Market Trends
- 3.4. Market Opportunities
- 4. Market Factor Analysis
- 4.1. Porters Five Forces
- 4.1.1. Bargaining Power of Suppliers
- 4.1.2. Bargaining Power of Buyers
- 4.1.3. Threat of New Entrants
- 4.1.4. Threat of Substitutes
- 4.1.5. Competitive Rivalry
- 4.2. PESTEL analysis
- 4.3. BCG Analysis
- 4.3.1. Stars (High Growth, High Market Share)
- 4.3.2. Cash Cows (Low Growth, High Market Share)
- 4.3.3. Question Mark (High Growth, Low Market Share)
- 4.3.4. Dogs (Low Growth, Low Market Share)
- 4.4. Ansoff Matrix Analysis
- 4.5. Supply Chain Analysis
- 4.6. Regulatory Landscape
- 4.7. Current Market Potential and Opportunity Assessment (TAM–SAM–SOM Framework)
- 4.8. DMV Analyst Note
- 4.1. Porters Five Forces
- 5. Market Analysis, Insights and Forecast 2021-2033
- 5.1. Market Analysis, Insights and Forecast - by Application
- 5.1.1. Electrical Measuring Instruments
- 5.1.2. Electrical Protective Devices
- 5.1.3. Current Sensing Modules
- 5.1.4. Current Metering
- 5.1.5. Composite Meter
- 5.1.6. Panel Meter
- 5.1.7. Switch Mode Power Supply (SMPS)
- 5.2. Market Analysis, Insights and Forecast - by Type
- 5.2.1. Split Type
- 5.2.2. Through Type
- 5.3. Market Analysis, Insights and Forecast - by Region
- 5.3.1. North America
- 5.3.2. South America
- 5.3.3. Europe
- 5.3.4. Middle East & Africa
- 5.3.5. Asia Pacific
- 5.1. Market Analysis, Insights and Forecast - by Application
- 6. Global Core Balance Current Transformers Analysis, Insights and Forecast, 2021-2033
- 6.1. Market Analysis, Insights and Forecast - by Application
- 6.1.1. Electrical Measuring Instruments
- 6.1.2. Electrical Protective Devices
- 6.1.3. Current Sensing Modules
- 6.1.4. Current Metering
- 6.1.5. Composite Meter
- 6.1.6. Panel Meter
- 6.1.7. Switch Mode Power Supply (SMPS)
- 6.2. Market Analysis, Insights and Forecast - by Type
- 6.2.1. Split Type
- 6.2.2. Through Type
- 6.1. Market Analysis, Insights and Forecast - by Application
- 7. North America Core Balance Current Transformers Analysis, Insights and Forecast, 2020-2032
- 7.1. Market Analysis, Insights and Forecast - by Application
- 7.1.1. Electrical Measuring Instruments
- 7.1.2. Electrical Protective Devices
- 7.1.3. Current Sensing Modules
- 7.1.4. Current Metering
- 7.1.5. Composite Meter
- 7.1.6. Panel Meter
- 7.1.7. Switch Mode Power Supply (SMPS)
- 7.2. Market Analysis, Insights and Forecast - by Type
- 7.2.1. Split Type
- 7.2.2. Through Type
- 7.1. Market Analysis, Insights and Forecast - by Application
- 8. South America Core Balance Current Transformers Analysis, Insights and Forecast, 2020-2032
- 8.1. Market Analysis, Insights and Forecast - by Application
- 8.1.1. Electrical Measuring Instruments
- 8.1.2. Electrical Protective Devices
- 8.1.3. Current Sensing Modules
- 8.1.4. Current Metering
- 8.1.5. Composite Meter
- 8.1.6. Panel Meter
- 8.1.7. Switch Mode Power Supply (SMPS)
- 8.2. Market Analysis, Insights and Forecast - by Type
- 8.2.1. Split Type
- 8.2.2. Through Type
- 8.1. Market Analysis, Insights and Forecast - by Application
- 9. Europe Core Balance Current Transformers Analysis, Insights and Forecast, 2020-2032
- 9.1. Market Analysis, Insights and Forecast - by Application
- 9.1.1. Electrical Measuring Instruments
- 9.1.2. Electrical Protective Devices
- 9.1.3. Current Sensing Modules
- 9.1.4. Current Metering
- 9.1.5. Composite Meter
- 9.1.6. Panel Meter
- 9.1.7. Switch Mode Power Supply (SMPS)
- 9.2. Market Analysis, Insights and Forecast - by Type
- 9.2.1. Split Type
- 9.2.2. Through Type
- 9.1. Market Analysis, Insights and Forecast - by Application
- 10. Middle East & Africa Core Balance Current Transformers Analysis, Insights and Forecast, 2020-2032
- 10.1. Market Analysis, Insights and Forecast - by Application
- 10.1.1. Electrical Measuring Instruments
- 10.1.2. Electrical Protective Devices
- 10.1.3. Current Sensing Modules
- 10.1.4. Current Metering
- 10.1.5. Composite Meter
- 10.1.6. Panel Meter
- 10.1.7. Switch Mode Power Supply (SMPS)
- 10.2. Market Analysis, Insights and Forecast - by Type
- 10.2.1. Split Type
- 10.2.2. Through Type
- 10.1. Market Analysis, Insights and Forecast - by Application
- 11. Asia Pacific Core Balance Current Transformers Analysis, Insights and Forecast, 2020-2032
- 11.1. Market Analysis, Insights and Forecast - by Application
- 11.1.1. Electrical Measuring Instruments
- 11.1.2. Electrical Protective Devices
- 11.1.3. Current Sensing Modules
- 11.1.4. Current Metering
- 11.1.5. Composite Meter
- 11.1.6. Panel Meter
- 11.1.7. Switch Mode Power Supply (SMPS)
- 11.2. Market Analysis, Insights and Forecast - by Type
- 11.2.1. Split Type
- 11.2.2. Through Type
- 11.1. Market Analysis, Insights and Forecast - by Application
- 12. Competitive Analysis
- 12.1. Company Profiles
- 12.1.1 Siemens
- 12.1.1.1. Company Overview
- 12.1.1.2. Products
- 12.1.1.3. Company Financials
- 12.1.1.4. SWOT Analysis
- 12.1.2 ABB
- 12.1.2.1. Company Overview
- 12.1.2.2. Products
- 12.1.2.3. Company Financials
- 12.1.2.4. SWOT Analysis
- 12.1.3 Schneider Electric
- 12.1.3.1. Company Overview
- 12.1.3.2. Products
- 12.1.3.3. Company Financials
- 12.1.3.4. SWOT Analysis
- 12.1.4 Socomec
- 12.1.4.1. Company Overview
- 12.1.4.2. Products
- 12.1.4.3. Company Financials
- 12.1.4.4. SWOT Analysis
- 12.1.5 SEL
- 12.1.5.1. Company Overview
- 12.1.5.2. Products
- 12.1.5.3. Company Financials
- 12.1.5.4. SWOT Analysis
- 12.1.6 KEMET Corporation
- 12.1.6.1. Company Overview
- 12.1.6.2. Products
- 12.1.6.3. Company Financials
- 12.1.6.4. SWOT Analysis
- 12.1.7 LIOU Current Transformer
- 12.1.7.1. Company Overview
- 12.1.7.2. Products
- 12.1.7.3. Company Financials
- 12.1.7.4. SWOT Analysis
- 12.1.8 IVY METERING
- 12.1.8.1. Company Overview
- 12.1.8.2. Products
- 12.1.8.3. Company Financials
- 12.1.8.4. SWOT Analysis
- 12.1.9 FLEX-CORE
- 12.1.9.1. Company Overview
- 12.1.9.2. Products
- 12.1.9.3. Company Financials
- 12.1.9.4. SWOT Analysis
- 12.1.10 Hirai Denkeiki Co.Ltd.
- 12.1.10.1. Company Overview
- 12.1.10.2. Products
- 12.1.10.3. Company Financials
- 12.1.10.4. SWOT Analysis
- 12.1.11 NAVAGO Electronics & Electricals
- 12.1.11.1. Company Overview
- 12.1.11.2. Products
- 12.1.11.3. Company Financials
- 12.1.11.4. SWOT Analysis
- 12.1.12 Kappa Electricals
- 12.1.12.1. Company Overview
- 12.1.12.2. Products
- 12.1.12.3. Company Financials
- 12.1.12.4. SWOT Analysis
- 12.1.13 Hammond Power Solutions
- 12.1.13.1. Company Overview
- 12.1.13.2. Products
- 12.1.13.3. Company Financials
- 12.1.13.4. SWOT Analysis
- 12.1.14 Dechang Electronics
- 12.1.14.1. Company Overview
- 12.1.14.2. Products
- 12.1.14.3. Company Financials
- 12.1.14.4. SWOT Analysis
- 12.1.15 Shaanxi Fullstar Electronics CO.LTD
- 12.1.15.1. Company Overview
- 12.1.15.2. Products
- 12.1.15.3. Company Financials
- 12.1.15.4. SWOT Analysis
- 12.1.16 Zhejiang Kripal Electric Co. Ltd.
- 12.1.16.1. Company Overview
- 12.1.16.2. Products
- 12.1.16.3. Company Financials
- 12.1.16.4. SWOT Analysis
- 12.1.17 Xiamen ZTC Technology Co.Ltd.
- 12.1.17.1. Company Overview
- 12.1.17.2. Products
- 12.1.17.3. Company Financials
- 12.1.17.4. SWOT Analysis
- 12.1.18 Zhejiang Zhegui Electric Co. Ltd.
- 12.1.18.1. Company Overview
- 12.1.18.2. Products
- 12.1.18.3. Company Financials
- 12.1.18.4. SWOT Analysis
- 12.1.19 Hubei Tianrui Electronic Co. Ltd.
- 12.1.19.1. Company Overview
- 12.1.19.2. Products
- 12.1.19.3. Company Financials
- 12.1.19.4. SWOT Analysis
- 12.1.20 Beijing GFUVE Electronics Co. Ltd.
- 12.1.20.1. Company Overview
- 12.1.20.2. Products
- 12.1.20.3. Company Financials
- 12.1.20.4. SWOT Analysis
- 12.1.1 Siemens
- 12.2. Market Entropy
- 12.2.1 Company's Key Areas Served
- 12.2.2 Recent Developments
- 12.3. Company Market Share Analysis 2025
- 12.3.1 Top 5 Companies Market Share Analysis
- 12.3.2 Top 3 Companies Market Share Analysis
- 12.4. List of Potential Customers
- 13. Research Methodology
List of Figures
- Figure 1: Global Core Balance Current Transformers Revenue Breakdown (million, %) by Region 2025 & 2033
- Figure 2: Global Core Balance Current Transformers Volume Breakdown (K, %) by Region 2025 & 2033
- Figure 3: North America Core Balance Current Transformers Revenue (million), by Application 2025 & 2033
- Figure 4: North America Core Balance Current Transformers Volume (K), by Application 2025 & 2033
- Figure 5: North America Core Balance Current Transformers Revenue Share (%), by Application 2025 & 2033
- Figure 6: North America Core Balance Current Transformers Volume Share (%), by Application 2025 & 2033
- Figure 7: North America Core Balance Current Transformers Revenue (million), by Type 2025 & 2033
- Figure 8: North America Core Balance Current Transformers Volume (K), by Type 2025 & 2033
- Figure 9: North America Core Balance Current Transformers Revenue Share (%), by Type 2025 & 2033
- Figure 10: North America Core Balance Current Transformers Volume Share (%), by Type 2025 & 2033
- Figure 11: North America Core Balance Current Transformers Revenue (million), by Country 2025 & 2033
- Figure 12: North America Core Balance Current Transformers Volume (K), by Country 2025 & 2033
- Figure 13: North America Core Balance Current Transformers Revenue Share (%), by Country 2025 & 2033
- Figure 14: North America Core Balance Current Transformers Volume Share (%), by Country 2025 & 2033
- Figure 15: South America Core Balance Current Transformers Revenue (million), by Application 2025 & 2033
- Figure 16: South America Core Balance Current Transformers Volume (K), by Application 2025 & 2033
- Figure 17: South America Core Balance Current Transformers Revenue Share (%), by Application 2025 & 2033
- Figure 18: South America Core Balance Current Transformers Volume Share (%), by Application 2025 & 2033
- Figure 19: South America Core Balance Current Transformers Revenue (million), by Type 2025 & 2033
- Figure 20: South America Core Balance Current Transformers Volume (K), by Type 2025 & 2033
- Figure 21: South America Core Balance Current Transformers Revenue Share (%), by Type 2025 & 2033
- Figure 22: South America Core Balance Current Transformers Volume Share (%), by Type 2025 & 2033
- Figure 23: South America Core Balance Current Transformers Revenue (million), by Country 2025 & 2033
- Figure 24: South America Core Balance Current Transformers Volume (K), by Country 2025 & 2033
- Figure 25: South America Core Balance Current Transformers Revenue Share (%), by Country 2025 & 2033
- Figure 26: South America Core Balance Current Transformers Volume Share (%), by Country 2025 & 2033
- Figure 27: Europe Core Balance Current Transformers Revenue (million), by Application 2025 & 2033
- Figure 28: Europe Core Balance Current Transformers Volume (K), by Application 2025 & 2033
- Figure 29: Europe Core Balance Current Transformers Revenue Share (%), by Application 2025 & 2033
- Figure 30: Europe Core Balance Current Transformers Volume Share (%), by Application 2025 & 2033
- Figure 31: Europe Core Balance Current Transformers Revenue (million), by Type 2025 & 2033
- Figure 32: Europe Core Balance Current Transformers Volume (K), by Type 2025 & 2033
- Figure 33: Europe Core Balance Current Transformers Revenue Share (%), by Type 2025 & 2033
- Figure 34: Europe Core Balance Current Transformers Volume Share (%), by Type 2025 & 2033
- Figure 35: Europe Core Balance Current Transformers Revenue (million), by Country 2025 & 2033
- Figure 36: Europe Core Balance Current Transformers Volume (K), by Country 2025 & 2033
- Figure 37: Europe Core Balance Current Transformers Revenue Share (%), by Country 2025 & 2033
- Figure 38: Europe Core Balance Current Transformers Volume Share (%), by Country 2025 & 2033
- Figure 39: Middle East & Africa Core Balance Current Transformers Revenue (million), by Application 2025 & 2033
- Figure 40: Middle East & Africa Core Balance Current Transformers Volume (K), by Application 2025 & 2033
- Figure 41: Middle East & Africa Core Balance Current Transformers Revenue Share (%), by Application 2025 & 2033
- Figure 42: Middle East & Africa Core Balance Current Transformers Volume Share (%), by Application 2025 & 2033
- Figure 43: Middle East & Africa Core Balance Current Transformers Revenue (million), by Type 2025 & 2033
- Figure 44: Middle East & Africa Core Balance Current Transformers Volume (K), by Type 2025 & 2033
- Figure 45: Middle East & Africa Core Balance Current Transformers Revenue Share (%), by Type 2025 & 2033
- Figure 46: Middle East & Africa Core Balance Current Transformers Volume Share (%), by Type 2025 & 2033
- Figure 47: Middle East & Africa Core Balance Current Transformers Revenue (million), by Country 2025 & 2033
- Figure 48: Middle East & Africa Core Balance Current Transformers Volume (K), by Country 2025 & 2033
- Figure 49: Middle East & Africa Core Balance Current Transformers Revenue Share (%), by Country 2025 & 2033
- Figure 50: Middle East & Africa Core Balance Current Transformers Volume Share (%), by Country 2025 & 2033
- Figure 51: Asia Pacific Core Balance Current Transformers Revenue (million), by Application 2025 & 2033
- Figure 52: Asia Pacific Core Balance Current Transformers Volume (K), by Application 2025 & 2033
- Figure 53: Asia Pacific Core Balance Current Transformers Revenue Share (%), by Application 2025 & 2033
- Figure 54: Asia Pacific Core Balance Current Transformers Volume Share (%), by Application 2025 & 2033
- Figure 55: Asia Pacific Core Balance Current Transformers Revenue (million), by Type 2025 & 2033
- Figure 56: Asia Pacific Core Balance Current Transformers Volume (K), by Type 2025 & 2033
- Figure 57: Asia Pacific Core Balance Current Transformers Revenue Share (%), by Type 2025 & 2033
- Figure 58: Asia Pacific Core Balance Current Transformers Volume Share (%), by Type 2025 & 2033
- Figure 59: Asia Pacific Core Balance Current Transformers Revenue (million), by Country 2025 & 2033
- Figure 60: Asia Pacific Core Balance Current Transformers Volume (K), by Country 2025 & 2033
- Figure 61: Asia Pacific Core Balance Current Transformers Revenue Share (%), by Country 2025 & 2033
- Figure 62: Asia Pacific Core Balance Current Transformers Volume Share (%), by Country 2025 & 2033
List of Tables
- Table 1: Global Core Balance Current Transformers Revenue million Forecast, by Application 2020 & 2033
- Table 2: Global Core Balance Current Transformers Volume K Forecast, by Application 2020 & 2033
- Table 3: Global Core Balance Current Transformers Revenue million Forecast, by Type 2020 & 2033
- Table 4: Global Core Balance Current Transformers Volume K Forecast, by Type 2020 & 2033
- Table 5: Global Core Balance Current Transformers Revenue million Forecast, by Region 2020 & 2033
- Table 6: Global Core Balance Current Transformers Volume K Forecast, by Region 2020 & 2033
- Table 7: Global Core Balance Current Transformers Revenue million Forecast, by Application 2020 & 2033
- Table 8: Global Core Balance Current Transformers Volume K Forecast, by Application 2020 & 2033
- Table 9: Global Core Balance Current Transformers Revenue million Forecast, by Type 2020 & 2033
- Table 10: Global Core Balance Current Transformers Volume K Forecast, by Type 2020 & 2033
- Table 11: Global Core Balance Current Transformers Revenue million Forecast, by Country 2020 & 2033
- Table 12: Global Core Balance Current Transformers Volume K Forecast, by Country 2020 & 2033
- Table 13: United States Core Balance Current Transformers Revenue (million) Forecast, by Application 2020 & 2033
- Table 14: United States Core Balance Current Transformers Volume (K) Forecast, by Application 2020 & 2033
- Table 15: Canada Core Balance Current Transformers Revenue (million) Forecast, by Application 2020 & 2033
- Table 16: Canada Core Balance Current Transformers Volume (K) Forecast, by Application 2020 & 2033
- Table 17: Mexico Core Balance Current Transformers Revenue (million) Forecast, by Application 2020 & 2033
- Table 18: Mexico Core Balance Current Transformers Volume (K) Forecast, by Application 2020 & 2033
- Table 19: Global Core Balance Current Transformers Revenue million Forecast, by Application 2020 & 2033
- Table 20: Global Core Balance Current Transformers Volume K Forecast, by Application 2020 & 2033
- Table 21: Global Core Balance Current Transformers Revenue million Forecast, by Type 2020 & 2033
- Table 22: Global Core Balance Current Transformers Volume K Forecast, by Type 2020 & 2033
- Table 23: Global Core Balance Current Transformers Revenue million Forecast, by Country 2020 & 2033
- Table 24: Global Core Balance Current Transformers Volume K Forecast, by Country 2020 & 2033
- Table 25: Brazil Core Balance Current Transformers Revenue (million) Forecast, by Application 2020 & 2033
- Table 26: Brazil Core Balance Current Transformers Volume (K) Forecast, by Application 2020 & 2033
- Table 27: Argentina Core Balance Current Transformers Revenue (million) Forecast, by Application 2020 & 2033
- Table 28: Argentina Core Balance Current Transformers Volume (K) Forecast, by Application 2020 & 2033
- Table 29: Rest of South America Core Balance Current Transformers Revenue (million) Forecast, by Application 2020 & 2033
- Table 30: Rest of South America Core Balance Current Transformers Volume (K) Forecast, by Application 2020 & 2033
- Table 31: Global Core Balance Current Transformers Revenue million Forecast, by Application 2020 & 2033
- Table 32: Global Core Balance Current Transformers Volume K Forecast, by Application 2020 & 2033
- Table 33: Global Core Balance Current Transformers Revenue million Forecast, by Type 2020 & 2033
- Table 34: Global Core Balance Current Transformers Volume K Forecast, by Type 2020 & 2033
- Table 35: Global Core Balance Current Transformers Revenue million Forecast, by Country 2020 & 2033
- Table 36: Global Core Balance Current Transformers Volume K Forecast, by Country 2020 & 2033
- Table 37: United Kingdom Core Balance Current Transformers Revenue (million) Forecast, by Application 2020 & 2033
- Table 38: United Kingdom Core Balance Current Transformers Volume (K) Forecast, by Application 2020 & 2033
- Table 39: Germany Core Balance Current Transformers Revenue (million) Forecast, by Application 2020 & 2033
- Table 40: Germany Core Balance Current Transformers Volume (K) Forecast, by Application 2020 & 2033
- Table 41: France Core Balance Current Transformers Revenue (million) Forecast, by Application 2020 & 2033
- Table 42: France Core Balance Current Transformers Volume (K) Forecast, by Application 2020 & 2033
- Table 43: Italy Core Balance Current Transformers Revenue (million) Forecast, by Application 2020 & 2033
- Table 44: Italy Core Balance Current Transformers Volume (K) Forecast, by Application 2020 & 2033
- Table 45: Spain Core Balance Current Transformers Revenue (million) Forecast, by Application 2020 & 2033
- Table 46: Spain Core Balance Current Transformers Volume (K) Forecast, by Application 2020 & 2033
- Table 47: Russia Core Balance Current Transformers Revenue (million) Forecast, by Application 2020 & 2033
- Table 48: Russia Core Balance Current Transformers Volume (K) Forecast, by Application 2020 & 2033
- Table 49: Benelux Core Balance Current Transformers Revenue (million) Forecast, by Application 2020 & 2033
- Table 50: Benelux Core Balance Current Transformers Volume (K) Forecast, by Application 2020 & 2033
- Table 51: Nordics Core Balance Current Transformers Revenue (million) Forecast, by Application 2020 & 2033
- Table 52: Nordics Core Balance Current Transformers Volume (K) Forecast, by Application 2020 & 2033
- Table 53: Rest of Europe Core Balance Current Transformers Revenue (million) Forecast, by Application 2020 & 2033
- Table 54: Rest of Europe Core Balance Current Transformers Volume (K) Forecast, by Application 2020 & 2033
- Table 55: Global Core Balance Current Transformers Revenue million Forecast, by Application 2020 & 2033
- Table 56: Global Core Balance Current Transformers Volume K Forecast, by Application 2020 & 2033
- Table 57: Global Core Balance Current Transformers Revenue million Forecast, by Type 2020 & 2033
- Table 58: Global Core Balance Current Transformers Volume K Forecast, by Type 2020 & 2033
- Table 59: Global Core Balance Current Transformers Revenue million Forecast, by Country 2020 & 2033
- Table 60: Global Core Balance Current Transformers Volume K Forecast, by Country 2020 & 2033
- Table 61: Turkey Core Balance Current Transformers Revenue (million) Forecast, by Application 2020 & 2033
- Table 62: Turkey Core Balance Current Transformers Volume (K) Forecast, by Application 2020 & 2033
- Table 63: Israel Core Balance Current Transformers Revenue (million) Forecast, by Application 2020 & 2033
- Table 64: Israel Core Balance Current Transformers Volume (K) Forecast, by Application 2020 & 2033
- Table 65: GCC Core Balance Current Transformers Revenue (million) Forecast, by Application 2020 & 2033
- Table 66: GCC Core Balance Current Transformers Volume (K) Forecast, by Application 2020 & 2033
- Table 67: North Africa Core Balance Current Transformers Revenue (million) Forecast, by Application 2020 & 2033
- Table 68: North Africa Core Balance Current Transformers Volume (K) Forecast, by Application 2020 & 2033
- Table 69: South Africa Core Balance Current Transformers Revenue (million) Forecast, by Application 2020 & 2033
- Table 70: South Africa Core Balance Current Transformers Volume (K) Forecast, by Application 2020 & 2033
- Table 71: Rest of Middle East & Africa Core Balance Current Transformers Revenue (million) Forecast, by Application 2020 & 2033
- Table 72: Rest of Middle East & Africa Core Balance Current Transformers Volume (K) Forecast, by Application 2020 & 2033
- Table 73: Global Core Balance Current Transformers Revenue million Forecast, by Application 2020 & 2033
- Table 74: Global Core Balance Current Transformers Volume K Forecast, by Application 2020 & 2033
- Table 75: Global Core Balance Current Transformers Revenue million Forecast, by Type 2020 & 2033
- Table 76: Global Core Balance Current Transformers Volume K Forecast, by Type 2020 & 2033
- Table 77: Global Core Balance Current Transformers Revenue million Forecast, by Country 2020 & 2033
- Table 78: Global Core Balance Current Transformers Volume K Forecast, by Country 2020 & 2033
- Table 79: China Core Balance Current Transformers Revenue (million) Forecast, by Application 2020 & 2033
- Table 80: China Core Balance Current Transformers Volume (K) Forecast, by Application 2020 & 2033
- Table 81: India Core Balance Current Transformers Revenue (million) Forecast, by Application 2020 & 2033
- Table 82: India Core Balance Current Transformers Volume (K) Forecast, by Application 2020 & 2033
- Table 83: Japan Core Balance Current Transformers Revenue (million) Forecast, by Application 2020 & 2033
- Table 84: Japan Core Balance Current Transformers Volume (K) Forecast, by Application 2020 & 2033
- Table 85: South Korea Core Balance Current Transformers Revenue (million) Forecast, by Application 2020 & 2033
- Table 86: South Korea Core Balance Current Transformers Volume (K) Forecast, by Application 2020 & 2033
- Table 87: ASEAN Core Balance Current Transformers Revenue (million) Forecast, by Application 2020 & 2033
- Table 88: ASEAN Core Balance Current Transformers Volume (K) Forecast, by Application 2020 & 2033
- Table 89: Oceania Core Balance Current Transformers Revenue (million) Forecast, by Application 2020 & 2033
- Table 90: Oceania Core Balance Current Transformers Volume (K) Forecast, by Application 2020 & 2033
- Table 91: Rest of Asia Pacific Core Balance Current Transformers Revenue (million) Forecast, by Application 2020 & 2033
- Table 92: Rest of Asia Pacific Core Balance Current Transformers Volume (K) Forecast, by Application 2020 & 2033
Frequently Asked Questions
1. What is the projected Compound Annual Growth Rate (CAGR) of the Core Balance Current Transformers?
The projected CAGR is approximately 7.5%.
2. Which companies are prominent players in the Core Balance Current Transformers?
Key companies in the market include Siemens, ABB, Schneider Electric, Socomec, SEL, KEMET Corporation, LIOU Current Transformer, IVY METERING, FLEX-CORE, Hirai Denkeiki Co.,Ltd., NAVAGO Electronics & Electricals, Kappa Electricals, Hammond Power Solutions, Dechang Electronics, Shaanxi Fullstar Electronics CO.,LTD, Zhejiang Kripal Electric Co., Ltd., Xiamen ZTC Technology Co.,Ltd., Zhejiang Zhegui Electric Co., Ltd., Hubei Tianrui Electronic Co., Ltd., Beijing GFUVE Electronics Co., Ltd..
3. What are the main segments of the Core Balance Current Transformers?
The market segments include Application, Type.
4. Can you provide details about the market size?
The market size is estimated to be USD 650 million as of 2022.
5. What are some drivers contributing to market growth?
N/A
6. What are the notable trends driving market growth?
N/A
7. Are there any restraints impacting market growth?
N/A
8. Can you provide examples of recent developments in the market?
N/A
9. What pricing options are available for accessing the report?
Pricing options include single-user, multi-user, and enterprise licenses priced at USD 3950.00, USD 5925.00, and USD 7900.00 respectively.
10. Is the market size provided in terms of value or volume?
The market size is provided in terms of value, measured in million and volume, measured in K.
11. Are there any specific market keywords associated with the report?
Yes, the market keyword associated with the report is "Core Balance Current Transformers," which aids in identifying and referencing the specific market segment covered.
12. How do I determine which pricing option suits my needs best?
The pricing options vary based on user requirements and access needs. Individual users may opt for single-user licenses, while businesses requiring broader access may choose multi-user or enterprise licenses for cost-effective access to the report.
13. Are there any additional resources or data provided in the Core Balance Current Transformers report?
While the report offers comprehensive insights, it's advisable to review the specific contents or supplementary materials provided to ascertain if additional resources or data are available.
14. How can I stay updated on further developments or reports in the Core Balance Current Transformers?
To stay informed about further developments, trends, and reports in the Core Balance Current Transformers, consider subscribing to industry newsletters, following relevant companies and organizations, or regularly checking reputable industry news sources and publications.
Methodology
Step 1 - Identification of Relevant Samples Size from Population Database


Step 2 - Approaches for Defining Global Market Size (Value, Volume* & Price*)

Note*: In applicable scenarios
Step 3 - Data Sources
Primary Research
- Web Analytics
- Survey Reports
- Research Institute
- Latest Research Reports
- Opinion Leaders
Secondary Research
- Annual Reports
- White Paper
- Latest Press Release
- Industry Association
- Paid Database
- Investor Presentations

Step 4 - Data Triangulation
Involves using different sources of information in order to increase the validity of a study
These sources are likely to be stakeholders in a program - participants, other researchers, program staff, other community members, and so on.
Then we put all data in single framework & apply various statistical tools to find out the dynamic on the market.
During the analysis stage, feedback from the stakeholder groups would be compared to determine areas of agreement as well as areas of divergence