

Key Insights
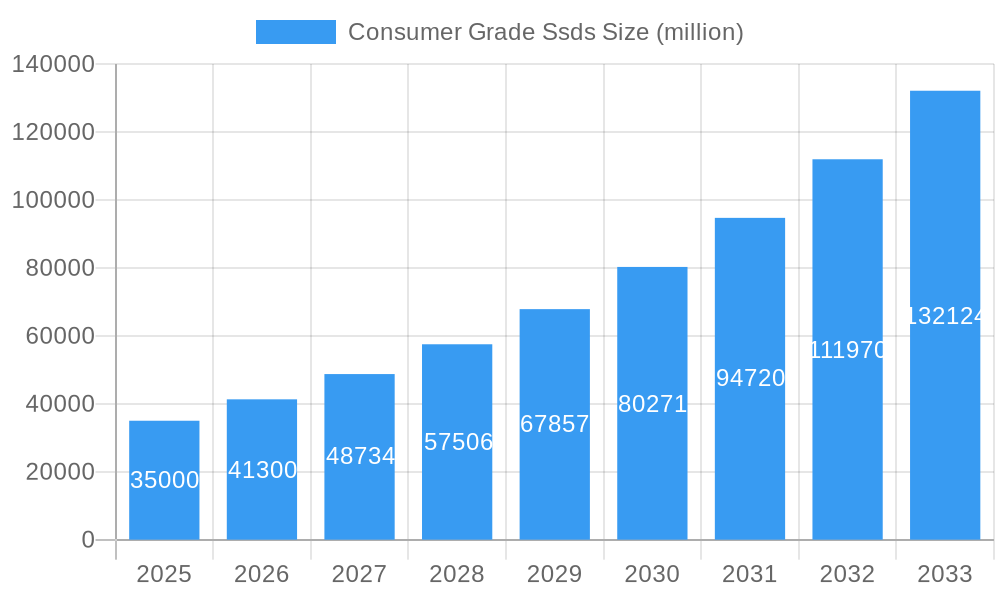
The global consumer-grade SSD market is poised for substantial growth, driven by an insatiable demand for faster data storage solutions across a multitude of devices. With an estimated market size of USD 35,000 million in 2025, this sector is projected to expand at a robust Compound Annual Growth Rate (CAGR) of 18% through 2033. This surge is primarily fueled by the increasing adoption of SSDs in laptops and mobile phones, as consumers prioritize enhanced performance and quicker boot-up times. The proliferation of high-definition content, intense gaming, and sophisticated multimedia applications further necessitates the speed and efficiency that SSDs offer over traditional hard drives. Moreover, the declining cost of NAND flash memory, the core component of SSDs, is making these advanced storage solutions increasingly accessible to a broader consumer base, thereby expanding market penetration. Emerging markets, particularly in the Asia Pacific region, are expected to be significant growth contributors due to rapid digitalization and a burgeoning middle class with a high propensity for purchasing new electronic devices.
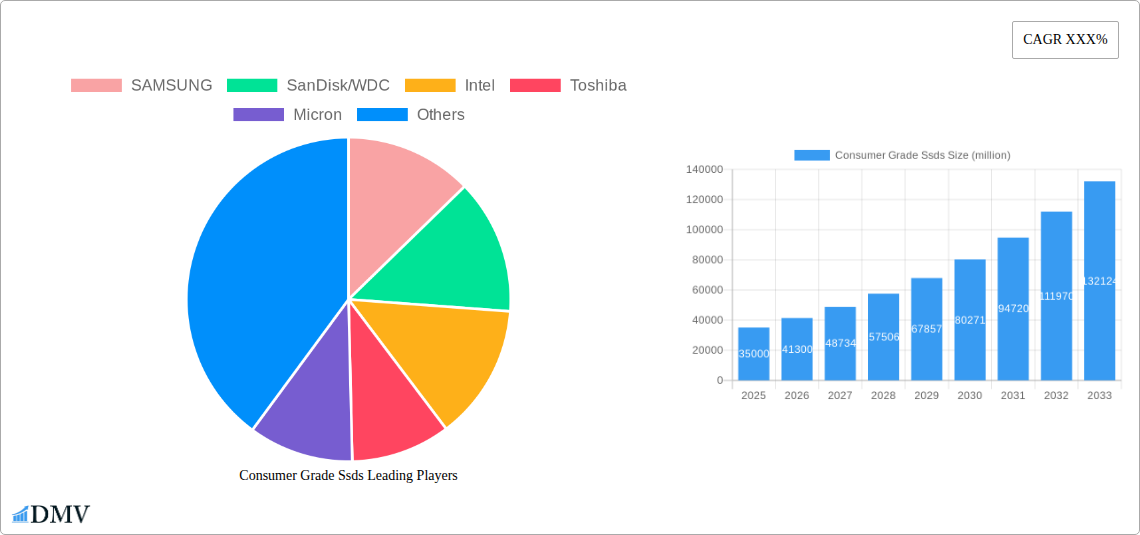
Consumer Grade Ssds Market Size (In Billion)
Despite the optimistic outlook, certain factors could temper the market's trajectory. The inherent lifespan limitations of NAND flash memory, although improving with technological advancements, can still be a concern for some consumers seeking long-term archival solutions. Furthermore, the competitive landscape is intense, with major players like SAMSUNG, SanDisk/WDC, and Intel constantly innovating and engaging in price wars, which can impact profit margins. Supply chain disruptions, geopolitical factors affecting component availability, and fluctuating raw material costs also present potential challenges. Nevertheless, the overarching trend towards performance-driven computing, the continuous miniaturization of devices, and the development of new applications leveraging high-speed storage will continue to propel the consumer-grade SSD market forward. The introduction of new form factors and capacities, particularly in the higher TB ranges, will cater to evolving consumer needs and reinforce the market's upward momentum.
Consumer Grade Ssds Company Market Share
This comprehensive report delves into the dynamic Consumer Grade SSDs market, providing an in-depth analysis of its current landscape and future trajectory. Covering the Study Period: 2019–2033, with a Base Year: 2025 and Forecast Period: 2025–2033, this research meticulously examines industry developments, market trends, and growth drivers shaping the solid-state drive (SSD) industry. Our analysis encompasses key companies like SAMSUNG, SanDisk/WDC, Intel, Toshiba, Micron, SK Hynix, Kingston, Lite-On, Transcend, and ADATA, offering a granular understanding of their market positioning and strategies.
Consumer Grade Ssds Market Composition & Trends
The Consumer Grade SSDs market exhibits a moderately concentrated landscape, driven by continuous technological innovation and evolving end-user profiles. Key companies are investing heavily in R&D to enhance performance, capacity, and affordability, setting new benchmarks for storage solutions. The regulatory environment, while largely permissive, is increasingly focused on data security and environmental compliance. Substitute products, primarily HDDs, continue to lose market share due to SSDs' superior speed, durability, and energy efficiency. M&A activities, such as strategic partnerships and acquisitions valued in the hundreds of millions, are reshaping the competitive arena, with deal values reaching over $100 million in recent years. The market is characterized by a robust ecosystem of manufacturers, component suppliers, and distributors, all contributing to its steady expansion.
- Market Share Distribution: Leading players command significant shares, with SAMSUNG and SanDisk/WDC consistently at the forefront.
- Innovation Catalysts: NAND flash technology advancements, controller innovations, and interface upgrades (e.g., PCIe 5.0) are key drivers.
- M&A Activities: Strategic acquisitions aim to consolidate market share, acquire new technologies, and expand geographical reach, with an estimated cumulative deal value of $500 million over the Historical Period: 2019–2024.
Consumer Grade Ssds Industry Evolution
The Consumer Grade SSDs industry has witnessed an unprecedented evolution, transforming digital storage from a bottleneck to a performance enabler. Over the Study Period: 2019–2033, the market has experienced remarkable growth, driven by the relentless pursuit of faster data access and increased storage capacities. The Historical Period: 2019–2024 alone saw a compound annual growth rate (CAGR) of approximately 25%, with the Estimated Year: 2025 projected to reach a market size of $50 billion. This upward trajectory is underpinned by significant technological advancements in NAND flash memory, controller architecture, and interface technologies. The transition from SATA to NVMe interfaces has been a pivotal development, offering manifold improvements in read/write speeds, leading to an adoption rate of over 70% in new devices by 2024. Shifting consumer demands, fueled by the proliferation of data-intensive applications, high-resolution media, and demanding gaming experiences, have further accelerated this evolution. The increasing adoption of SSDs in mainstream devices, including laptops and mobile phones, reflects a fundamental shift in user expectations for performance and responsiveness. Furthermore, the development of QLC and TLC NAND technologies has enabled higher density and more cost-effective storage solutions, making SSDs accessible to a broader consumer base. The industry is poised for continued innovation, with emerging technologies like PCIe 6.0 and further advancements in 3D NAND promising even greater performance gains and capacity expansions in the Forecast Period: 2025–2033.
Leading Regions, Countries, or Segments in Consumer Grade Ssds
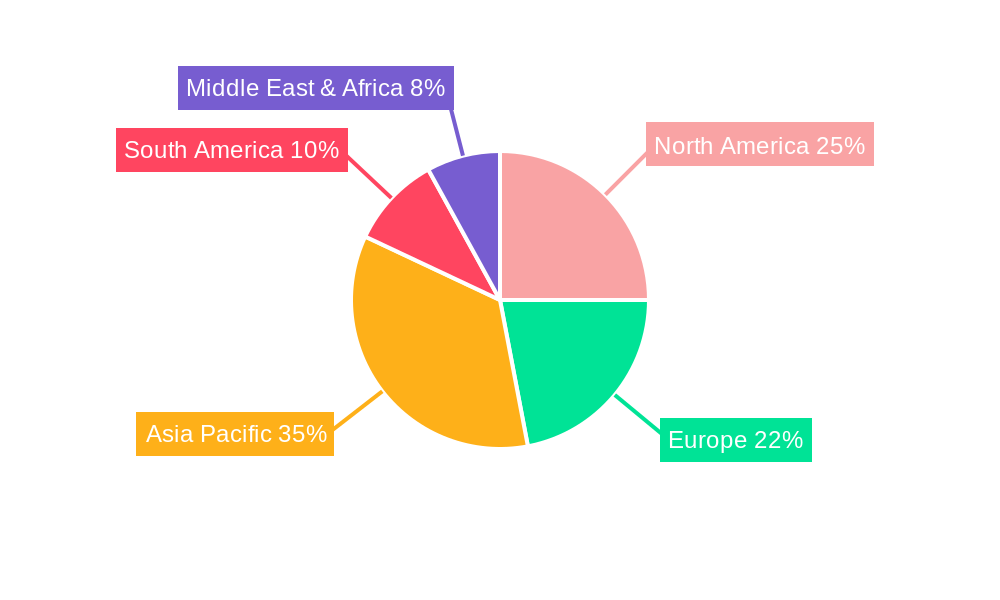
The dominance within the Consumer Grade SSDs market is intricately linked to regional technological adoption, manufacturing prowess, and consumer demand patterns. North America and Asia-Pacific stand out as leading regions, driven by robust PC and laptop penetration, burgeoning gaming communities, and a high concentration of technology enthusiasts.
- Dominant Application Segment: Desktop PCs and Laptops collectively represent the largest application segments, accounting for over 65% of the total market share in 2024. This dominance is fueled by continuous hardware upgrades, the demand for faster boot times and application loading, and the increasing popularity of mobile computing.
- Desktop PCs: Essential for productivity, gaming, and content creation, desktops are a primary market for high-capacity and high-performance SSDs.
- Laptops: The growing trend towards ultraportable and powerful laptops makes SSDs a crucial component for enhancing user experience and battery life.
- Dominant Type Segment: The 500GB-1TB and 1-2TB capacity segments are experiencing the most significant growth, reflecting a consumer preference for substantial storage without compromising performance. These segments captured approximately 55% of the market in 2024.
- 500GB-1TB: This segment strikes a balance between affordability and capacity, catering to a vast majority of mainstream users and gamers.
- 1-2TB: Increasingly becoming the new standard for power users, gamers, and content creators, offering ample space for large game libraries and extensive media collections.
- Key Drivers:
- Investment Trends: Significant investments in semiconductor manufacturing facilities within Asia-Pacific countries like South Korea and Taiwan boost production capacity and drive down costs.
- Regulatory Support: Government initiatives promoting technological innovation and digital infrastructure development in regions like North America and Europe indirectly benefit the SSD market.
- Consumer Adoption Rates: Higher disposable incomes and widespread access to high-speed internet in developed economies accelerate the adoption of advanced storage solutions.
- Gaming Console Dominance: The integration of SSDs in latest-generation gaming consoles (e.g., PlayStation 5, Xbox Series X/S) has created a substantial demand surge in the gaming segment, contributing over 15% of the market share.
Consumer Grade Ssds Product Innovations
Product innovation in Consumer Grade SSDs is relentlessly focused on enhancing speed, capacity, and endurance. Leading manufacturers are pushing the boundaries with PCIe 5.0 interfaces, delivering sequential read/write speeds exceeding 10,000 MB/s, a significant leap from previous generations. Innovations in 3D NAND technology, such as advancements in layering and cell structure, allow for greater data density and improved cost-effectiveness, enabling the development of SSDs with capacities above 4TB for consumer applications. Furthermore, advanced controllers incorporating AI-driven wear-leveling algorithms and robust error correction codes (ECC) are extending the lifespan and reliability of these drives. Unique selling propositions often revolve around specialized gaming SSDs offering optimized firmware for rapid game loading and reduced latency, as well as ultra-portable SSDs designed for mobile professionals.
Propelling Factors for Consumer Grade Ssds Growth
The Consumer Grade SSDs market is propelled by a confluence of powerful factors. Technological advancements, particularly in NAND flash density and interface speeds (e.g., NVMe, PCIe 5.0), are consistently delivering higher performance at more accessible price points. The increasing demand for faster computing experiences across all device segments, from ultraportable laptops to high-performance gaming consoles, is a primary catalyst. Economic factors, including rising disposable incomes and the growing digital economy, enable consumers to invest in premium storage. Furthermore, the widespread adoption of data-intensive applications like 8K video editing, virtual reality, and advanced gaming titles necessitates the speed and capacity only SSDs can reliably provide, further fueling market growth.
Obstacles in the Consumer Grade Ssds Market
Despite its robust growth, the Consumer Grade SSDs market faces several obstacles. Supply chain disruptions, exacerbated by geopolitical tensions and component shortages, can impact production volumes and lead to price volatility, with potential cost increases of up to 10% on certain components. Intense competitive pressures among numerous manufacturers can lead to aggressive pricing strategies, squeezing profit margins for some players. While NAND flash prices have declined significantly, the initial cost of high-capacity SSDs can still be a barrier for budget-conscious consumers compared to traditional HDDs, representing a 50-100% price premium for equivalent capacities. Evolving regulatory challenges related to data privacy and e-waste management also require ongoing adaptation and investment from manufacturers.
Future Opportunities in Consumer Grade Ssds
The future of the Consumer Grade SSDs market is replete with promising opportunities. The ongoing expansion of the cloud computing ecosystem and the increasing demand for edge computing solutions will drive the need for faster and more efficient storage. The persistent growth of the gaming industry, coupled with the increasing popularity of AAA titles, presents a substantial opportunity for high-performance SSDs. Emerging markets in developing economies, as smartphone and PC penetration continues to rise, offer significant untapped potential. Furthermore, advancements in new memory technologies, such as 3D XPoint and next-generation NAND architectures, promise to unlock unprecedented performance and capacity gains, opening up new application frontiers. The integration of AI and machine learning capabilities within SSD controllers for enhanced predictive maintenance and optimized data management is another avenue for future growth.
Major Players in the Consumer Grade Ssds Ecosystem
- SAMSUNG
- SanDisk/WDC
- Intel
- Toshiba
- Micron
- SK Hynix
- Kingston
- Lite-On
- Transcend
- ADATA
Key Developments in Consumer Grade Ssds Industry
- 2023: Launch of PCIe 5.0 SSDs with sequential read/write speeds exceeding 10,000 MB/s, enabling significant performance boosts for gaming and content creation.
- 2023: Increased adoption of TLC and QLC NAND flash technologies, leading to higher density and more cost-effective SSD solutions for consumers.
- 2022: Significant investments by major manufacturers in expanding 3D NAND production capacity, addressing supply chain bottlenecks.
- 2021: Integration of SSDs as standard components in the latest generation gaming consoles, driving substantial market demand.
- 2020: Rise in remote work and online learning, increasing demand for reliable and fast storage solutions in laptops and desktops.
- 2019: Continued decline in average selling prices (ASPs) for SSDs, making them more accessible to a wider consumer base.
Strategic Consumer Grade Ssds Market Forecast
The Consumer Grade SSDs market is projected for sustained and robust growth, driven by ongoing technological advancements and escalating consumer demand for faster, more responsive computing experiences. The increasing adoption of high-capacity SSDs in gaming, content creation, and everyday computing tasks will be a significant growth catalyst. The continued innovation in NAND flash technology and interface speeds, such as the rollout of PCIe 6.0 in the coming years, will further enhance performance and expand market potential, ensuring SSDs remain indispensable for modern digital life. The forecast indicates a market size projected to reach over $100 billion by 2033.
Consumer Grade Ssds Segmentation
-
1. Application
- 1.1. Desktop PC
- 1.2. Laptops
- 1.3. Mobile Phone
- 1.4. Cameras
- 1.5. Gaming Consoles
- 1.6. Tablet
- 1.7. Others
-
2. Type
- 2.1. Below 120GB
- 2.2. 120-320GB
- 2.3. 320-500GB
- 2.4. 500GB-1TB
- 2.5. 1-2TB
- 2.6. Above 2TB
Consumer Grade Ssds Segmentation By Geography
-
1. North America
- 1.1. United States
- 1.2. Canada
- 1.3. Mexico
-
2. South America
- 2.1. Brazil
- 2.2. Argentina
- 2.3. Rest of South America
-
3. Europe
- 3.1. United Kingdom
- 3.2. Germany
- 3.3. France
- 3.4. Italy
- 3.5. Spain
- 3.6. Russia
- 3.7. Benelux
- 3.8. Nordics
- 3.9. Rest of Europe
-
4. Middle East & Africa
- 4.1. Turkey
- 4.2. Israel
- 4.3. GCC
- 4.4. North Africa
- 4.5. South Africa
- 4.6. Rest of Middle East & Africa
-
5. Asia Pacific
- 5.1. China
- 5.2. India
- 5.3. Japan
- 5.4. South Korea
- 5.5. ASEAN
- 5.6. Oceania
- 5.7. Rest of Asia Pacific
Consumer Grade Ssds Regional Market Share
Geographic Coverage of Consumer Grade Ssds
Consumer Grade Ssds REPORT HIGHLIGHTS
| Aspects | Details |
|---|---|
| Study Period | 2020-2034 |
| Base Year | 2025 |
| Estimated Year | 2026 |
| Forecast Period | 2026-2034 |
| Historical Period | 2020-2025 |
| Growth Rate | CAGR of XXX% from 2020-2034 |
| Segmentation |
|
Table of Contents
- 1. Introduction
- 1.1. Research Scope
- 1.2. Market Segmentation
- 1.3. Research Objective
- 1.4. Definitions and Assumptions
- 2. Executive Summary
- 2.1. Market Snapshot
- 3. Market Dynamics
- 3.1. Market Drivers
- 3.2. Market Restrains
- 3.3. Market Trends
- 3.4. Market Opportunities
- 4. Market Factor Analysis
- 4.1. Porters Five Forces
- 4.1.1. Bargaining Power of Suppliers
- 4.1.2. Bargaining Power of Buyers
- 4.1.3. Threat of New Entrants
- 4.1.4. Threat of Substitutes
- 4.1.5. Competitive Rivalry
- 4.2. PESTEL analysis
- 4.3. BCG Analysis
- 4.3.1. Stars (High Growth, High Market Share)
- 4.3.2. Cash Cows (Low Growth, High Market Share)
- 4.3.3. Question Mark (High Growth, Low Market Share)
- 4.3.4. Dogs (Low Growth, Low Market Share)
- 4.4. Ansoff Matrix Analysis
- 4.5. Supply Chain Analysis
- 4.6. Regulatory Landscape
- 4.7. Current Market Potential and Opportunity Assessment (TAM–SAM–SOM Framework)
- 4.8. DMV Analyst Note
- 4.1. Porters Five Forces
- 5. Market Analysis, Insights and Forecast 2021-2033
- 5.1. Market Analysis, Insights and Forecast - by Application
- 5.1.1. Desktop PC
- 5.1.2. Laptops
- 5.1.3. Mobile Phone
- 5.1.4. Cameras
- 5.1.5. Gaming Consoles
- 5.1.6. Tablet
- 5.1.7. Others
- 5.2. Market Analysis, Insights and Forecast - by Type
- 5.2.1. Below 120GB
- 5.2.2. 120-320GB
- 5.2.3. 320-500GB
- 5.2.4. 500GB-1TB
- 5.2.5. 1-2TB
- 5.2.6. Above 2TB
- 5.3. Market Analysis, Insights and Forecast - by Region
- 5.3.1. North America
- 5.3.2. South America
- 5.3.3. Europe
- 5.3.4. Middle East & Africa
- 5.3.5. Asia Pacific
- 5.1. Market Analysis, Insights and Forecast - by Application
- 6. Global Consumer Grade Ssds Analysis, Insights and Forecast, 2021-2033
- 6.1. Market Analysis, Insights and Forecast - by Application
- 6.1.1. Desktop PC
- 6.1.2. Laptops
- 6.1.3. Mobile Phone
- 6.1.4. Cameras
- 6.1.5. Gaming Consoles
- 6.1.6. Tablet
- 6.1.7. Others
- 6.2. Market Analysis, Insights and Forecast - by Type
- 6.2.1. Below 120GB
- 6.2.2. 120-320GB
- 6.2.3. 320-500GB
- 6.2.4. 500GB-1TB
- 6.2.5. 1-2TB
- 6.2.6. Above 2TB
- 6.1. Market Analysis, Insights and Forecast - by Application
- 7. North America Consumer Grade Ssds Analysis, Insights and Forecast, 2020-2032
- 7.1. Market Analysis, Insights and Forecast - by Application
- 7.1.1. Desktop PC
- 7.1.2. Laptops
- 7.1.3. Mobile Phone
- 7.1.4. Cameras
- 7.1.5. Gaming Consoles
- 7.1.6. Tablet
- 7.1.7. Others
- 7.2. Market Analysis, Insights and Forecast - by Type
- 7.2.1. Below 120GB
- 7.2.2. 120-320GB
- 7.2.3. 320-500GB
- 7.2.4. 500GB-1TB
- 7.2.5. 1-2TB
- 7.2.6. Above 2TB
- 7.1. Market Analysis, Insights and Forecast - by Application
- 8. South America Consumer Grade Ssds Analysis, Insights and Forecast, 2020-2032
- 8.1. Market Analysis, Insights and Forecast - by Application
- 8.1.1. Desktop PC
- 8.1.2. Laptops
- 8.1.3. Mobile Phone
- 8.1.4. Cameras
- 8.1.5. Gaming Consoles
- 8.1.6. Tablet
- 8.1.7. Others
- 8.2. Market Analysis, Insights and Forecast - by Type
- 8.2.1. Below 120GB
- 8.2.2. 120-320GB
- 8.2.3. 320-500GB
- 8.2.4. 500GB-1TB
- 8.2.5. 1-2TB
- 8.2.6. Above 2TB
- 8.1. Market Analysis, Insights and Forecast - by Application
- 9. Europe Consumer Grade Ssds Analysis, Insights and Forecast, 2020-2032
- 9.1. Market Analysis, Insights and Forecast - by Application
- 9.1.1. Desktop PC
- 9.1.2. Laptops
- 9.1.3. Mobile Phone
- 9.1.4. Cameras
- 9.1.5. Gaming Consoles
- 9.1.6. Tablet
- 9.1.7. Others
- 9.2. Market Analysis, Insights and Forecast - by Type
- 9.2.1. Below 120GB
- 9.2.2. 120-320GB
- 9.2.3. 320-500GB
- 9.2.4. 500GB-1TB
- 9.2.5. 1-2TB
- 9.2.6. Above 2TB
- 9.1. Market Analysis, Insights and Forecast - by Application
- 10. Middle East & Africa Consumer Grade Ssds Analysis, Insights and Forecast, 2020-2032
- 10.1. Market Analysis, Insights and Forecast - by Application
- 10.1.1. Desktop PC
- 10.1.2. Laptops
- 10.1.3. Mobile Phone
- 10.1.4. Cameras
- 10.1.5. Gaming Consoles
- 10.1.6. Tablet
- 10.1.7. Others
- 10.2. Market Analysis, Insights and Forecast - by Type
- 10.2.1. Below 120GB
- 10.2.2. 120-320GB
- 10.2.3. 320-500GB
- 10.2.4. 500GB-1TB
- 10.2.5. 1-2TB
- 10.2.6. Above 2TB
- 10.1. Market Analysis, Insights and Forecast - by Application
- 11. Asia Pacific Consumer Grade Ssds Analysis, Insights and Forecast, 2020-2032
- 11.1. Market Analysis, Insights and Forecast - by Application
- 11.1.1. Desktop PC
- 11.1.2. Laptops
- 11.1.3. Mobile Phone
- 11.1.4. Cameras
- 11.1.5. Gaming Consoles
- 11.1.6. Tablet
- 11.1.7. Others
- 11.2. Market Analysis, Insights and Forecast - by Type
- 11.2.1. Below 120GB
- 11.2.2. 120-320GB
- 11.2.3. 320-500GB
- 11.2.4. 500GB-1TB
- 11.2.5. 1-2TB
- 11.2.6. Above 2TB
- 11.1. Market Analysis, Insights and Forecast - by Application
- 12. Competitive Analysis
- 12.1. Company Profiles
- 12.1.1 SAMSUNG
- 12.1.1.1. Company Overview
- 12.1.1.2. Products
- 12.1.1.3. Company Financials
- 12.1.1.4. SWOT Analysis
- 12.1.2 SanDisk/WDC
- 12.1.2.1. Company Overview
- 12.1.2.2. Products
- 12.1.2.3. Company Financials
- 12.1.2.4. SWOT Analysis
- 12.1.3 Intel
- 12.1.3.1. Company Overview
- 12.1.3.2. Products
- 12.1.3.3. Company Financials
- 12.1.3.4. SWOT Analysis
- 12.1.4 Toshiba
- 12.1.4.1. Company Overview
- 12.1.4.2. Products
- 12.1.4.3. Company Financials
- 12.1.4.4. SWOT Analysis
- 12.1.5 Micron
- 12.1.5.1. Company Overview
- 12.1.5.2. Products
- 12.1.5.3. Company Financials
- 12.1.5.4. SWOT Analysis
- 12.1.6 SK Hynix
- 12.1.6.1. Company Overview
- 12.1.6.2. Products
- 12.1.6.3. Company Financials
- 12.1.6.4. SWOT Analysis
- 12.1.7 Kingston
- 12.1.7.1. Company Overview
- 12.1.7.2. Products
- 12.1.7.3. Company Financials
- 12.1.7.4. SWOT Analysis
- 12.1.8 Lite-On
- 12.1.8.1. Company Overview
- 12.1.8.2. Products
- 12.1.8.3. Company Financials
- 12.1.8.4. SWOT Analysis
- 12.1.9 Transcend
- 12.1.9.1. Company Overview
- 12.1.9.2. Products
- 12.1.9.3. Company Financials
- 12.1.9.4. SWOT Analysis
- 12.1.10 ADATA
- 12.1.10.1. Company Overview
- 12.1.10.2. Products
- 12.1.10.3. Company Financials
- 12.1.10.4. SWOT Analysis
- 12.1.1 SAMSUNG
- 12.2. Market Entropy
- 12.2.1 Company's Key Areas Served
- 12.2.2 Recent Developments
- 12.3. Company Market Share Analysis 2025
- 12.3.1 Top 5 Companies Market Share Analysis
- 12.3.2 Top 3 Companies Market Share Analysis
- 12.4. List of Potential Customers
- 13. Research Methodology
List of Figures
- Figure 1: Global Consumer Grade Ssds Revenue Breakdown (million, %) by Region 2025 & 2033
- Figure 2: Global Consumer Grade Ssds Volume Breakdown (K, %) by Region 2025 & 2033
- Figure 3: North America Consumer Grade Ssds Revenue (million), by Application 2025 & 2033
- Figure 4: North America Consumer Grade Ssds Volume (K), by Application 2025 & 2033
- Figure 5: North America Consumer Grade Ssds Revenue Share (%), by Application 2025 & 2033
- Figure 6: North America Consumer Grade Ssds Volume Share (%), by Application 2025 & 2033
- Figure 7: North America Consumer Grade Ssds Revenue (million), by Type 2025 & 2033
- Figure 8: North America Consumer Grade Ssds Volume (K), by Type 2025 & 2033
- Figure 9: North America Consumer Grade Ssds Revenue Share (%), by Type 2025 & 2033
- Figure 10: North America Consumer Grade Ssds Volume Share (%), by Type 2025 & 2033
- Figure 11: North America Consumer Grade Ssds Revenue (million), by Country 2025 & 2033
- Figure 12: North America Consumer Grade Ssds Volume (K), by Country 2025 & 2033
- Figure 13: North America Consumer Grade Ssds Revenue Share (%), by Country 2025 & 2033
- Figure 14: North America Consumer Grade Ssds Volume Share (%), by Country 2025 & 2033
- Figure 15: South America Consumer Grade Ssds Revenue (million), by Application 2025 & 2033
- Figure 16: South America Consumer Grade Ssds Volume (K), by Application 2025 & 2033
- Figure 17: South America Consumer Grade Ssds Revenue Share (%), by Application 2025 & 2033
- Figure 18: South America Consumer Grade Ssds Volume Share (%), by Application 2025 & 2033
- Figure 19: South America Consumer Grade Ssds Revenue (million), by Type 2025 & 2033
- Figure 20: South America Consumer Grade Ssds Volume (K), by Type 2025 & 2033
- Figure 21: South America Consumer Grade Ssds Revenue Share (%), by Type 2025 & 2033
- Figure 22: South America Consumer Grade Ssds Volume Share (%), by Type 2025 & 2033
- Figure 23: South America Consumer Grade Ssds Revenue (million), by Country 2025 & 2033
- Figure 24: South America Consumer Grade Ssds Volume (K), by Country 2025 & 2033
- Figure 25: South America Consumer Grade Ssds Revenue Share (%), by Country 2025 & 2033
- Figure 26: South America Consumer Grade Ssds Volume Share (%), by Country 2025 & 2033
- Figure 27: Europe Consumer Grade Ssds Revenue (million), by Application 2025 & 2033
- Figure 28: Europe Consumer Grade Ssds Volume (K), by Application 2025 & 2033
- Figure 29: Europe Consumer Grade Ssds Revenue Share (%), by Application 2025 & 2033
- Figure 30: Europe Consumer Grade Ssds Volume Share (%), by Application 2025 & 2033
- Figure 31: Europe Consumer Grade Ssds Revenue (million), by Type 2025 & 2033
- Figure 32: Europe Consumer Grade Ssds Volume (K), by Type 2025 & 2033
- Figure 33: Europe Consumer Grade Ssds Revenue Share (%), by Type 2025 & 2033
- Figure 34: Europe Consumer Grade Ssds Volume Share (%), by Type 2025 & 2033
- Figure 35: Europe Consumer Grade Ssds Revenue (million), by Country 2025 & 2033
- Figure 36: Europe Consumer Grade Ssds Volume (K), by Country 2025 & 2033
- Figure 37: Europe Consumer Grade Ssds Revenue Share (%), by Country 2025 & 2033
- Figure 38: Europe Consumer Grade Ssds Volume Share (%), by Country 2025 & 2033
- Figure 39: Middle East & Africa Consumer Grade Ssds Revenue (million), by Application 2025 & 2033
- Figure 40: Middle East & Africa Consumer Grade Ssds Volume (K), by Application 2025 & 2033
- Figure 41: Middle East & Africa Consumer Grade Ssds Revenue Share (%), by Application 2025 & 2033
- Figure 42: Middle East & Africa Consumer Grade Ssds Volume Share (%), by Application 2025 & 2033
- Figure 43: Middle East & Africa Consumer Grade Ssds Revenue (million), by Type 2025 & 2033
- Figure 44: Middle East & Africa Consumer Grade Ssds Volume (K), by Type 2025 & 2033
- Figure 45: Middle East & Africa Consumer Grade Ssds Revenue Share (%), by Type 2025 & 2033
- Figure 46: Middle East & Africa Consumer Grade Ssds Volume Share (%), by Type 2025 & 2033
- Figure 47: Middle East & Africa Consumer Grade Ssds Revenue (million), by Country 2025 & 2033
- Figure 48: Middle East & Africa Consumer Grade Ssds Volume (K), by Country 2025 & 2033
- Figure 49: Middle East & Africa Consumer Grade Ssds Revenue Share (%), by Country 2025 & 2033
- Figure 50: Middle East & Africa Consumer Grade Ssds Volume Share (%), by Country 2025 & 2033
- Figure 51: Asia Pacific Consumer Grade Ssds Revenue (million), by Application 2025 & 2033
- Figure 52: Asia Pacific Consumer Grade Ssds Volume (K), by Application 2025 & 2033
- Figure 53: Asia Pacific Consumer Grade Ssds Revenue Share (%), by Application 2025 & 2033
- Figure 54: Asia Pacific Consumer Grade Ssds Volume Share (%), by Application 2025 & 2033
- Figure 55: Asia Pacific Consumer Grade Ssds Revenue (million), by Type 2025 & 2033
- Figure 56: Asia Pacific Consumer Grade Ssds Volume (K), by Type 2025 & 2033
- Figure 57: Asia Pacific Consumer Grade Ssds Revenue Share (%), by Type 2025 & 2033
- Figure 58: Asia Pacific Consumer Grade Ssds Volume Share (%), by Type 2025 & 2033
- Figure 59: Asia Pacific Consumer Grade Ssds Revenue (million), by Country 2025 & 2033
- Figure 60: Asia Pacific Consumer Grade Ssds Volume (K), by Country 2025 & 2033
- Figure 61: Asia Pacific Consumer Grade Ssds Revenue Share (%), by Country 2025 & 2033
- Figure 62: Asia Pacific Consumer Grade Ssds Volume Share (%), by Country 2025 & 2033
List of Tables
- Table 1: Global Consumer Grade Ssds Revenue million Forecast, by Application 2020 & 2033
- Table 2: Global Consumer Grade Ssds Volume K Forecast, by Application 2020 & 2033
- Table 3: Global Consumer Grade Ssds Revenue million Forecast, by Type 2020 & 2033
- Table 4: Global Consumer Grade Ssds Volume K Forecast, by Type 2020 & 2033
- Table 5: Global Consumer Grade Ssds Revenue million Forecast, by Region 2020 & 2033
- Table 6: Global Consumer Grade Ssds Volume K Forecast, by Region 2020 & 2033
- Table 7: Global Consumer Grade Ssds Revenue million Forecast, by Application 2020 & 2033
- Table 8: Global Consumer Grade Ssds Volume K Forecast, by Application 2020 & 2033
- Table 9: Global Consumer Grade Ssds Revenue million Forecast, by Type 2020 & 2033
- Table 10: Global Consumer Grade Ssds Volume K Forecast, by Type 2020 & 2033
- Table 11: Global Consumer Grade Ssds Revenue million Forecast, by Country 2020 & 2033
- Table 12: Global Consumer Grade Ssds Volume K Forecast, by Country 2020 & 2033
- Table 13: United States Consumer Grade Ssds Revenue (million) Forecast, by Application 2020 & 2033
- Table 14: United States Consumer Grade Ssds Volume (K) Forecast, by Application 2020 & 2033
- Table 15: Canada Consumer Grade Ssds Revenue (million) Forecast, by Application 2020 & 2033
- Table 16: Canada Consumer Grade Ssds Volume (K) Forecast, by Application 2020 & 2033
- Table 17: Mexico Consumer Grade Ssds Revenue (million) Forecast, by Application 2020 & 2033
- Table 18: Mexico Consumer Grade Ssds Volume (K) Forecast, by Application 2020 & 2033
- Table 19: Global Consumer Grade Ssds Revenue million Forecast, by Application 2020 & 2033
- Table 20: Global Consumer Grade Ssds Volume K Forecast, by Application 2020 & 2033
- Table 21: Global Consumer Grade Ssds Revenue million Forecast, by Type 2020 & 2033
- Table 22: Global Consumer Grade Ssds Volume K Forecast, by Type 2020 & 2033
- Table 23: Global Consumer Grade Ssds Revenue million Forecast, by Country 2020 & 2033
- Table 24: Global Consumer Grade Ssds Volume K Forecast, by Country 2020 & 2033
- Table 25: Brazil Consumer Grade Ssds Revenue (million) Forecast, by Application 2020 & 2033
- Table 26: Brazil Consumer Grade Ssds Volume (K) Forecast, by Application 2020 & 2033
- Table 27: Argentina Consumer Grade Ssds Revenue (million) Forecast, by Application 2020 & 2033
- Table 28: Argentina Consumer Grade Ssds Volume (K) Forecast, by Application 2020 & 2033
- Table 29: Rest of South America Consumer Grade Ssds Revenue (million) Forecast, by Application 2020 & 2033
- Table 30: Rest of South America Consumer Grade Ssds Volume (K) Forecast, by Application 2020 & 2033
- Table 31: Global Consumer Grade Ssds Revenue million Forecast, by Application 2020 & 2033
- Table 32: Global Consumer Grade Ssds Volume K Forecast, by Application 2020 & 2033
- Table 33: Global Consumer Grade Ssds Revenue million Forecast, by Type 2020 & 2033
- Table 34: Global Consumer Grade Ssds Volume K Forecast, by Type 2020 & 2033
- Table 35: Global Consumer Grade Ssds Revenue million Forecast, by Country 2020 & 2033
- Table 36: Global Consumer Grade Ssds Volume K Forecast, by Country 2020 & 2033
- Table 37: United Kingdom Consumer Grade Ssds Revenue (million) Forecast, by Application 2020 & 2033
- Table 38: United Kingdom Consumer Grade Ssds Volume (K) Forecast, by Application 2020 & 2033
- Table 39: Germany Consumer Grade Ssds Revenue (million) Forecast, by Application 2020 & 2033
- Table 40: Germany Consumer Grade Ssds Volume (K) Forecast, by Application 2020 & 2033
- Table 41: France Consumer Grade Ssds Revenue (million) Forecast, by Application 2020 & 2033
- Table 42: France Consumer Grade Ssds Volume (K) Forecast, by Application 2020 & 2033
- Table 43: Italy Consumer Grade Ssds Revenue (million) Forecast, by Application 2020 & 2033
- Table 44: Italy Consumer Grade Ssds Volume (K) Forecast, by Application 2020 & 2033
- Table 45: Spain Consumer Grade Ssds Revenue (million) Forecast, by Application 2020 & 2033
- Table 46: Spain Consumer Grade Ssds Volume (K) Forecast, by Application 2020 & 2033
- Table 47: Russia Consumer Grade Ssds Revenue (million) Forecast, by Application 2020 & 2033
- Table 48: Russia Consumer Grade Ssds Volume (K) Forecast, by Application 2020 & 2033
- Table 49: Benelux Consumer Grade Ssds Revenue (million) Forecast, by Application 2020 & 2033
- Table 50: Benelux Consumer Grade Ssds Volume (K) Forecast, by Application 2020 & 2033
- Table 51: Nordics Consumer Grade Ssds Revenue (million) Forecast, by Application 2020 & 2033
- Table 52: Nordics Consumer Grade Ssds Volume (K) Forecast, by Application 2020 & 2033
- Table 53: Rest of Europe Consumer Grade Ssds Revenue (million) Forecast, by Application 2020 & 2033
- Table 54: Rest of Europe Consumer Grade Ssds Volume (K) Forecast, by Application 2020 & 2033
- Table 55: Global Consumer Grade Ssds Revenue million Forecast, by Application 2020 & 2033
- Table 56: Global Consumer Grade Ssds Volume K Forecast, by Application 2020 & 2033
- Table 57: Global Consumer Grade Ssds Revenue million Forecast, by Type 2020 & 2033
- Table 58: Global Consumer Grade Ssds Volume K Forecast, by Type 2020 & 2033
- Table 59: Global Consumer Grade Ssds Revenue million Forecast, by Country 2020 & 2033
- Table 60: Global Consumer Grade Ssds Volume K Forecast, by Country 2020 & 2033
- Table 61: Turkey Consumer Grade Ssds Revenue (million) Forecast, by Application 2020 & 2033
- Table 62: Turkey Consumer Grade Ssds Volume (K) Forecast, by Application 2020 & 2033
- Table 63: Israel Consumer Grade Ssds Revenue (million) Forecast, by Application 2020 & 2033
- Table 64: Israel Consumer Grade Ssds Volume (K) Forecast, by Application 2020 & 2033
- Table 65: GCC Consumer Grade Ssds Revenue (million) Forecast, by Application 2020 & 2033
- Table 66: GCC Consumer Grade Ssds Volume (K) Forecast, by Application 2020 & 2033
- Table 67: North Africa Consumer Grade Ssds Revenue (million) Forecast, by Application 2020 & 2033
- Table 68: North Africa Consumer Grade Ssds Volume (K) Forecast, by Application 2020 & 2033
- Table 69: South Africa Consumer Grade Ssds Revenue (million) Forecast, by Application 2020 & 2033
- Table 70: South Africa Consumer Grade Ssds Volume (K) Forecast, by Application 2020 & 2033
- Table 71: Rest of Middle East & Africa Consumer Grade Ssds Revenue (million) Forecast, by Application 2020 & 2033
- Table 72: Rest of Middle East & Africa Consumer Grade Ssds Volume (K) Forecast, by Application 2020 & 2033
- Table 73: Global Consumer Grade Ssds Revenue million Forecast, by Application 2020 & 2033
- Table 74: Global Consumer Grade Ssds Volume K Forecast, by Application 2020 & 2033
- Table 75: Global Consumer Grade Ssds Revenue million Forecast, by Type 2020 & 2033
- Table 76: Global Consumer Grade Ssds Volume K Forecast, by Type 2020 & 2033
- Table 77: Global Consumer Grade Ssds Revenue million Forecast, by Country 2020 & 2033
- Table 78: Global Consumer Grade Ssds Volume K Forecast, by Country 2020 & 2033
- Table 79: China Consumer Grade Ssds Revenue (million) Forecast, by Application 2020 & 2033
- Table 80: China Consumer Grade Ssds Volume (K) Forecast, by Application 2020 & 2033
- Table 81: India Consumer Grade Ssds Revenue (million) Forecast, by Application 2020 & 2033
- Table 82: India Consumer Grade Ssds Volume (K) Forecast, by Application 2020 & 2033
- Table 83: Japan Consumer Grade Ssds Revenue (million) Forecast, by Application 2020 & 2033
- Table 84: Japan Consumer Grade Ssds Volume (K) Forecast, by Application 2020 & 2033
- Table 85: South Korea Consumer Grade Ssds Revenue (million) Forecast, by Application 2020 & 2033
- Table 86: South Korea Consumer Grade Ssds Volume (K) Forecast, by Application 2020 & 2033
- Table 87: ASEAN Consumer Grade Ssds Revenue (million) Forecast, by Application 2020 & 2033
- Table 88: ASEAN Consumer Grade Ssds Volume (K) Forecast, by Application 2020 & 2033
- Table 89: Oceania Consumer Grade Ssds Revenue (million) Forecast, by Application 2020 & 2033
- Table 90: Oceania Consumer Grade Ssds Volume (K) Forecast, by Application 2020 & 2033
- Table 91: Rest of Asia Pacific Consumer Grade Ssds Revenue (million) Forecast, by Application 2020 & 2033
- Table 92: Rest of Asia Pacific Consumer Grade Ssds Volume (K) Forecast, by Application 2020 & 2033
Frequently Asked Questions
1. What is the projected Compound Annual Growth Rate (CAGR) of the Consumer Grade Ssds?
The projected CAGR is approximately XXX%.
2. Which companies are prominent players in the Consumer Grade Ssds?
Key companies in the market include SAMSUNG, SanDisk/WDC, Intel, Toshiba, Micron, SK Hynix, Kingston, Lite-On, Transcend, ADATA.
3. What are the main segments of the Consumer Grade Ssds?
The market segments include Application, Type.
4. Can you provide details about the market size?
The market size is estimated to be USD XXX million as of 2022.
5. What are some drivers contributing to market growth?
N/A
6. What are the notable trends driving market growth?
N/A
7. Are there any restraints impacting market growth?
N/A
8. Can you provide examples of recent developments in the market?
N/A
9. What pricing options are available for accessing the report?
Pricing options include single-user, multi-user, and enterprise licenses priced at USD 3950.00, USD 5925.00, and USD 7900.00 respectively.
10. Is the market size provided in terms of value or volume?
The market size is provided in terms of value, measured in million and volume, measured in K.
11. Are there any specific market keywords associated with the report?
Yes, the market keyword associated with the report is "Consumer Grade Ssds," which aids in identifying and referencing the specific market segment covered.
12. How do I determine which pricing option suits my needs best?
The pricing options vary based on user requirements and access needs. Individual users may opt for single-user licenses, while businesses requiring broader access may choose multi-user or enterprise licenses for cost-effective access to the report.
13. Are there any additional resources or data provided in the Consumer Grade Ssds report?
While the report offers comprehensive insights, it's advisable to review the specific contents or supplementary materials provided to ascertain if additional resources or data are available.
14. How can I stay updated on further developments or reports in the Consumer Grade Ssds?
To stay informed about further developments, trends, and reports in the Consumer Grade Ssds, consider subscribing to industry newsletters, following relevant companies and organizations, or regularly checking reputable industry news sources and publications.
Methodology
Step 1 - Identification of Relevant Samples Size from Population Database


Step 2 - Approaches for Defining Global Market Size (Value, Volume* & Price*)

Note*: In applicable scenarios
Step 3 - Data Sources
Primary Research
- Web Analytics
- Survey Reports
- Research Institute
- Latest Research Reports
- Opinion Leaders
Secondary Research
- Annual Reports
- White Paper
- Latest Press Release
- Industry Association
- Paid Database
- Investor Presentations

Step 4 - Data Triangulation
Involves using different sources of information in order to increase the validity of a study
These sources are likely to be stakeholders in a program - participants, other researchers, program staff, other community members, and so on.
Then we put all data in single framework & apply various statistical tools to find out the dynamic on the market.
During the analysis stage, feedback from the stakeholder groups would be compared to determine areas of agreement as well as areas of divergence