

Key Insights
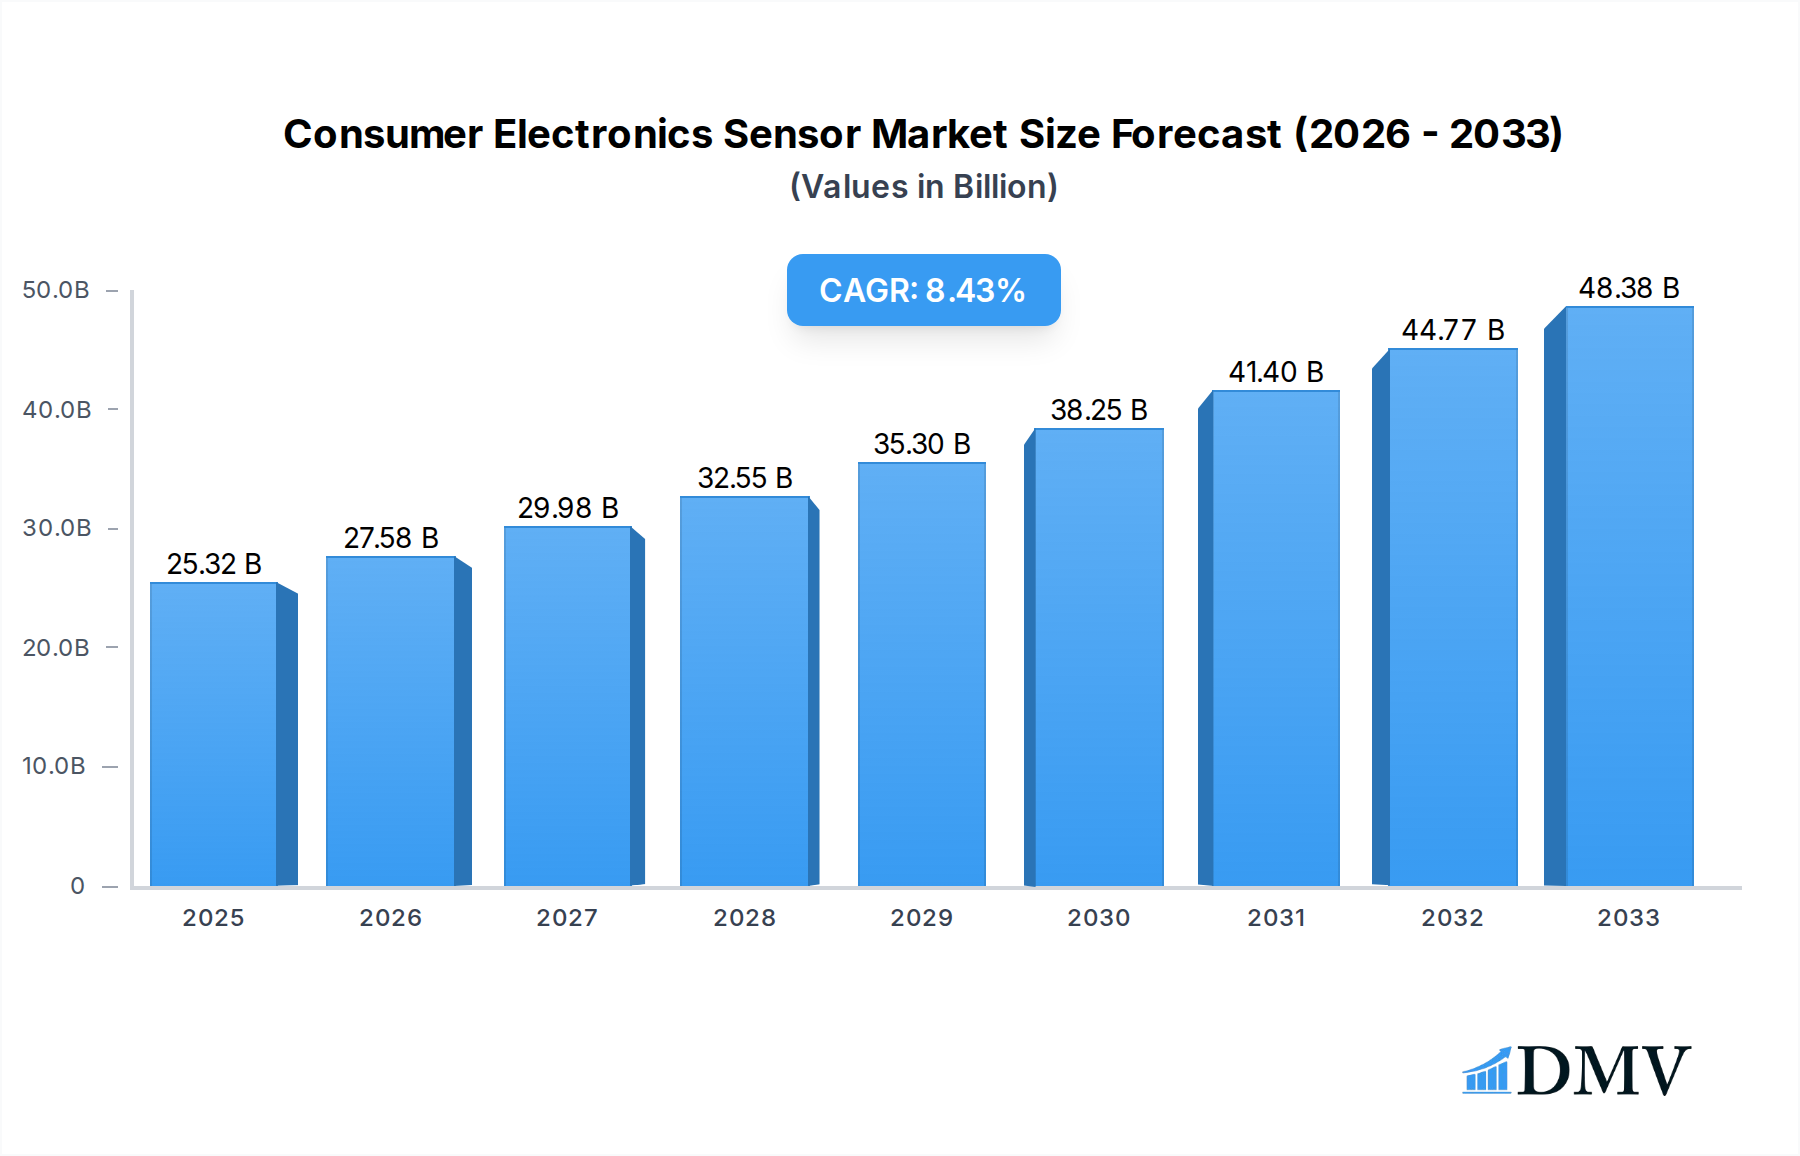
The global Consumer Electronics Sensor market is poised for substantial expansion, with an estimated market size of $25.32 billion in 2025. This growth is driven by the relentless innovation and increasing integration of sensors across a vast spectrum of consumer electronics. The market is projected to experience a robust Compound Annual Growth Rate (CAGR) of 11.7%, indicating a dynamic and highly competitive landscape. Key applications such as communication devices, entertainment systems, and IT hardware are witnessing a surge in demand for advanced sensor technologies. This is fueled by consumer desire for more intuitive, interactive, and personalized experiences. The proliferation of smart devices, the Internet of Things (IoT), and the advancements in augmented reality (AR) and virtual reality (VR) are significant catalysts for this impressive market trajectory. Image sensors, crucial for smartphones and digital cameras, continue to evolve with higher resolutions and enhanced low-light performance. Similarly, motion, temperature, pressure, position, and touch sensors are becoming indispensable for enabling sophisticated functionalities and improving user interfaces in a wide array of gadgets.

Consumer Electronics Sensor Market Size (In Billion)
Looking ahead, the market is expected to maintain its upward momentum, further propelled by emerging technologies and evolving consumer preferences. Factors such as miniaturization, increased power efficiency, and enhanced accuracy of sensors are continuously pushing the boundaries of what consumer electronics can achieve. The competitive landscape is characterized by the presence of major global players, including Sony, Aptina Imaging, Synaptic, Bosch, and STMicroelectronics, who are actively investing in research and development to introduce next-generation sensor solutions. While the market benefits from strong demand and technological advancements, certain restraints, such as the high cost of some advanced sensor technologies and evolving regulatory landscapes, may present challenges. However, the overall outlook remains exceptionally positive, with significant opportunities for innovation and market penetration across various consumer electronics segments and geographic regions.
Consumer Electronics Sensor Company Market Share
Consumer Electronics Sensor Market Composition & Trends
The global Consumer Electronics Sensor market is characterized by dynamic competition and rapid technological evolution, with a projected market size of $150 billion in the base year of 2025, poised to reach $350 billion by 2033. Market concentration is moderate, with key players like Sony, Aptina Imaging, Synaptics, Bosch, STMicroelectronics, Samsung, Panasonic, Toshiba, AMS, NXP Semiconductors, Cypress Semiconductor Corporation, Infineon Technologies AG, Murata Manufacturing Co.,Ltd., Nviso SA, Omron Corporation, and TE Connectivity Ltd. contributing significantly to market share distribution, each holding substantial portions. Innovation catalysts are primarily driven by the relentless demand for smarter, more immersive, and energy-efficient consumer devices. Regulatory landscapes, while evolving, are increasingly focused on data privacy, cybersecurity, and environmental sustainability for electronic components. Substitute products, though present in specific niches, often lack the integrated performance and miniaturization capabilities offered by advanced sensors. End-user profiles range from tech-savvy millennials and Gen Z consumers seeking cutting-edge features to a broader demographic embracing convenience and connectivity in their daily lives. Mergers and acquisitions (M&A) activities are a significant trend, with estimated deal values in the billions of dollars as companies strategically consolidate capabilities and expand their product portfolios to capture emerging market segments. For instance, recent M&A deals, valued at over $5 billion, have focused on acquiring specialized sensor technology and expanding reach into burgeoning application areas.
- Market Share Distribution: Dominated by a mix of established semiconductor giants and specialized sensor manufacturers.
- Innovation Catalysts: Miniaturization, AI integration, power efficiency, and enhanced data processing capabilities.
- Regulatory Landscapes: Growing emphasis on data privacy (e.g., GDPR compliance) and environmental impact of electronic components.
- Substitute Products: Limited impact due to the integrated and specialized nature of modern sensors.
- End-User Profiles: Diverse, from early adopters of smart devices to mainstream consumers seeking enhanced functionality.
- M&A Activities: Strategic acquisitions to gain technological edge and market access, with an estimated cumulative deal value exceeding $10 billion over the historical period.
Consumer Electronics Sensor Industry Evolution
The consumer electronics sensor industry has witnessed a transformative evolution, driven by an unprecedented pace of technological innovation and an insatiable consumer appetite for enhanced functionality and connectivity in their devices. Over the study period (2019–2033), the market has transitioned from basic sensing capabilities to sophisticated, multi-functional sensor arrays that are integral to the user experience. The historical period (2019–2024) saw steady growth, fueled by the burgeoning smartphone market and the nascent stages of the Internet of Things (IoT) ecosystem. During this phase, adoption rates for image sensors and motion sensors in mobile devices, wearables, and smart home appliances surged, laying the groundwork for future expansion. The base year of 2025 represents a pivotal moment, with the market poised for exponential growth, driven by advancements in artificial intelligence (AI) and machine learning (ML) integration with sensor data. Forecasted growth rates are projected to be robust, with a Compound Annual Growth Rate (CAGR) of approximately 12% from 2025 to 2033, translating to a market expansion from an estimated $150 billion in 2025 to over $350 billion by 2033.
Technological advancements have been the primary engine of this evolution. The miniaturization of sensor components has enabled their integration into increasingly compact and diverse devices, from smart textiles to advanced automotive electronics. Developments in MEMS (Micro-Electro-Mechanical Systems) technology have revolutionized the production of low-cost, high-performance sensors like accelerometers, gyroscopes, and pressure sensors. Furthermore, the integration of AI algorithms directly onto sensor chips (edge AI) is enabling real-time data analysis and faster decision-making, enhancing device responsiveness and user experience. Shifting consumer demands have played a crucial role in shaping this trajectory. Consumers now expect seamless interaction, personalized experiences, and proactive functionalities from their electronic devices. This includes demand for enhanced imaging capabilities in smartphones and cameras, advanced health monitoring in wearables, intuitive control in smart home devices, and immersive entertainment experiences in gaming and virtual reality (VR)/augmented reality (AR) systems. The rise of personalized health and wellness tracking, the proliferation of smart home ecosystems, and the demand for more sophisticated gaming and entertainment peripherals are all directly contributing to the increasing integration and sophistication of consumer electronics sensors. The industry's ability to continuously innovate and respond to these evolving consumer expectations will be critical in sustaining its growth trajectory.
Leading Regions, Countries, or Segments in Consumer Electronics Sensor
The global Consumer Electronics Sensor market exhibits distinct leadership across various regions and application segments, driven by a confluence of technological innovation, robust manufacturing capabilities, and escalating consumer adoption. North America, particularly the United States, and Asia-Pacific, spearheaded by China, South Korea, and Japan, are the dominant forces shaping the market landscape. These regions benefit from substantial investments in research and development, the presence of leading technology companies, and a highly receptive consumer base for cutting-edge electronics.
Within the Application segment, Communication applications, encompassing smartphones, tablets, and smart wearables, represent a significant market driver. The relentless demand for enhanced mobile experiences, including superior camera quality, advanced biometric authentication, and seamless connectivity, fuels the adoption of sophisticated image sensors, touch sensors, and motion sensors. The Entertainment segment, encompassing gaming consoles, VR/AR headsets, and smart TVs, is also a major growth area. Advancements in motion sensing for immersive gaming and spatial audio technologies, along with high-resolution image sensors for visual fidelity, are critical here. The IT segment, while broad, includes applications like laptops, desktops, and smart office devices, where sensors contribute to user interface improvements, security features, and energy efficiency.
Examining the Types of sensors, Image Sensors continue to dominate, owing to their omnipresence in smartphones, digital cameras, and the rapidly expanding surveillance and automotive sectors. Their evolution towards higher resolutions, better low-light performance, and advanced computational photography features is a key differentiator. Motion Sensors, including accelerometers and gyroscopes, are indispensable for device orientation, activity tracking, and gesture recognition across a wide spectrum of consumer electronics. Touch Sensors remain vital for intuitive human-machine interfaces, particularly in mobile devices and interactive displays. Emerging applications are also driving growth in Temperature Sensors for smart home climate control and device thermal management, and Pressure Sensors for environmental monitoring and advanced haptic feedback.
- Dominant Regions: North America and Asia-Pacific lead due to strong R&D investment, manufacturing prowess, and high consumer demand.
- Key Application Drivers:
- Communication: Smartphones, wearables, and smart home devices demanding advanced imaging and interaction.
- Entertainment: Gaming, VR/AR, and smart TVs requiring immersive motion sensing and high-fidelity visuals.
- IT: Laptops, desktops, and smart office equipment benefiting from enhanced user experience and security.
- Leading Sensor Types:
- Image Sensors: Crucial for mobile, photography, and emerging automotive applications.
- Motion Sensors: Essential for orientation, activity tracking, and gesture control.
- Touch Sensors: Fundamental for intuitive user interfaces in interactive displays.
- Emerging Sensor Types: Temperature and Pressure sensors gaining traction in smart devices.
- Investment Trends: Significant capital allocation towards AI-enabled sensor development and miniaturization technologies.
- Regulatory Support: Favorable policies in some regions encouraging technological advancement and electronic manufacturing.
Consumer Electronics Sensor Product Innovations
Product innovation in consumer electronics sensors is relentlessly focused on enhancing performance, enabling new functionalities, and improving power efficiency. Leading companies are developing multi-functional sensor modules that integrate several sensing capabilities into a single, compact package, reducing device footprint and cost. Innovations include ultra-low power image sensors for always-on camera applications in wearables and IoT devices, significantly extending battery life. Advanced motion sensors are now incorporating sophisticated AI algorithms for context-aware activity recognition, distinguishing between various physical activities with high accuracy. Touch sensor technology is evolving with the integration of 3D sensing and haptic feedback, creating more immersive and responsive user interactions. Furthermore, the development of highly sensitive environmental sensors, capable of detecting minute changes in temperature, humidity, and air quality, is paving the way for more intelligent and personalized smart home and health monitoring devices. These innovations are not only improving existing product categories but also creating entirely new product categories by enabling unprecedented levels of device intelligence and user interaction.
Propelling Factors for Consumer Electronics Sensor Growth
The sustained growth of the consumer electronics sensor market is propelled by several interconnected factors. The pervasive adoption of the Internet of Things (IoT) is a primary driver, with billions of connected devices requiring various sensors for data acquisition and interaction. The burgeoning demand for advanced imaging capabilities in smartphones and digital cameras, fueled by social media trends and content creation, is another significant catalyst. Furthermore, the rapid expansion of wearable technology and smart home ecosystems, driven by consumer interest in health monitoring, convenience, and automation, directly translates to increased sensor integration. Technological advancements, particularly in miniaturization, power efficiency, and AI integration, are enabling the development of more sophisticated and cost-effective sensors. Economic factors, including rising disposable incomes in emerging markets and increasing consumer spending on electronics, further bolster market expansion. Regulatory shifts supporting smart city initiatives and the development of advanced healthcare technologies also contribute positively.
- IoT Proliferation: Billions of connected devices require diverse sensor inputs for functionality.
- Advanced Imaging Demand: Smartphones and cameras drive innovation in image sensor technology.
- Wearables & Smart Homes: Growing consumer interest in health, convenience, and automation fuels sensor adoption.
- Technological Advancements: Miniaturization, AI integration, and power efficiency enable more capable sensors.
- Economic Growth: Rising disposable incomes in emerging markets boost consumer electronics spending.
Obstacles in the Consumer Electronics Sensor Market
Despite its robust growth, the consumer electronics sensor market faces several obstacles that could hinder its trajectory. Intense competition among a multitude of players leads to pricing pressures and reduced profit margins, particularly for commodity sensor types. Supply chain disruptions, exacerbated by geopolitical events and component shortages, can impact manufacturing timelines and increase costs, as seen with the global semiconductor crunch. The ever-increasing complexity of sensor integration and data processing requires significant investment in research and development, posing a challenge for smaller companies. Evolving regulatory landscapes concerning data privacy and cybersecurity can also create compliance hurdles and necessitate product redesigns. Furthermore, the rapid pace of technological obsolescence requires continuous innovation, making it difficult for companies to recoup their investments in older technologies. The high cost of developing and implementing advanced sensor solutions, particularly those involving AI and machine learning at the edge, can also be a barrier to widespread adoption in certain price-sensitive consumer segments.
- Intense Competition: Leading to pricing pressures and margin erosion.
- Supply Chain Disruptions: Affecting production timelines and increasing costs.
- R&D Investment Demands: High costs associated with continuous innovation.
- Regulatory Compliance: Navigating data privacy and cybersecurity requirements.
- Technological Obsolescence: Rapid product lifecycles necessitate constant updates.
Future Opportunities in Consumer Electronics Sensor
The future of the consumer electronics sensor market is brimming with opportunities, driven by emerging technologies and evolving consumer lifestyles. The integration of AI and machine learning directly onto sensor chips (edge AI) presents a significant avenue for growth, enabling real-time data analysis and personalized device experiences without relying on cloud connectivity. The expansion of the metaverse and augmented reality (AR)/virtual reality (VR) will create a massive demand for highly sophisticated motion, depth, and eye-tracking sensors. The continued growth of the health and wellness sector, with its focus on personalized diagnostics and preventative care, will drive innovation in biosensors and highly accurate physiological monitoring sensors. Furthermore, the increasing adoption of robotics and automation in consumer applications, from smart vacuums to educational robots, will necessitate advanced environmental sensing and navigation capabilities. Sustainability initiatives and the push for energy-efficient electronics also open doors for ultra-low power sensors and smart energy management solutions.
- Edge AI Integration: Enabling real-time, localized data processing for smarter devices.
- AR/VR Expansion: Driving demand for advanced motion, depth, and eye-tracking sensors.
- Health & Wellness Tech: Growth in biosensors and physiological monitoring.
- Consumer Robotics & Automation: Requiring sophisticated environmental and navigation sensors.
- Sustainability Focus: Opportunities in ultra-low power sensors and energy management.
Major Players in the Consumer Electronics Sensor Ecosystem
Sony Aptina Imaging Synaptics Bosch STMicroelectronics Samsung Panasonic Toshiba AMS NXP Semiconductors Cypress Semiconductor Corporation Infineon Technologies AG Murata Manufacturing Co.,Ltd. Nviso SA Omron Corporation TE Connectivity Ltd.
Key Developments in Consumer Electronics Sensor Industry
- 2019: Sony introduces its cutting-edge stacked CMOS image sensor technology, significantly improving low-light performance and dynamic range in smartphones.
- 2020: Bosch launches new miniature pressure sensors designed for smart home and wearable applications, enabling advanced environmental monitoring.
- 2021: Synaptics announces a new generation of in-display fingerprint sensors, offering faster and more reliable biometric authentication.
- 2022: STMicroelectronics unveils advanced MEMS motion sensors with integrated AI capabilities, allowing for more intelligent activity recognition in wearables.
- 2023: Aptina Imaging (now part of ON Semiconductor) showcases next-generation automotive image sensors, enhancing ADAS (Advanced Driver-Assistance Systems) performance.
- 2024: Samsung announces significant advancements in foldable display sensor technology, paving the way for more durable and responsive flexible screens.
- Q1 2025: Infineon Technologies AG expands its portfolio of Hall-effect sensors, critical for various industrial and consumer applications requiring precise magnetic field detection.
- Q2 2025: Murata Manufacturing Co.,Ltd. introduces a new series of ultra-low power temperature sensors optimized for IoT devices, extending battery life.
- Q3 2025: NXP Semiconductors announces enhanced automotive radar sensor technology, improving object detection and collision avoidance systems.
- Q4 2025: TE Connectivity Ltd. launches innovative pressure sensors for advanced medical devices, offering higher accuracy and miniaturization.
Strategic Consumer Electronics Sensor Market Forecast
The strategic forecast for the consumer electronics sensor market indicates a trajectory of robust and sustained growth, driven by an insatiable demand for more intelligent, connected, and immersive consumer experiences. Key growth catalysts include the rapid proliferation of the Internet of Things, the continuous evolution of mobile and wearable technology, and the burgeoning interest in augmented and virtual reality applications. Future opportunities lie in the deep integration of artificial intelligence at the edge, enabling real-time data processing and personalized device functionalities. The increasing focus on health and wellness will spur innovation in biosensors, while advancements in robotics and automation will require more sophisticated environmental perception. The market is poised to reach an impressive $350 billion by 2033, underscoring the critical role of sensors in shaping the future of consumer electronics.
Consumer Electronics Sensor Segmentation
-
1. Application
- 1.1. Communication
- 1.2. Entertainment
- 1.3. IT
-
2. Types
- 2.1. Image Sensor
- 2.2. Motion Sensor
- 2.3. Temperature Sensor
- 2.4. Pressure Sensor
- 2.5. Position Sensor
- 2.6. Touch Sensor
Consumer Electronics Sensor Segmentation By Geography
-
1. North America
- 1.1. United States
- 1.2. Canada
- 1.3. Mexico
-
2. South America
- 2.1. Brazil
- 2.2. Argentina
- 2.3. Rest of South America
-
3. Europe
- 3.1. United Kingdom
- 3.2. Germany
- 3.3. France
- 3.4. Italy
- 3.5. Spain
- 3.6. Russia
- 3.7. Benelux
- 3.8. Nordics
- 3.9. Rest of Europe
-
4. Middle East & Africa
- 4.1. Turkey
- 4.2. Israel
- 4.3. GCC
- 4.4. North Africa
- 4.5. South Africa
- 4.6. Rest of Middle East & Africa
-
5. Asia Pacific
- 5.1. China
- 5.2. India
- 5.3. Japan
- 5.4. South Korea
- 5.5. ASEAN
- 5.6. Oceania
- 5.7. Rest of Asia Pacific
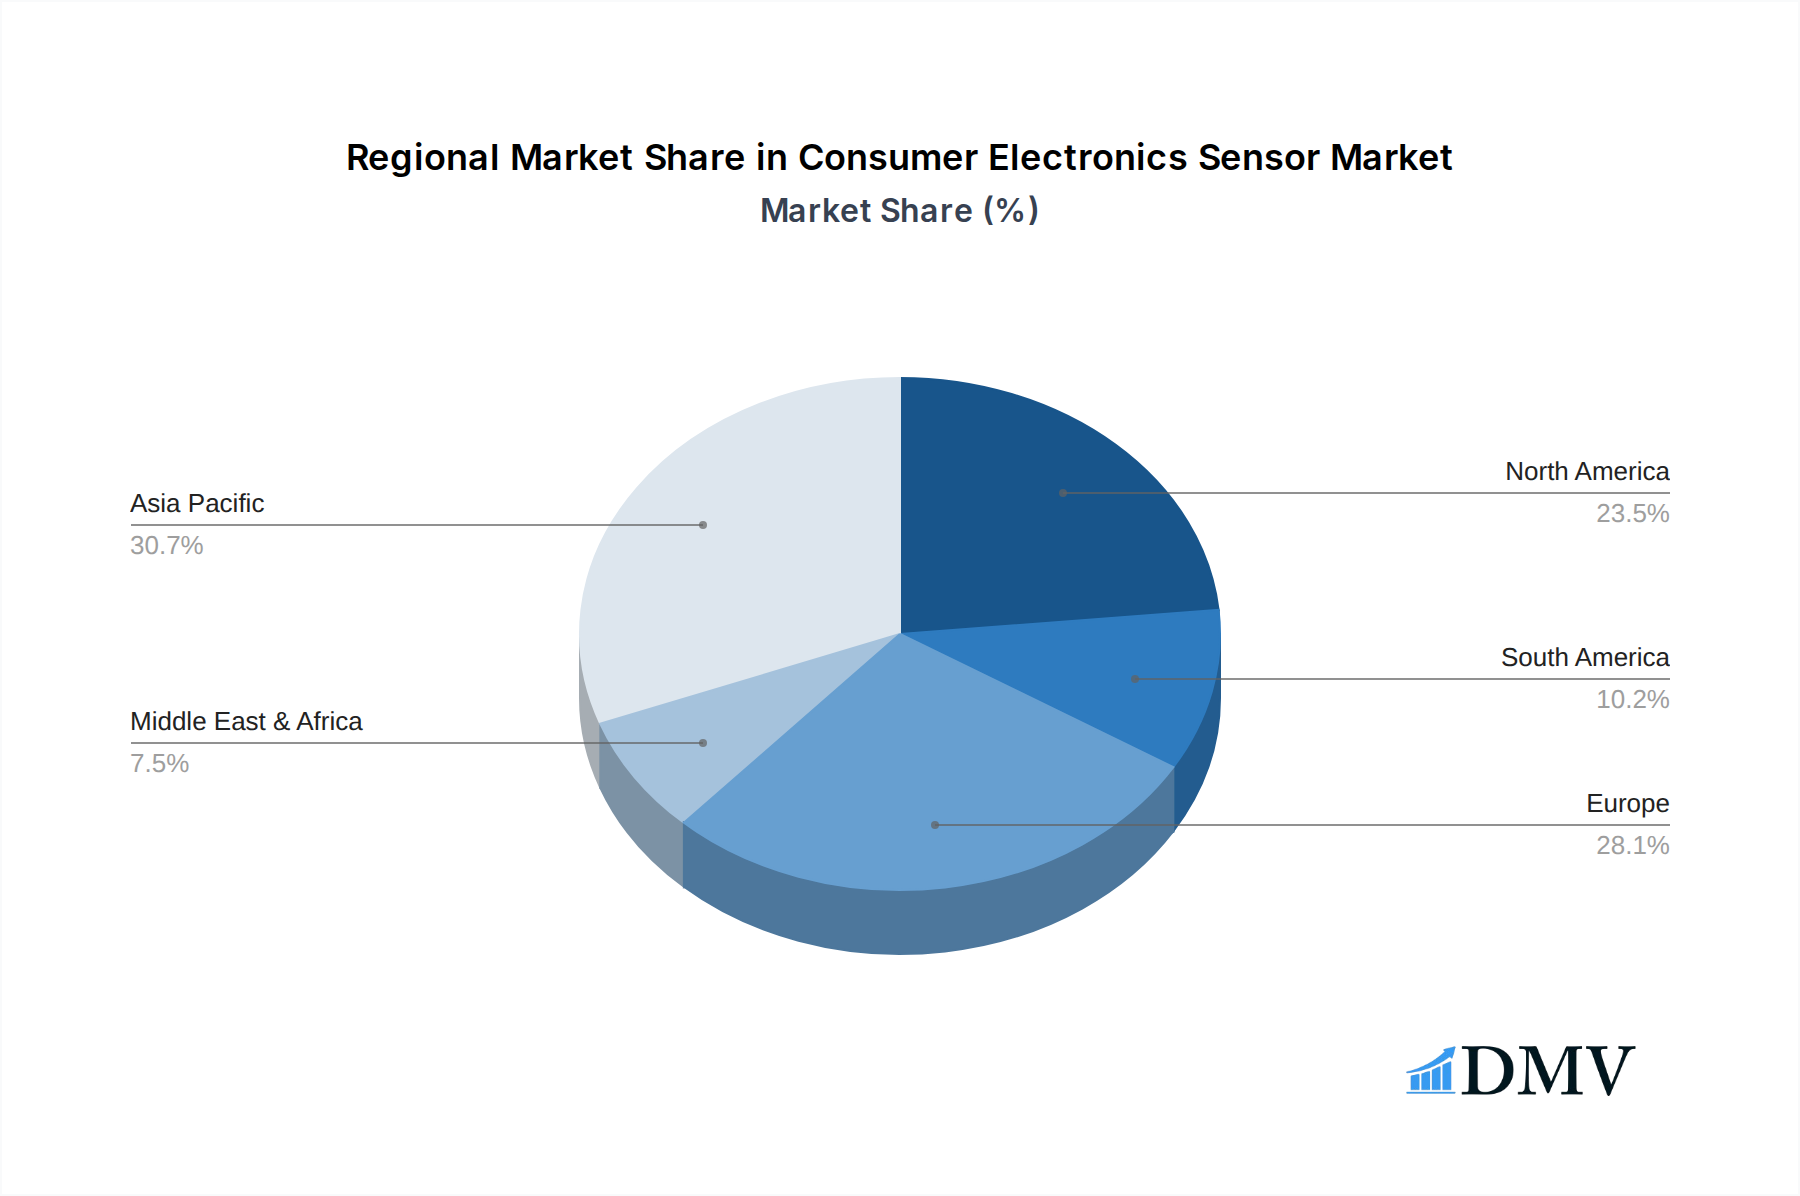
Consumer Electronics Sensor Regional Market Share
Geographic Coverage of Consumer Electronics Sensor
Consumer Electronics Sensor REPORT HIGHLIGHTS
| Aspects | Details |
|---|---|
| Study Period | 2020-2034 |
| Base Year | 2025 |
| Estimated Year | 2026 |
| Forecast Period | 2026-2034 |
| Historical Period | 2020-2025 |
| Growth Rate | CAGR of 11.7% from 2020-2034 |
| Segmentation |
|
Table of Contents
- 1. Introduction
- 1.1. Research Scope
- 1.2. Market Segmentation
- 1.3. Research Methodology
- 1.4. Definitions and Assumptions
- 2. Executive Summary
- 2.1. Introduction
- 3. Market Dynamics
- 3.1. Introduction
- 3.2. Market Drivers
- 3.3. Market Restrains
- 3.4. Market Trends
- 4. Market Factor Analysis
- 4.1. Porters Five Forces
- 4.2. Supply/Value Chain
- 4.3. PESTEL analysis
- 4.4. Market Entropy
- 4.5. Patent/Trademark Analysis
- 5. Global Consumer Electronics Sensor Analysis, Insights and Forecast, 2020-2032
- 5.1. Market Analysis, Insights and Forecast - by Application
- 5.1.1. Communication
- 5.1.2. Entertainment
- 5.1.3. IT
- 5.2. Market Analysis, Insights and Forecast - by Types
- 5.2.1. Image Sensor
- 5.2.2. Motion Sensor
- 5.2.3. Temperature Sensor
- 5.2.4. Pressure Sensor
- 5.2.5. Position Sensor
- 5.2.6. Touch Sensor
- 5.3. Market Analysis, Insights and Forecast - by Region
- 5.3.1. North America
- 5.3.2. South America
- 5.3.3. Europe
- 5.3.4. Middle East & Africa
- 5.3.5. Asia Pacific
- 5.1. Market Analysis, Insights and Forecast - by Application
- 6. North America Consumer Electronics Sensor Analysis, Insights and Forecast, 2020-2032
- 6.1. Market Analysis, Insights and Forecast - by Application
- 6.1.1. Communication
- 6.1.2. Entertainment
- 6.1.3. IT
- 6.2. Market Analysis, Insights and Forecast - by Types
- 6.2.1. Image Sensor
- 6.2.2. Motion Sensor
- 6.2.3. Temperature Sensor
- 6.2.4. Pressure Sensor
- 6.2.5. Position Sensor
- 6.2.6. Touch Sensor
- 6.1. Market Analysis, Insights and Forecast - by Application
- 7. South America Consumer Electronics Sensor Analysis, Insights and Forecast, 2020-2032
- 7.1. Market Analysis, Insights and Forecast - by Application
- 7.1.1. Communication
- 7.1.2. Entertainment
- 7.1.3. IT
- 7.2. Market Analysis, Insights and Forecast - by Types
- 7.2.1. Image Sensor
- 7.2.2. Motion Sensor
- 7.2.3. Temperature Sensor
- 7.2.4. Pressure Sensor
- 7.2.5. Position Sensor
- 7.2.6. Touch Sensor
- 7.1. Market Analysis, Insights and Forecast - by Application
- 8. Europe Consumer Electronics Sensor Analysis, Insights and Forecast, 2020-2032
- 8.1. Market Analysis, Insights and Forecast - by Application
- 8.1.1. Communication
- 8.1.2. Entertainment
- 8.1.3. IT
- 8.2. Market Analysis, Insights and Forecast - by Types
- 8.2.1. Image Sensor
- 8.2.2. Motion Sensor
- 8.2.3. Temperature Sensor
- 8.2.4. Pressure Sensor
- 8.2.5. Position Sensor
- 8.2.6. Touch Sensor
- 8.1. Market Analysis, Insights and Forecast - by Application
- 9. Middle East & Africa Consumer Electronics Sensor Analysis, Insights and Forecast, 2020-2032
- 9.1. Market Analysis, Insights and Forecast - by Application
- 9.1.1. Communication
- 9.1.2. Entertainment
- 9.1.3. IT
- 9.2. Market Analysis, Insights and Forecast - by Types
- 9.2.1. Image Sensor
- 9.2.2. Motion Sensor
- 9.2.3. Temperature Sensor
- 9.2.4. Pressure Sensor
- 9.2.5. Position Sensor
- 9.2.6. Touch Sensor
- 9.1. Market Analysis, Insights and Forecast - by Application
- 10. Asia Pacific Consumer Electronics Sensor Analysis, Insights and Forecast, 2020-2032
- 10.1. Market Analysis, Insights and Forecast - by Application
- 10.1.1. Communication
- 10.1.2. Entertainment
- 10.1.3. IT
- 10.2. Market Analysis, Insights and Forecast - by Types
- 10.2.1. Image Sensor
- 10.2.2. Motion Sensor
- 10.2.3. Temperature Sensor
- 10.2.4. Pressure Sensor
- 10.2.5. Position Sensor
- 10.2.6. Touch Sensor
- 10.1. Market Analysis, Insights and Forecast - by Application
- 11. Competitive Analysis
- 11.1. Global Market Share Analysis 2025
- 11.2. Company Profiles
- 11.2.1 Sony
- 11.2.1.1. Overview
- 11.2.1.2. Products
- 11.2.1.3. SWOT Analysis
- 11.2.1.4. Recent Developments
- 11.2.1.5. Financials (Based on Availability)
- 11.2.2 Aptina Imaging
- 11.2.2.1. Overview
- 11.2.2.2. Products
- 11.2.2.3. SWOT Analysis
- 11.2.2.4. Recent Developments
- 11.2.2.5. Financials (Based on Availability)
- 11.2.3 Synaptic
- 11.2.3.1. Overview
- 11.2.3.2. Products
- 11.2.3.3. SWOT Analysis
- 11.2.3.4. Recent Developments
- 11.2.3.5. Financials (Based on Availability)
- 11.2.4 Bosch
- 11.2.4.1. Overview
- 11.2.4.2. Products
- 11.2.4.3. SWOT Analysis
- 11.2.4.4. Recent Developments
- 11.2.4.5. Financials (Based on Availability)
- 11.2.5 STMicroelectronics
- 11.2.5.1. Overview
- 11.2.5.2. Products
- 11.2.5.3. SWOT Analysis
- 11.2.5.4. Recent Developments
- 11.2.5.5. Financials (Based on Availability)
- 11.2.6 Samsung
- 11.2.6.1. Overview
- 11.2.6.2. Products
- 11.2.6.3. SWOT Analysis
- 11.2.6.4. Recent Developments
- 11.2.6.5. Financials (Based on Availability)
- 11.2.7 Panasonic
- 11.2.7.1. Overview
- 11.2.7.2. Products
- 11.2.7.3. SWOT Analysis
- 11.2.7.4. Recent Developments
- 11.2.7.5. Financials (Based on Availability)
- 11.2.8 Toshiba
- 11.2.8.1. Overview
- 11.2.8.2. Products
- 11.2.8.3. SWOT Analysis
- 11.2.8.4. Recent Developments
- 11.2.8.5. Financials (Based on Availability)
- 11.2.9 AMS
- 11.2.9.1. Overview
- 11.2.9.2. Products
- 11.2.9.3. SWOT Analysis
- 11.2.9.4. Recent Developments
- 11.2.9.5. Financials (Based on Availability)
- 11.2.10 NXP Semiconductors
- 11.2.10.1. Overview
- 11.2.10.2. Products
- 11.2.10.3. SWOT Analysis
- 11.2.10.4. Recent Developments
- 11.2.10.5. Financials (Based on Availability)
- 11.2.11 Cypress Semiconductor Corporation
- 11.2.11.1. Overview
- 11.2.11.2. Products
- 11.2.11.3. SWOT Analysis
- 11.2.11.4. Recent Developments
- 11.2.11.5. Financials (Based on Availability)
- 11.2.12 Infineon Technologies AG
- 11.2.12.1. Overview
- 11.2.12.2. Products
- 11.2.12.3. SWOT Analysis
- 11.2.12.4. Recent Developments
- 11.2.12.5. Financials (Based on Availability)
- 11.2.13 Murata Manufacturing Co.
- 11.2.13.1. Overview
- 11.2.13.2. Products
- 11.2.13.3. SWOT Analysis
- 11.2.13.4. Recent Developments
- 11.2.13.5. Financials (Based on Availability)
- 11.2.14 Ltd.
- 11.2.14.1. Overview
- 11.2.14.2. Products
- 11.2.14.3. SWOT Analysis
- 11.2.14.4. Recent Developments
- 11.2.14.5. Financials (Based on Availability)
- 11.2.15 Nviso SA
- 11.2.15.1. Overview
- 11.2.15.2. Products
- 11.2.15.3. SWOT Analysis
- 11.2.15.4. Recent Developments
- 11.2.15.5. Financials (Based on Availability)
- 11.2.16 Omron Corporation
- 11.2.16.1. Overview
- 11.2.16.2. Products
- 11.2.16.3. SWOT Analysis
- 11.2.16.4. Recent Developments
- 11.2.16.5. Financials (Based on Availability)
- 11.2.17 TE Connectivity Ltd.
- 11.2.17.1. Overview
- 11.2.17.2. Products
- 11.2.17.3. SWOT Analysis
- 11.2.17.4. Recent Developments
- 11.2.17.5. Financials (Based on Availability)
- 11.2.1 Sony
List of Figures
- Figure 1: Global Consumer Electronics Sensor Revenue Breakdown (billion, %) by Region 2025 & 2033
- Figure 2: North America Consumer Electronics Sensor Revenue (billion), by Application 2025 & 2033
- Figure 3: North America Consumer Electronics Sensor Revenue Share (%), by Application 2025 & 2033
- Figure 4: North America Consumer Electronics Sensor Revenue (billion), by Types 2025 & 2033
- Figure 5: North America Consumer Electronics Sensor Revenue Share (%), by Types 2025 & 2033
- Figure 6: North America Consumer Electronics Sensor Revenue (billion), by Country 2025 & 2033
- Figure 7: North America Consumer Electronics Sensor Revenue Share (%), by Country 2025 & 2033
- Figure 8: South America Consumer Electronics Sensor Revenue (billion), by Application 2025 & 2033
- Figure 9: South America Consumer Electronics Sensor Revenue Share (%), by Application 2025 & 2033
- Figure 10: South America Consumer Electronics Sensor Revenue (billion), by Types 2025 & 2033
- Figure 11: South America Consumer Electronics Sensor Revenue Share (%), by Types 2025 & 2033
- Figure 12: South America Consumer Electronics Sensor Revenue (billion), by Country 2025 & 2033
- Figure 13: South America Consumer Electronics Sensor Revenue Share (%), by Country 2025 & 2033
- Figure 14: Europe Consumer Electronics Sensor Revenue (billion), by Application 2025 & 2033
- Figure 15: Europe Consumer Electronics Sensor Revenue Share (%), by Application 2025 & 2033
- Figure 16: Europe Consumer Electronics Sensor Revenue (billion), by Types 2025 & 2033
- Figure 17: Europe Consumer Electronics Sensor Revenue Share (%), by Types 2025 & 2033
- Figure 18: Europe Consumer Electronics Sensor Revenue (billion), by Country 2025 & 2033
- Figure 19: Europe Consumer Electronics Sensor Revenue Share (%), by Country 2025 & 2033
- Figure 20: Middle East & Africa Consumer Electronics Sensor Revenue (billion), by Application 2025 & 2033
- Figure 21: Middle East & Africa Consumer Electronics Sensor Revenue Share (%), by Application 2025 & 2033
- Figure 22: Middle East & Africa Consumer Electronics Sensor Revenue (billion), by Types 2025 & 2033
- Figure 23: Middle East & Africa Consumer Electronics Sensor Revenue Share (%), by Types 2025 & 2033
- Figure 24: Middle East & Africa Consumer Electronics Sensor Revenue (billion), by Country 2025 & 2033
- Figure 25: Middle East & Africa Consumer Electronics Sensor Revenue Share (%), by Country 2025 & 2033
- Figure 26: Asia Pacific Consumer Electronics Sensor Revenue (billion), by Application 2025 & 2033
- Figure 27: Asia Pacific Consumer Electronics Sensor Revenue Share (%), by Application 2025 & 2033
- Figure 28: Asia Pacific Consumer Electronics Sensor Revenue (billion), by Types 2025 & 2033
- Figure 29: Asia Pacific Consumer Electronics Sensor Revenue Share (%), by Types 2025 & 2033
- Figure 30: Asia Pacific Consumer Electronics Sensor Revenue (billion), by Country 2025 & 2033
- Figure 31: Asia Pacific Consumer Electronics Sensor Revenue Share (%), by Country 2025 & 2033
List of Tables
- Table 1: Global Consumer Electronics Sensor Revenue billion Forecast, by Application 2020 & 2033
- Table 2: Global Consumer Electronics Sensor Revenue billion Forecast, by Types 2020 & 2033
- Table 3: Global Consumer Electronics Sensor Revenue billion Forecast, by Region 2020 & 2033
- Table 4: Global Consumer Electronics Sensor Revenue billion Forecast, by Application 2020 & 2033
- Table 5: Global Consumer Electronics Sensor Revenue billion Forecast, by Types 2020 & 2033
- Table 6: Global Consumer Electronics Sensor Revenue billion Forecast, by Country 2020 & 2033
- Table 7: United States Consumer Electronics Sensor Revenue (billion) Forecast, by Application 2020 & 2033
- Table 8: Canada Consumer Electronics Sensor Revenue (billion) Forecast, by Application 2020 & 2033
- Table 9: Mexico Consumer Electronics Sensor Revenue (billion) Forecast, by Application 2020 & 2033
- Table 10: Global Consumer Electronics Sensor Revenue billion Forecast, by Application 2020 & 2033
- Table 11: Global Consumer Electronics Sensor Revenue billion Forecast, by Types 2020 & 2033
- Table 12: Global Consumer Electronics Sensor Revenue billion Forecast, by Country 2020 & 2033
- Table 13: Brazil Consumer Electronics Sensor Revenue (billion) Forecast, by Application 2020 & 2033
- Table 14: Argentina Consumer Electronics Sensor Revenue (billion) Forecast, by Application 2020 & 2033
- Table 15: Rest of South America Consumer Electronics Sensor Revenue (billion) Forecast, by Application 2020 & 2033
- Table 16: Global Consumer Electronics Sensor Revenue billion Forecast, by Application 2020 & 2033
- Table 17: Global Consumer Electronics Sensor Revenue billion Forecast, by Types 2020 & 2033
- Table 18: Global Consumer Electronics Sensor Revenue billion Forecast, by Country 2020 & 2033
- Table 19: United Kingdom Consumer Electronics Sensor Revenue (billion) Forecast, by Application 2020 & 2033
- Table 20: Germany Consumer Electronics Sensor Revenue (billion) Forecast, by Application 2020 & 2033
- Table 21: France Consumer Electronics Sensor Revenue (billion) Forecast, by Application 2020 & 2033
- Table 22: Italy Consumer Electronics Sensor Revenue (billion) Forecast, by Application 2020 & 2033
- Table 23: Spain Consumer Electronics Sensor Revenue (billion) Forecast, by Application 2020 & 2033
- Table 24: Russia Consumer Electronics Sensor Revenue (billion) Forecast, by Application 2020 & 2033
- Table 25: Benelux Consumer Electronics Sensor Revenue (billion) Forecast, by Application 2020 & 2033
- Table 26: Nordics Consumer Electronics Sensor Revenue (billion) Forecast, by Application 2020 & 2033
- Table 27: Rest of Europe Consumer Electronics Sensor Revenue (billion) Forecast, by Application 2020 & 2033
- Table 28: Global Consumer Electronics Sensor Revenue billion Forecast, by Application 2020 & 2033
- Table 29: Global Consumer Electronics Sensor Revenue billion Forecast, by Types 2020 & 2033
- Table 30: Global Consumer Electronics Sensor Revenue billion Forecast, by Country 2020 & 2033
- Table 31: Turkey Consumer Electronics Sensor Revenue (billion) Forecast, by Application 2020 & 2033
- Table 32: Israel Consumer Electronics Sensor Revenue (billion) Forecast, by Application 2020 & 2033
- Table 33: GCC Consumer Electronics Sensor Revenue (billion) Forecast, by Application 2020 & 2033
- Table 34: North Africa Consumer Electronics Sensor Revenue (billion) Forecast, by Application 2020 & 2033
- Table 35: South Africa Consumer Electronics Sensor Revenue (billion) Forecast, by Application 2020 & 2033
- Table 36: Rest of Middle East & Africa Consumer Electronics Sensor Revenue (billion) Forecast, by Application 2020 & 2033
- Table 37: Global Consumer Electronics Sensor Revenue billion Forecast, by Application 2020 & 2033
- Table 38: Global Consumer Electronics Sensor Revenue billion Forecast, by Types 2020 & 2033
- Table 39: Global Consumer Electronics Sensor Revenue billion Forecast, by Country 2020 & 2033
- Table 40: China Consumer Electronics Sensor Revenue (billion) Forecast, by Application 2020 & 2033
- Table 41: India Consumer Electronics Sensor Revenue (billion) Forecast, by Application 2020 & 2033
- Table 42: Japan Consumer Electronics Sensor Revenue (billion) Forecast, by Application 2020 & 2033
- Table 43: South Korea Consumer Electronics Sensor Revenue (billion) Forecast, by Application 2020 & 2033
- Table 44: ASEAN Consumer Electronics Sensor Revenue (billion) Forecast, by Application 2020 & 2033
- Table 45: Oceania Consumer Electronics Sensor Revenue (billion) Forecast, by Application 2020 & 2033
- Table 46: Rest of Asia Pacific Consumer Electronics Sensor Revenue (billion) Forecast, by Application 2020 & 2033
Frequently Asked Questions
1. What is the projected Compound Annual Growth Rate (CAGR) of the Consumer Electronics Sensor?
The projected CAGR is approximately 11.7%.
2. Which companies are prominent players in the Consumer Electronics Sensor?
Key companies in the market include Sony, Aptina Imaging, Synaptic, Bosch, STMicroelectronics, Samsung, Panasonic, Toshiba, AMS, NXP Semiconductors, Cypress Semiconductor Corporation, Infineon Technologies AG, Murata Manufacturing Co., Ltd., Nviso SA, Omron Corporation, TE Connectivity Ltd..
3. What are the main segments of the Consumer Electronics Sensor?
The market segments include Application, Types.
4. Can you provide details about the market size?
The market size is estimated to be USD 25.32 billion as of 2022.
5. What are some drivers contributing to market growth?
N/A
6. What are the notable trends driving market growth?
N/A
7. Are there any restraints impacting market growth?
N/A
8. Can you provide examples of recent developments in the market?
N/A
9. What pricing options are available for accessing the report?
Pricing options include single-user, multi-user, and enterprise licenses priced at USD 2900.00, USD 4350.00, and USD 5800.00 respectively.
10. Is the market size provided in terms of value or volume?
The market size is provided in terms of value, measured in billion.
11. Are there any specific market keywords associated with the report?
Yes, the market keyword associated with the report is "Consumer Electronics Sensor," which aids in identifying and referencing the specific market segment covered.
12. How do I determine which pricing option suits my needs best?
The pricing options vary based on user requirements and access needs. Individual users may opt for single-user licenses, while businesses requiring broader access may choose multi-user or enterprise licenses for cost-effective access to the report.
13. Are there any additional resources or data provided in the Consumer Electronics Sensor report?
While the report offers comprehensive insights, it's advisable to review the specific contents or supplementary materials provided to ascertain if additional resources or data are available.
14. How can I stay updated on further developments or reports in the Consumer Electronics Sensor?
To stay informed about further developments, trends, and reports in the Consumer Electronics Sensor, consider subscribing to industry newsletters, following relevant companies and organizations, or regularly checking reputable industry news sources and publications.
Methodology
Step 1 - Identification of Relevant Samples Size from Population Database


Step 2 - Approaches for Defining Global Market Size (Value, Volume* & Price*)

Note*: In applicable scenarios
Step 3 - Data Sources
Primary Research
- Web Analytics
- Survey Reports
- Research Institute
- Latest Research Reports
- Opinion Leaders
Secondary Research
- Annual Reports
- White Paper
- Latest Press Release
- Industry Association
- Paid Database
- Investor Presentations

Step 4 - Data Triangulation
Involves using different sources of information in order to increase the validity of a study
These sources are likely to be stakeholders in a program - participants, other researchers, program staff, other community members, and so on.
Then we put all data in single framework & apply various statistical tools to find out the dynamic on the market.
During the analysis stage, feedback from the stakeholder groups would be compared to determine areas of agreement as well as areas of divergence