

Key Insights
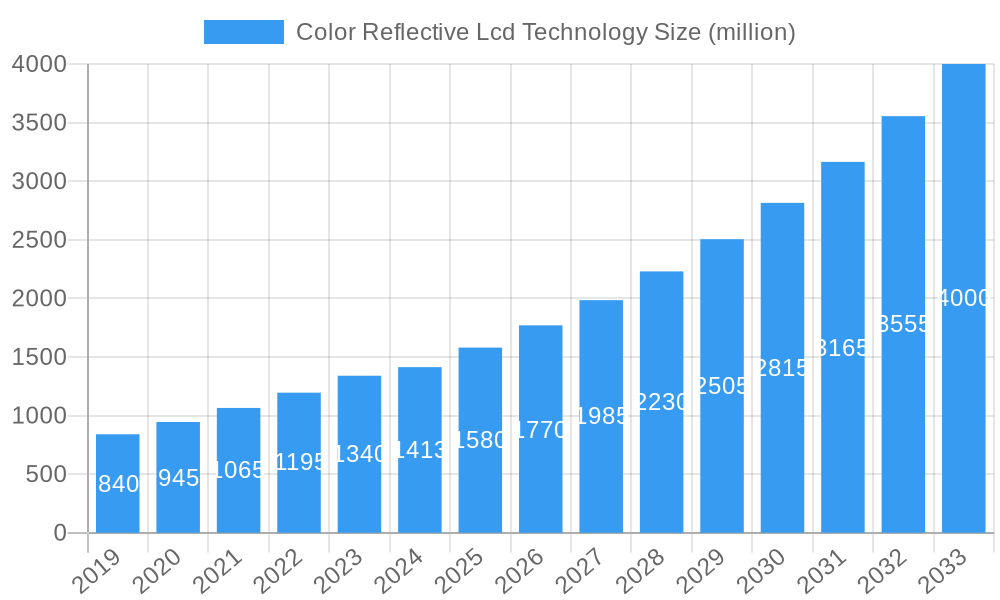
The global market for Color Reflective LCD Technology is poised for significant expansion, with a current market size of approximately $1413 million. This robust growth trajectory is underpinned by a compelling Compound Annual Growth Rate (CAGR) of 12.1% projected over the forecast period of 2025-2033. The inherent advantages of color reflective displays, such as exceptionally low power consumption, excellent readability in bright sunlight, and a paper-like visual experience, are driving their adoption across a spectrum of innovative applications. Key market drivers include the escalating demand for e-readers with enhanced visual comfort, the burgeoning need for dynamic and energy-efficient electronic shelf tags in the retail sector, and the increasing integration of digital signage solutions in public spaces and commercial environments. Emerging trends also point towards the development of more sophisticated color capabilities and faster refresh rates within these technologies, further broadening their appeal and application scope.
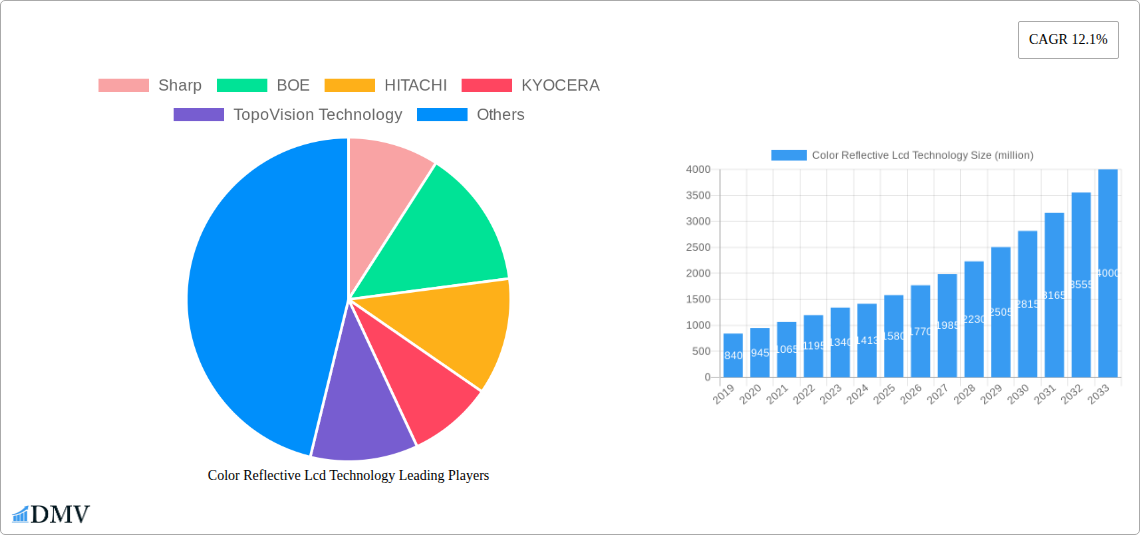
Color Reflective Lcd Technology Market Size (In Million)
Despite the strong growth outlook, certain restraints could influence the market's pace. The initial cost of production for some advanced color reflective display technologies may present a barrier to widespread adoption in cost-sensitive segments. Furthermore, while advancements are being made, the color gamut and contrast ratios may still lag behind traditional backlit displays in certain demanding visual applications. However, the continuous innovation by leading companies like Sharp, BOE, and HITACHI, coupled with the inherent sustainability benefits of reduced energy consumption, are expected to outweigh these challenges. The market is segmented by application into eReaders, Electronic Shelf Tags, Digital Signage, and Others, with Electrophoretic Displays (EPDs) and Cholesteric LCD (ChLCDs) dominating the technology landscape. Geographically, the Asia Pacific region, particularly China, is anticipated to be a dominant force due to its manufacturing prowess and growing domestic demand, while North America and Europe are also expected to witness substantial market penetration.
Color Reflective Lcd Technology Company Market Share
Color Reflective LCD Technology Market Report: Unlocking Next-Generation Displays
This comprehensive market report delves into the dynamic landscape of Color Reflective LCD technology, a transformative display solution poised for significant growth across diverse applications. Our in-depth analysis, spanning the historical period of 2019-2024 and projecting through to 2033, provides critical insights for stakeholders seeking to capitalize on this evolving market. We explore market composition, industry evolution, regional dominance, product innovations, growth drivers, obstacles, future opportunities, key players, and strategic forecasts, all with a focus on optimizing search visibility through high-ranking keywords and delivering actionable intelligence.
Color Reflective LCD Technology Market Composition & Trends
The Color Reflective LCD market is characterized by a moderate level of concentration, driven by innovation from prominent players like Sharp, BOE, and JDI. Emerging technologies such as Electrophoretic Displays (EPDs) and Cholesteric LCDs (ChLCDs) are acting as key innovation catalysts, offering superior power efficiency and sunlight readability compared to traditional LCDs. Regulatory landscapes are evolving to support energy-efficient display solutions, particularly in consumer electronics and digital signage. Substitute products, primarily monochrome e-paper and some low-power OLEDs, present a competitive challenge, but Color Reflective LCDs' unique combination of color, reflectivity, and power efficiency differentiates them. End-user profiles span a broad spectrum, from consumers seeking advanced eReaders to businesses deploying digital signage and electronic shelf tags. Mergers and acquisitions (M&A) activity is anticipated to increase as companies seek to consolidate market share and acquire advanced intellectual property. The market share distribution is currently fragmented, with established players holding significant portions, but niche innovators are gaining traction. Predicted M&A deal values are expected to reach millions in strategic acquisitions over the forecast period.
Color Reflective LCD Technology Industry Evolution
The Color Reflective LCD technology market is on an upward trajectory, experiencing robust growth fueled by relentless technological advancements and a significant shift in consumer and industry demands for power-efficient and visually appealing displays. Throughout the historical period of 2019-2024, this sector witnessed a steady evolution, laying the groundwork for the accelerated expansion projected for the forecast period of 2025-2033. The base year of 2025 marks a critical inflection point, with estimated market growth poised to accelerate significantly.
Early in the study period, innovation was primarily focused on improving color reproduction and response times within electrophoretic display technologies, a key type within Color Reflective LCDs. Companies like E Ink, a pioneer in e-paper, and other specialized manufacturers like TopoVision Technology and Kent Displays, began to push the boundaries of what was possible, making these displays more suitable for a wider range of applications beyond basic e-readers. The introduction of color capabilities to reflective displays, a significant breakthrough, was a pivotal moment. This allowed for richer content presentation in applications like electronic shelf tags and dynamic digital signage, directly addressing a long-standing limitation of monochrome e-paper.
The market growth trajectory has been consistently positive, driven by an increasing awareness of the energy-saving benefits of reflective displays, especially in an era of heightened environmental consciousness and rising energy costs. Adoption metrics for Color Reflective LCDs have seen a notable uptick, particularly in sectors where battery life and outdoor readability are paramount. For instance, the eReader market has continued to embrace these technologies for their paper-like reading experience and extended battery performance. Simultaneously, the retail sector has increasingly adopted electronic shelf tags, replacing traditional paper labels with dynamic, wirelessly updated Color Reflective LCDs, leading to substantial operational efficiencies and reduced waste.
Technological advancements have not been limited to color; improvements in refresh rates, contrast ratios, and durability have also played a crucial role. Companies like Sharp, BOE, and JDI have continuously invested in research and development to enhance pixel density, color gamut, and the overall visual fidelity of their Color Reflective LCD panels. Furthermore, the exploration and development of Cholesteric LCD (ChLCDs) technology by players such as CASIO and SONY have introduced additional options with unique advantages, including bistability and inherent color capabilities without the need for color filters in some configurations, further diversifying the technological landscape.
Shifting consumer demands have also been a powerful engine for growth. Consumers are increasingly seeking devices that offer longer battery life, are easier on the eyes, and perform well in varied lighting conditions, all hallmarks of Color Reflective LCD technology. The demand for "always-on" or low-power displays in smart devices, wearables, and IoT applications has further propelled the adoption of these innovative display solutions. The market is projected to grow at a Compound Annual Growth Rate (CAGR) of approximately XX% from 2025 to 2033, a testament to its burgeoning potential.
Leading Regions, Countries, or Segments in Color Reflective LCD Technology
The Color Reflective LCD technology market is experiencing significant dominance from the Asia-Pacific region, driven by a confluence of factors including robust manufacturing capabilities, substantial R&D investments, and a rapidly expanding consumer and industrial base. Within this region, countries like China, South Korea, and Japan are at the forefront of both production and innovation. China, in particular, with its vast manufacturing infrastructure and aggressive government support for advanced display technologies, is a powerhouse in the production of Color Reflective LCD panels. Companies such as BOE, AUO, and Innolux Display Group, headquartered or with significant operations in this region, are leading the charge in scaling up production and driving down costs.
The Application: Electronic Shelf Tags (ESTs) segment is emerging as a particularly strong growth area within the broader Color Reflective LCD market, both regionally and globally. The increasing adoption of ESTs by major retail chains worldwide is a primary driver. Retailers are recognizing the immense benefits of dynamic pricing, reduced labor costs associated with manual price updates, and enhanced inventory management that Color Reflective LCDs provide. The inherent low power consumption and excellent sunlight readability of these displays make them ideal for the challenging in-store environment. The potential for significant operational savings and improved customer experience is prompting substantial investment in EST deployments.
From a Type perspective, Electrophoretic Displays (EPDs) are currently holding a leading position, largely due to their established maturity and widespread adoption in eReaders. Companies like E Ink, a leading EPD manufacturer, have a strong market presence. However, the development and increasing viability of Cholesteric LCD (ChLCDs) by companies such as CASIO and SONY present a compelling alternative with potential to gain significant market share, particularly in applications demanding faster refresh rates and inherent color capabilities without the need for color filters.
Key Drivers of Dominance in Asia-Pacific and the EST Segment:
- Investment Trends: Significant government subsidies and private sector investments in display manufacturing and R&D in Asia-Pacific are fostering an environment conducive to rapid technological advancement and cost optimization.
- Regulatory Support: Favorable government policies promoting energy efficiency and smart retail solutions are indirectly bolstering the adoption of Color Reflective LCDs. For example, initiatives aimed at reducing electronic waste and promoting sustainable retail practices are driving the uptake of ESTs.
- Market Demand: The sheer size of the consumer electronics and retail markets in Asia-Pacific fuels demand for innovative display solutions. The growing e-commerce sector also indirectly supports the need for efficient retail management systems, including ESTs.
- Technological Ecosystem: The presence of a strong supply chain for display components, coupled with a skilled workforce, allows manufacturers in Asia-Pacific to innovate and produce Color Reflective LCDs at competitive prices.
Color Reflective LCD Technology Product Innovations
Recent product innovations in Color Reflective LCD technology have focused on enhancing color saturation, improving refresh rates, and extending display durability. Breakthroughs in materials science and manufacturing processes have enabled displays with a wider color gamut, closer to that of traditional LCDs, while retaining their signature low-power and sunlight-readable characteristics. Applications are expanding beyond traditional eReaders to dynamic digital signage with improved visual appeal, ruggedized industrial displays, and sophisticated electronic shelf labels that offer real-time product information with vibrant visuals. Performance metrics have seen significant gains, with response times now competitive for many dynamic content applications and contrast ratios exceeding XX:1 in optimal lighting conditions. Unique selling propositions include the ability to operate for months or even years on a single battery charge, an unparalleled reading experience in bright sunlight, and a reduced environmental footprint due to lower energy consumption.
Propelling Factors for Color Reflective LCD Technology Growth
Several key factors are propelling the growth of Color Reflective LCD technology. Technologically, the ongoing advancements in Electrophoretic Displays (EPDs) and the emerging potential of Cholesteric LCDs (ChLCDs) are offering superior power efficiency and outdoor readability, directly addressing market needs. Economically, the rising cost of energy and the increasing demand for sustainable and eco-friendly electronic devices are making low-power displays highly attractive. Regulatory influences, such as government mandates for energy-efficient products and support for digital transformation in retail, are further incentivizing adoption. For instance, the push for smart city initiatives and the growing focus on reducing carbon footprints in commercial operations are directly benefiting these display technologies.
Obstacles in the Color Reflective LCD Technology Market
Despite its promising outlook, the Color Reflective LCD market faces certain obstacles. Regulatory challenges, while generally supportive of energy efficiency, can sometimes be slow to adapt to new display standards, potentially hindering widespread adoption in specific niche applications. Supply chain disruptions, as witnessed in recent global events, can impact the availability and cost of critical components, affecting production timelines and pricing. Competitive pressures from mature display technologies like LCD and OLED, which offer higher refresh rates and broader color ranges in certain indoor applications, also present a challenge, particularly for market segments where speed is paramount. The initial cost of some advanced Color Reflective LCDs can also be a barrier for smaller businesses or in cost-sensitive markets.
Future Opportunities in Color Reflective LCD Technology
Emerging opportunities in Color Reflective LCD technology are abundant. The continued expansion of the Internet of Things (IoT) ecosystem presents a vast market for low-power, always-on displays in smart home devices, wearables, and industrial sensors. The growth of the smart city infrastructure, requiring ubiquitous and energy-efficient digital signage and information displays, offers significant potential. Furthermore, advancements in flexible and transparent Color Reflective LCDs could unlock novel applications in augmented reality (AR) devices and architectural integrations. The increasing consumer demand for sustainable products will continue to drive market share growth for these eco-friendly display solutions.
Major Players in the Color Reflective LCD Technology Ecosystem
- Sharp
- BOE
- HITACHI
- KYOCERA
- TopoVision Technology
- CASIO
- JDI
- SONY
- AUO
- Innolux Display Group
- Laurel Electronics
- TIANMA
- Kent Displays
- BMG MIS
- IRIS Optronics
Key Developments in Color Reflective LCD Technology Industry
- 2019: Introduction of advanced color filters for EPDs, significantly improving color vibrancy and accuracy in eReaders.
- 2020: Increased investment in R&D for ChLCD technology, focusing on enhancing refresh rates and display durability.
- 2021: Major retailers begin widespread pilot programs for color EPD-based Electronic Shelf Tags, demonstrating significant operational efficiencies.
- 2022: Development of flexible Color Reflective LCD panels, opening doors for new form factors in wearable technology and smart surfaces.
- 2023: Enhanced performance metrics for Color Reflective LCDs, including improved contrast ratios and wider viewing angles, leading to broader application adoption.
- 2024: Strategic partnerships formed between display manufacturers and application developers to accelerate the integration of Color Reflective LCDs into new product categories.
Strategic Color Reflective LCD Technology Market Forecast
The strategic Color Reflective LCD market forecast indicates a robust expansion driven by the unyielding demand for energy-efficient and sunlight-readable display solutions. Growth catalysts include continuous technological innovation in EPDs and ChLCDs, the increasing environmental consciousness of consumers and corporations, and favorable regulatory landscapes promoting sustainability. Future opportunities in the burgeoning IoT sector, smart city infrastructure, and advanced wearable technologies will further fuel market potential. The market is projected to witness significant growth, with an estimated market size reaching billions by 2033. Stakeholders investing in this sector can expect substantial returns as Color Reflective LCD technology continues to redefine display standards.
Color Reflective Lcd Technology Segmentation
-
1. Application
- 1.1. eReaders
- 1.2. Electronic Shelf Tags
- 1.3. Digital Signage
- 1.4. Others
-
2. Type
- 2.1. Electrophoretic Displays (EPDs)
- 2.2. Cholesteric LCD (ChLCDs)
- 2.3. Others
Color Reflective Lcd Technology Segmentation By Geography
-
1. North America
- 1.1. United States
- 1.2. Canada
- 1.3. Mexico
-
2. South America
- 2.1. Brazil
- 2.2. Argentina
- 2.3. Rest of South America
-
3. Europe
- 3.1. United Kingdom
- 3.2. Germany
- 3.3. France
- 3.4. Italy
- 3.5. Spain
- 3.6. Russia
- 3.7. Benelux
- 3.8. Nordics
- 3.9. Rest of Europe
-
4. Middle East & Africa
- 4.1. Turkey
- 4.2. Israel
- 4.3. GCC
- 4.4. North Africa
- 4.5. South Africa
- 4.6. Rest of Middle East & Africa
-
5. Asia Pacific
- 5.1. China
- 5.2. India
- 5.3. Japan
- 5.4. South Korea
- 5.5. ASEAN
- 5.6. Oceania
- 5.7. Rest of Asia Pacific
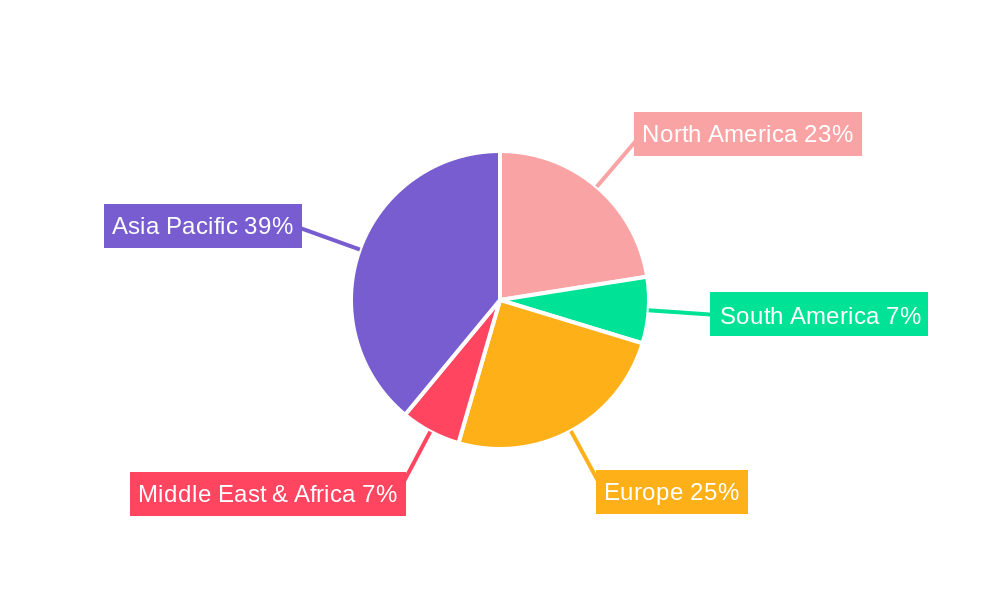
Color Reflective Lcd Technology Regional Market Share
Geographic Coverage of Color Reflective Lcd Technology
Color Reflective Lcd Technology REPORT HIGHLIGHTS
| Aspects | Details |
|---|---|
| Study Period | 2020-2034 |
| Base Year | 2025 |
| Estimated Year | 2026 |
| Forecast Period | 2026-2034 |
| Historical Period | 2020-2025 |
| Growth Rate | CAGR of 12.1% from 2020-2034 |
| Segmentation |
|
Table of Contents
- 1. Introduction
- 1.1. Research Scope
- 1.2. Market Segmentation
- 1.3. Research Objective
- 1.4. Definitions and Assumptions
- 2. Executive Summary
- 2.1. Market Snapshot
- 3. Market Dynamics
- 3.1. Market Drivers
- 3.2. Market Restrains
- 3.3. Market Trends
- 3.4. Market Opportunities
- 4. Market Factor Analysis
- 4.1. Porters Five Forces
- 4.1.1. Bargaining Power of Suppliers
- 4.1.2. Bargaining Power of Buyers
- 4.1.3. Threat of New Entrants
- 4.1.4. Threat of Substitutes
- 4.1.5. Competitive Rivalry
- 4.2. PESTEL analysis
- 4.3. BCG Analysis
- 4.3.1. Stars (High Growth, High Market Share)
- 4.3.2. Cash Cows (Low Growth, High Market Share)
- 4.3.3. Question Mark (High Growth, Low Market Share)
- 4.3.4. Dogs (Low Growth, Low Market Share)
- 4.4. Ansoff Matrix Analysis
- 4.5. Supply Chain Analysis
- 4.6. Regulatory Landscape
- 4.7. Current Market Potential and Opportunity Assessment (TAM–SAM–SOM Framework)
- 4.8. DMV Analyst Note
- 4.1. Porters Five Forces
- 5. Market Analysis, Insights and Forecast 2021-2033
- 5.1. Market Analysis, Insights and Forecast - by Application
- 5.1.1. eReaders
- 5.1.2. Electronic Shelf Tags
- 5.1.3. Digital Signage
- 5.1.4. Others
- 5.2. Market Analysis, Insights and Forecast - by Type
- 5.2.1. Electrophoretic Displays (EPDs)
- 5.2.2. Cholesteric LCD (ChLCDs)
- 5.2.3. Others
- 5.3. Market Analysis, Insights and Forecast - by Region
- 5.3.1. North America
- 5.3.2. South America
- 5.3.3. Europe
- 5.3.4. Middle East & Africa
- 5.3.5. Asia Pacific
- 5.1. Market Analysis, Insights and Forecast - by Application
- 6. Global Color Reflective Lcd Technology Analysis, Insights and Forecast, 2021-2033
- 6.1. Market Analysis, Insights and Forecast - by Application
- 6.1.1. eReaders
- 6.1.2. Electronic Shelf Tags
- 6.1.3. Digital Signage
- 6.1.4. Others
- 6.2. Market Analysis, Insights and Forecast - by Type
- 6.2.1. Electrophoretic Displays (EPDs)
- 6.2.2. Cholesteric LCD (ChLCDs)
- 6.2.3. Others
- 6.1. Market Analysis, Insights and Forecast - by Application
- 7. North America Color Reflective Lcd Technology Analysis, Insights and Forecast, 2020-2032
- 7.1. Market Analysis, Insights and Forecast - by Application
- 7.1.1. eReaders
- 7.1.2. Electronic Shelf Tags
- 7.1.3. Digital Signage
- 7.1.4. Others
- 7.2. Market Analysis, Insights and Forecast - by Type
- 7.2.1. Electrophoretic Displays (EPDs)
- 7.2.2. Cholesteric LCD (ChLCDs)
- 7.2.3. Others
- 7.1. Market Analysis, Insights and Forecast - by Application
- 8. South America Color Reflective Lcd Technology Analysis, Insights and Forecast, 2020-2032
- 8.1. Market Analysis, Insights and Forecast - by Application
- 8.1.1. eReaders
- 8.1.2. Electronic Shelf Tags
- 8.1.3. Digital Signage
- 8.1.4. Others
- 8.2. Market Analysis, Insights and Forecast - by Type
- 8.2.1. Electrophoretic Displays (EPDs)
- 8.2.2. Cholesteric LCD (ChLCDs)
- 8.2.3. Others
- 8.1. Market Analysis, Insights and Forecast - by Application
- 9. Europe Color Reflective Lcd Technology Analysis, Insights and Forecast, 2020-2032
- 9.1. Market Analysis, Insights and Forecast - by Application
- 9.1.1. eReaders
- 9.1.2. Electronic Shelf Tags
- 9.1.3. Digital Signage
- 9.1.4. Others
- 9.2. Market Analysis, Insights and Forecast - by Type
- 9.2.1. Electrophoretic Displays (EPDs)
- 9.2.2. Cholesteric LCD (ChLCDs)
- 9.2.3. Others
- 9.1. Market Analysis, Insights and Forecast - by Application
- 10. Middle East & Africa Color Reflective Lcd Technology Analysis, Insights and Forecast, 2020-2032
- 10.1. Market Analysis, Insights and Forecast - by Application
- 10.1.1. eReaders
- 10.1.2. Electronic Shelf Tags
- 10.1.3. Digital Signage
- 10.1.4. Others
- 10.2. Market Analysis, Insights and Forecast - by Type
- 10.2.1. Electrophoretic Displays (EPDs)
- 10.2.2. Cholesteric LCD (ChLCDs)
- 10.2.3. Others
- 10.1. Market Analysis, Insights and Forecast - by Application
- 11. Asia Pacific Color Reflective Lcd Technology Analysis, Insights and Forecast, 2020-2032
- 11.1. Market Analysis, Insights and Forecast - by Application
- 11.1.1. eReaders
- 11.1.2. Electronic Shelf Tags
- 11.1.3. Digital Signage
- 11.1.4. Others
- 11.2. Market Analysis, Insights and Forecast - by Type
- 11.2.1. Electrophoretic Displays (EPDs)
- 11.2.2. Cholesteric LCD (ChLCDs)
- 11.2.3. Others
- 11.1. Market Analysis, Insights and Forecast - by Application
- 12. Competitive Analysis
- 12.1. Company Profiles
- 12.1.1 Sharp
- 12.1.1.1. Company Overview
- 12.1.1.2. Products
- 12.1.1.3. Company Financials
- 12.1.1.4. SWOT Analysis
- 12.1.2 BOE
- 12.1.2.1. Company Overview
- 12.1.2.2. Products
- 12.1.2.3. Company Financials
- 12.1.2.4. SWOT Analysis
- 12.1.3 HITACHI
- 12.1.3.1. Company Overview
- 12.1.3.2. Products
- 12.1.3.3. Company Financials
- 12.1.3.4. SWOT Analysis
- 12.1.4 KYOCERA
- 12.1.4.1. Company Overview
- 12.1.4.2. Products
- 12.1.4.3. Company Financials
- 12.1.4.4. SWOT Analysis
- 12.1.5 TopoVision Technology
- 12.1.5.1. Company Overview
- 12.1.5.2. Products
- 12.1.5.3. Company Financials
- 12.1.5.4. SWOT Analysis
- 12.1.6 CASIO
- 12.1.6.1. Company Overview
- 12.1.6.2. Products
- 12.1.6.3. Company Financials
- 12.1.6.4. SWOT Analysis
- 12.1.7 JDI
- 12.1.7.1. Company Overview
- 12.1.7.2. Products
- 12.1.7.3. Company Financials
- 12.1.7.4. SWOT Analysis
- 12.1.8 SONY
- 12.1.8.1. Company Overview
- 12.1.8.2. Products
- 12.1.8.3. Company Financials
- 12.1.8.4. SWOT Analysis
- 12.1.9 AUO
- 12.1.9.1. Company Overview
- 12.1.9.2. Products
- 12.1.9.3. Company Financials
- 12.1.9.4. SWOT Analysis
- 12.1.10 Innolux Display Group
- 12.1.10.1. Company Overview
- 12.1.10.2. Products
- 12.1.10.3. Company Financials
- 12.1.10.4. SWOT Analysis
- 12.1.11 Laurel Electronics
- 12.1.11.1. Company Overview
- 12.1.11.2. Products
- 12.1.11.3. Company Financials
- 12.1.11.4. SWOT Analysis
- 12.1.12 TIANMA
- 12.1.12.1. Company Overview
- 12.1.12.2. Products
- 12.1.12.3. Company Financials
- 12.1.12.4. SWOT Analysis
- 12.1.13 Kent Displays
- 12.1.13.1. Company Overview
- 12.1.13.2. Products
- 12.1.13.3. Company Financials
- 12.1.13.4. SWOT Analysis
- 12.1.14 BMG MIS
- 12.1.14.1. Company Overview
- 12.1.14.2. Products
- 12.1.14.3. Company Financials
- 12.1.14.4. SWOT Analysis
- 12.1.15 IRIS Optronics
- 12.1.15.1. Company Overview
- 12.1.15.2. Products
- 12.1.15.3. Company Financials
- 12.1.15.4. SWOT Analysis
- 12.1.1 Sharp
- 12.2. Market Entropy
- 12.2.1 Company's Key Areas Served
- 12.2.2 Recent Developments
- 12.3. Company Market Share Analysis 2025
- 12.3.1 Top 5 Companies Market Share Analysis
- 12.3.2 Top 3 Companies Market Share Analysis
- 12.4. List of Potential Customers
- 13. Research Methodology
List of Figures
- Figure 1: Global Color Reflective Lcd Technology Revenue Breakdown (million, %) by Region 2025 & 2033
- Figure 2: North America Color Reflective Lcd Technology Revenue (million), by Application 2025 & 2033
- Figure 3: North America Color Reflective Lcd Technology Revenue Share (%), by Application 2025 & 2033
- Figure 4: North America Color Reflective Lcd Technology Revenue (million), by Type 2025 & 2033
- Figure 5: North America Color Reflective Lcd Technology Revenue Share (%), by Type 2025 & 2033
- Figure 6: North America Color Reflective Lcd Technology Revenue (million), by Country 2025 & 2033
- Figure 7: North America Color Reflective Lcd Technology Revenue Share (%), by Country 2025 & 2033
- Figure 8: South America Color Reflective Lcd Technology Revenue (million), by Application 2025 & 2033
- Figure 9: South America Color Reflective Lcd Technology Revenue Share (%), by Application 2025 & 2033
- Figure 10: South America Color Reflective Lcd Technology Revenue (million), by Type 2025 & 2033
- Figure 11: South America Color Reflective Lcd Technology Revenue Share (%), by Type 2025 & 2033
- Figure 12: South America Color Reflective Lcd Technology Revenue (million), by Country 2025 & 2033
- Figure 13: South America Color Reflective Lcd Technology Revenue Share (%), by Country 2025 & 2033
- Figure 14: Europe Color Reflective Lcd Technology Revenue (million), by Application 2025 & 2033
- Figure 15: Europe Color Reflective Lcd Technology Revenue Share (%), by Application 2025 & 2033
- Figure 16: Europe Color Reflective Lcd Technology Revenue (million), by Type 2025 & 2033
- Figure 17: Europe Color Reflective Lcd Technology Revenue Share (%), by Type 2025 & 2033
- Figure 18: Europe Color Reflective Lcd Technology Revenue (million), by Country 2025 & 2033
- Figure 19: Europe Color Reflective Lcd Technology Revenue Share (%), by Country 2025 & 2033
- Figure 20: Middle East & Africa Color Reflective Lcd Technology Revenue (million), by Application 2025 & 2033
- Figure 21: Middle East & Africa Color Reflective Lcd Technology Revenue Share (%), by Application 2025 & 2033
- Figure 22: Middle East & Africa Color Reflective Lcd Technology Revenue (million), by Type 2025 & 2033
- Figure 23: Middle East & Africa Color Reflective Lcd Technology Revenue Share (%), by Type 2025 & 2033
- Figure 24: Middle East & Africa Color Reflective Lcd Technology Revenue (million), by Country 2025 & 2033
- Figure 25: Middle East & Africa Color Reflective Lcd Technology Revenue Share (%), by Country 2025 & 2033
- Figure 26: Asia Pacific Color Reflective Lcd Technology Revenue (million), by Application 2025 & 2033
- Figure 27: Asia Pacific Color Reflective Lcd Technology Revenue Share (%), by Application 2025 & 2033
- Figure 28: Asia Pacific Color Reflective Lcd Technology Revenue (million), by Type 2025 & 2033
- Figure 29: Asia Pacific Color Reflective Lcd Technology Revenue Share (%), by Type 2025 & 2033
- Figure 30: Asia Pacific Color Reflective Lcd Technology Revenue (million), by Country 2025 & 2033
- Figure 31: Asia Pacific Color Reflective Lcd Technology Revenue Share (%), by Country 2025 & 2033
List of Tables
- Table 1: Global Color Reflective Lcd Technology Revenue million Forecast, by Application 2020 & 2033
- Table 2: Global Color Reflective Lcd Technology Revenue million Forecast, by Type 2020 & 2033
- Table 3: Global Color Reflective Lcd Technology Revenue million Forecast, by Region 2020 & 2033
- Table 4: Global Color Reflective Lcd Technology Revenue million Forecast, by Application 2020 & 2033
- Table 5: Global Color Reflective Lcd Technology Revenue million Forecast, by Type 2020 & 2033
- Table 6: Global Color Reflective Lcd Technology Revenue million Forecast, by Country 2020 & 2033
- Table 7: United States Color Reflective Lcd Technology Revenue (million) Forecast, by Application 2020 & 2033
- Table 8: Canada Color Reflective Lcd Technology Revenue (million) Forecast, by Application 2020 & 2033
- Table 9: Mexico Color Reflective Lcd Technology Revenue (million) Forecast, by Application 2020 & 2033
- Table 10: Global Color Reflective Lcd Technology Revenue million Forecast, by Application 2020 & 2033
- Table 11: Global Color Reflective Lcd Technology Revenue million Forecast, by Type 2020 & 2033
- Table 12: Global Color Reflective Lcd Technology Revenue million Forecast, by Country 2020 & 2033
- Table 13: Brazil Color Reflective Lcd Technology Revenue (million) Forecast, by Application 2020 & 2033
- Table 14: Argentina Color Reflective Lcd Technology Revenue (million) Forecast, by Application 2020 & 2033
- Table 15: Rest of South America Color Reflective Lcd Technology Revenue (million) Forecast, by Application 2020 & 2033
- Table 16: Global Color Reflective Lcd Technology Revenue million Forecast, by Application 2020 & 2033
- Table 17: Global Color Reflective Lcd Technology Revenue million Forecast, by Type 2020 & 2033
- Table 18: Global Color Reflective Lcd Technology Revenue million Forecast, by Country 2020 & 2033
- Table 19: United Kingdom Color Reflective Lcd Technology Revenue (million) Forecast, by Application 2020 & 2033
- Table 20: Germany Color Reflective Lcd Technology Revenue (million) Forecast, by Application 2020 & 2033
- Table 21: France Color Reflective Lcd Technology Revenue (million) Forecast, by Application 2020 & 2033
- Table 22: Italy Color Reflective Lcd Technology Revenue (million) Forecast, by Application 2020 & 2033
- Table 23: Spain Color Reflective Lcd Technology Revenue (million) Forecast, by Application 2020 & 2033
- Table 24: Russia Color Reflective Lcd Technology Revenue (million) Forecast, by Application 2020 & 2033
- Table 25: Benelux Color Reflective Lcd Technology Revenue (million) Forecast, by Application 2020 & 2033
- Table 26: Nordics Color Reflective Lcd Technology Revenue (million) Forecast, by Application 2020 & 2033
- Table 27: Rest of Europe Color Reflective Lcd Technology Revenue (million) Forecast, by Application 2020 & 2033
- Table 28: Global Color Reflective Lcd Technology Revenue million Forecast, by Application 2020 & 2033
- Table 29: Global Color Reflective Lcd Technology Revenue million Forecast, by Type 2020 & 2033
- Table 30: Global Color Reflective Lcd Technology Revenue million Forecast, by Country 2020 & 2033
- Table 31: Turkey Color Reflective Lcd Technology Revenue (million) Forecast, by Application 2020 & 2033
- Table 32: Israel Color Reflective Lcd Technology Revenue (million) Forecast, by Application 2020 & 2033
- Table 33: GCC Color Reflective Lcd Technology Revenue (million) Forecast, by Application 2020 & 2033
- Table 34: North Africa Color Reflective Lcd Technology Revenue (million) Forecast, by Application 2020 & 2033
- Table 35: South Africa Color Reflective Lcd Technology Revenue (million) Forecast, by Application 2020 & 2033
- Table 36: Rest of Middle East & Africa Color Reflective Lcd Technology Revenue (million) Forecast, by Application 2020 & 2033
- Table 37: Global Color Reflective Lcd Technology Revenue million Forecast, by Application 2020 & 2033
- Table 38: Global Color Reflective Lcd Technology Revenue million Forecast, by Type 2020 & 2033
- Table 39: Global Color Reflective Lcd Technology Revenue million Forecast, by Country 2020 & 2033
- Table 40: China Color Reflective Lcd Technology Revenue (million) Forecast, by Application 2020 & 2033
- Table 41: India Color Reflective Lcd Technology Revenue (million) Forecast, by Application 2020 & 2033
- Table 42: Japan Color Reflective Lcd Technology Revenue (million) Forecast, by Application 2020 & 2033
- Table 43: South Korea Color Reflective Lcd Technology Revenue (million) Forecast, by Application 2020 & 2033
- Table 44: ASEAN Color Reflective Lcd Technology Revenue (million) Forecast, by Application 2020 & 2033
- Table 45: Oceania Color Reflective Lcd Technology Revenue (million) Forecast, by Application 2020 & 2033
- Table 46: Rest of Asia Pacific Color Reflective Lcd Technology Revenue (million) Forecast, by Application 2020 & 2033
Frequently Asked Questions
1. What is the projected Compound Annual Growth Rate (CAGR) of the Color Reflective Lcd Technology?
The projected CAGR is approximately 12.1%.
2. Which companies are prominent players in the Color Reflective Lcd Technology?
Key companies in the market include Sharp, BOE, HITACHI, KYOCERA, TopoVision Technology, CASIO, JDI, SONY, AUO, Innolux Display Group, Laurel Electronics, TIANMA, Kent Displays, BMG MIS, IRIS Optronics.
3. What are the main segments of the Color Reflective Lcd Technology?
The market segments include Application, Type.
4. Can you provide details about the market size?
The market size is estimated to be USD 1413 million as of 2022.
5. What are some drivers contributing to market growth?
N/A
6. What are the notable trends driving market growth?
N/A
7. Are there any restraints impacting market growth?
N/A
8. Can you provide examples of recent developments in the market?
N/A
9. What pricing options are available for accessing the report?
Pricing options include single-user, multi-user, and enterprise licenses priced at USD 2900.00, USD 4350.00, and USD 5800.00 respectively.
10. Is the market size provided in terms of value or volume?
The market size is provided in terms of value, measured in million.
11. Are there any specific market keywords associated with the report?
Yes, the market keyword associated with the report is "Color Reflective Lcd Technology," which aids in identifying and referencing the specific market segment covered.
12. How do I determine which pricing option suits my needs best?
The pricing options vary based on user requirements and access needs. Individual users may opt for single-user licenses, while businesses requiring broader access may choose multi-user or enterprise licenses for cost-effective access to the report.
13. Are there any additional resources or data provided in the Color Reflective Lcd Technology report?
While the report offers comprehensive insights, it's advisable to review the specific contents or supplementary materials provided to ascertain if additional resources or data are available.
14. How can I stay updated on further developments or reports in the Color Reflective Lcd Technology?
To stay informed about further developments, trends, and reports in the Color Reflective Lcd Technology, consider subscribing to industry newsletters, following relevant companies and organizations, or regularly checking reputable industry news sources and publications.
Methodology
Step 1 - Identification of Relevant Samples Size from Population Database


Step 2 - Approaches for Defining Global Market Size (Value, Volume* & Price*)

Note*: In applicable scenarios
Step 3 - Data Sources
Primary Research
- Web Analytics
- Survey Reports
- Research Institute
- Latest Research Reports
- Opinion Leaders
Secondary Research
- Annual Reports
- White Paper
- Latest Press Release
- Industry Association
- Paid Database
- Investor Presentations

Step 4 - Data Triangulation
Involves using different sources of information in order to increase the validity of a study
These sources are likely to be stakeholders in a program - participants, other researchers, program staff, other community members, and so on.
Then we put all data in single framework & apply various statistical tools to find out the dynamic on the market.
During the analysis stage, feedback from the stakeholder groups would be compared to determine areas of agreement as well as areas of divergence