

Key Insights
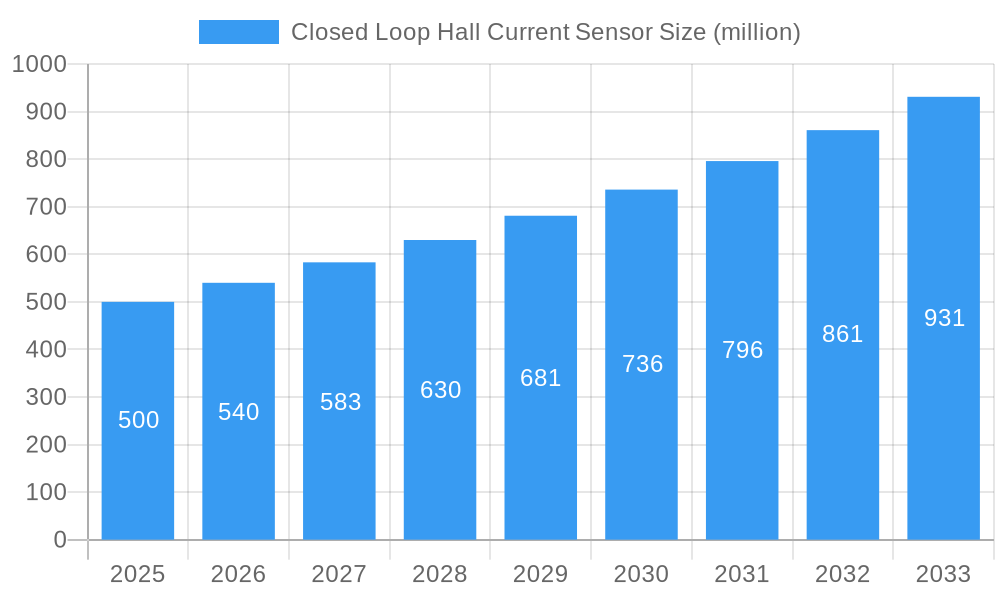
The closed-loop Hall current sensor market is experiencing robust growth, driven by the increasing demand for precise current measurement in various applications. The automotive sector, particularly electric vehicles (EVs) and hybrid electric vehicles (HEVs), is a significant driver, necessitating accurate monitoring of battery current and motor control. The renewable energy sector, including photovoltaic and wind power systems, also contributes substantially to market expansion due to the need for efficient energy management and grid stabilization. Industrial automation is another key application area, where precise current sensing is crucial for optimizing processes and preventing equipment damage. Technological advancements leading to smaller, more efficient, and cost-effective sensors are fueling market expansion. We estimate the market size to be approximately $500 million in 2025, with a Compound Annual Growth Rate (CAGR) of 8% projected through 2033. This growth is primarily attributed to the aforementioned factors, particularly the rising adoption of EVs and renewable energy technologies. However, challenges such as the high initial cost of implementation and the potential for electromagnetic interference may act as restraints. The market is segmented by application (photovoltaic, automotive, wind power, industrial, other) and sensor type (DC Hall current sensor, AC Hall current sensor). Leading companies are actively investing in R&D to enhance sensor performance and expand their product portfolio. Asia-Pacific, especially China and India, are expected to witness significant growth due to the rapid expansion of the manufacturing sector and the increasing adoption of renewable energy sources.
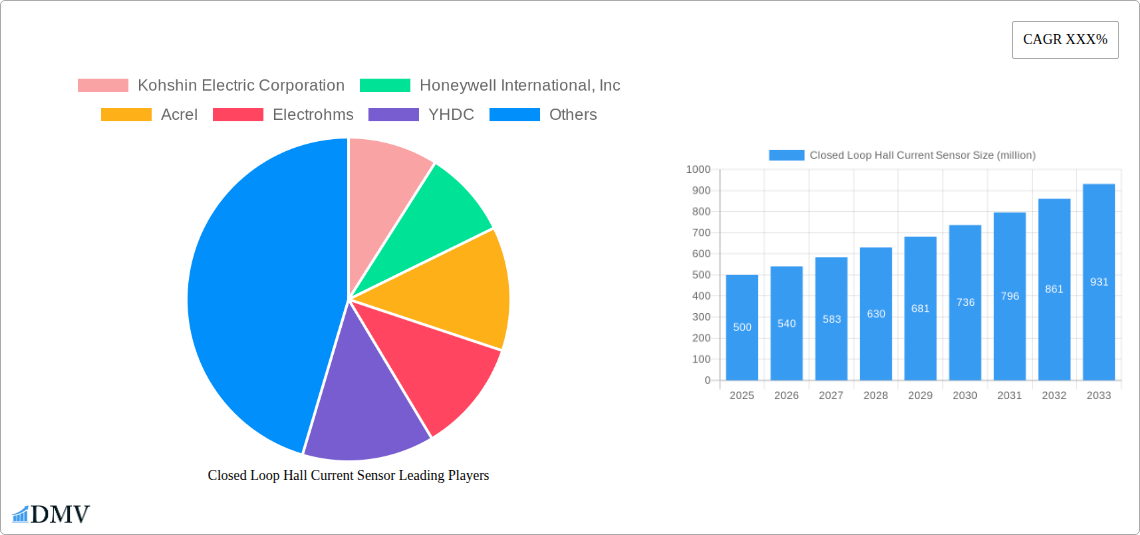
Closed Loop Hall Current Sensor Market Size (In Million)
The competitive landscape is characterized by both established players and emerging companies, each striving for market share through innovation and strategic partnerships. While established companies like Honeywell and TDK leverage their existing infrastructure and brand recognition, newer entrants are focusing on developing niche technologies and competitive pricing. The DC Hall current sensor segment currently holds a larger market share, but the AC Hall current sensor segment is expected to witness faster growth due to its increasing applications in high-frequency systems. Regional variations in growth will depend on factors like government regulations, infrastructure development, and the pace of industrialization. North America and Europe are currently leading the market, however Asia-Pacific is poised for significant growth in the coming years. Future market growth will depend on continuous technological advancements, government support for renewable energy initiatives, and increasing adoption across diverse industrial sectors.
Closed Loop Hall Current Sensor Company Market Share
Closed Loop Hall Current Sensor Market Report: 2019-2033
This comprehensive report provides an in-depth analysis of the global Closed Loop Hall Current Sensor market, offering invaluable insights for stakeholders seeking to navigate this dynamic landscape. The report covers the period from 2019 to 2033, with a focus on the forecast period of 2025-2033, using 2025 as the base and estimated year. Millions of dollars are used for all values throughout this report. This detailed analysis will help you understand market trends, technological advancements, and future opportunities.
Closed Loop Hall Current Sensor Market Composition & Trends
The global Closed Loop Hall Current Sensor market, valued at $XX million in 2024, is projected to reach $XX million by 2033, exhibiting a CAGR of XX%. Market concentration is moderately high, with key players like Honeywell International, Inc, LEM, and TDK holding significant market share. However, the entry of several innovative startups and the increasing adoption of Closed Loop Hall Current Sensors across various sectors is expected to intensify competition.
The market's innovation is driven by advancements in semiconductor technology leading to higher accuracy, improved linearity, and reduced power consumption. Stringent regulatory standards concerning energy efficiency and emissions in automotive and industrial applications are further propelling market growth. Substitute products such as optical current sensors present a competitive threat, yet Closed Loop Hall Current Sensors maintain a competitive edge due to their cost-effectiveness, robustness, and ease of integration.
- Market Share Distribution (2024): Honeywell (XX%), LEM (XX%), TDK (XX%), Others (XX%)
- M&A Activity (2019-2024): Total deal value estimated at $XX million, with a focus on strategic acquisitions of smaller sensor technology companies.
- End-User Profiles: Dominated by automotive, industrial, and renewable energy sectors.
- Regulatory Landscape: Stringent emission and safety standards in automotive and industrial sectors are driving adoption.
Closed Loop Hall Current Sensor Industry Evolution
The Closed Loop Hall Current Sensor market has witnessed significant evolution from 2019 to 2024, marked by substantial technological advancements and shifting consumer preferences toward higher precision and lower power consumption. The market experienced a compound annual growth rate (CAGR) of XX% during the historical period (2019-2024), primarily fueled by the increasing demand for accurate current measurement in electric vehicles and renewable energy applications. The adoption rate of Closed Loop Hall Current Sensors has accelerated in recent years, with a XX% increase in adoption across various sectors between 2023 and 2024.
Technological advancements have focused on miniaturization, improved signal processing, and enhanced temperature stability, resulting in more reliable and efficient sensors. The industry has responded to evolving consumer demands for higher accuracy, broader operating temperature ranges, and improved integration capabilities. This has led to the development of sophisticated sensor systems incorporating advanced features such as integrated signal conditioning and digital communication interfaces. The continued advancement of semiconductor technology is expected to further drive innovation and enhance the performance and capabilities of Closed Loop Hall Current Sensors in the coming years.
Leading Regions, Countries, or Segments in Closed Loop Hall Current Sensor
The automotive segment is the leading application area for Closed Loop Hall Current Sensors, driven by the rapid growth of electric and hybrid vehicles. China is currently the largest national market, followed by the United States and Europe.
- Key Drivers in Automotive Segment:
- Increasing demand for electric vehicles.
- Stringent emission standards.
- Government incentives for electric vehicle adoption.
- Key Drivers in Industrial Segment:
- Automation in manufacturing processes.
- Demand for precise current measurement in industrial machinery.
- Growing adoption of smart factories.
- Dominance Factors: High demand in the automotive industry, increasing automation across all sectors, and the need for precise and efficient energy management are key factors behind the dominance of specific segments and regions.
Closed Loop Hall Current Sensor Product Innovations
Recent innovations include the development of higher-bandwidth sensors for applications demanding faster response times, miniaturized sensors for space-constrained environments, and sensors with enhanced immunity to external magnetic fields for improved accuracy in challenging operating conditions. Unique selling propositions include improved accuracy, smaller form factors, lower power consumption, and wider operating temperature ranges. These advancements are driven by ongoing research in semiconductor technology and advanced signal processing techniques, resulting in more reliable and efficient sensors.
Propelling Factors for Closed Loop Hall Current Sensor Growth
Several factors are driving the growth of the Closed Loop Hall Current Sensor market. These include the increasing demand for electric vehicles, renewable energy systems, and automation in industrial processes. Stringent government regulations regarding emissions and energy efficiency further accelerate market expansion. Technological advancements, including miniaturization and improved accuracy, also contribute significantly to market growth. The continued development of robust and highly accurate sensor solutions is anticipated to fuel market expansion across various sectors in the coming years.
Obstacles in the Closed Loop Hall Current Sensor Market
The Closed Loop Hall Current Sensor market faces challenges like the fluctuating prices of raw materials (semiconductors), potential supply chain disruptions, and intense competition from established players and new entrants. Regulatory hurdles related to safety and compliance vary across different geographic regions, and the complexity of integrating sensors into complex systems can be a barrier to wider adoption. These factors can potentially impact market growth, but the continuing development and innovation in the sector are expected to mitigate these challenges.
Future Opportunities in Closed Loop Hall Current Sensor
Emerging opportunities lie in the expansion into new markets, such as smart grids and renewable energy storage systems. Advancements in sensor technology, such as the development of highly sensitive and miniature sensors, are poised to unlock new applications in areas like healthcare and robotics. The integration of Closed Loop Hall Current Sensors with IoT devices and advanced data analytics platforms presents significant potential for future growth and value creation.
Major Players in the Closed Loop Hall Current Sensor Ecosystem
- Kohshin Electric Corporation
- Honeywell International, Inc
- Acrel
- Electrohms
- YHDC
- Nanjing Chieful Science & Technology
- LEM
- ChenYang Technologies GmbH & Co. KG
- TAMURA
- VACUUMSCHMELZE
- Danisense
- TDK
- ABB
- Telcon
- Shenzhen Socan Technology
- SENIS
Key Developments in Closed Loop Hall Current Sensor Industry
- 2022 Q4: Honeywell launched a new series of high-precision Closed Loop Hall Current Sensors for electric vehicle applications.
- 2023 Q1: LEM acquired a smaller sensor technology company, expanding its product portfolio.
- 2023 Q3: TDK introduced a miniaturized Closed Loop Hall Current Sensor for space-constrained applications.
- (Further key developments to be added based on available data)
Strategic Closed Loop Hall Current Sensor Market Forecast
The Closed Loop Hall Current Sensor market is poised for substantial growth, driven by ongoing technological advancements, increasing demand across key sectors, and favorable regulatory landscapes. The continued adoption of electric vehicles, the expansion of renewable energy infrastructure, and the growth of automation in industrial processes are expected to fuel strong market expansion. The development of innovative sensor technologies and strategic partnerships will play a crucial role in shaping the future trajectory of this dynamic market.
Closed Loop Hall Current Sensor Segmentation
-
1. Application
- 1.1. Photovoltaic
- 1.2. Automobile
- 1.3. Wind Power
- 1.4. Industrial
- 1.5. Other
-
2. Type
- 2.1. DC Hall Current Sensor
- 2.2. AC Hall Current Sensor
Closed Loop Hall Current Sensor Segmentation By Geography
-
1. North America
- 1.1. United States
- 1.2. Canada
- 1.3. Mexico
-
2. South America
- 2.1. Brazil
- 2.2. Argentina
- 2.3. Rest of South America
-
3. Europe
- 3.1. United Kingdom
- 3.2. Germany
- 3.3. France
- 3.4. Italy
- 3.5. Spain
- 3.6. Russia
- 3.7. Benelux
- 3.8. Nordics
- 3.9. Rest of Europe
-
4. Middle East & Africa
- 4.1. Turkey
- 4.2. Israel
- 4.3. GCC
- 4.4. North Africa
- 4.5. South Africa
- 4.6. Rest of Middle East & Africa
-
5. Asia Pacific
- 5.1. China
- 5.2. India
- 5.3. Japan
- 5.4. South Korea
- 5.5. ASEAN
- 5.6. Oceania
- 5.7. Rest of Asia Pacific

Closed Loop Hall Current Sensor Regional Market Share
Geographic Coverage of Closed Loop Hall Current Sensor
Closed Loop Hall Current Sensor REPORT HIGHLIGHTS
| Aspects | Details |
|---|---|
| Study Period | 2020-2034 |
| Base Year | 2025 |
| Estimated Year | 2026 |
| Forecast Period | 2026-2034 |
| Historical Period | 2020-2025 |
| Growth Rate | CAGR of 10.3% from 2020-2034 |
| Segmentation |
|
Table of Contents
- 1. Introduction
- 1.1. Research Scope
- 1.2. Market Segmentation
- 1.3. Research Objective
- 1.4. Definitions and Assumptions
- 2. Executive Summary
- 2.1. Market Snapshot
- 3. Market Dynamics
- 3.1. Market Drivers
- 3.2. Market Restrains
- 3.3. Market Trends
- 3.4. Market Opportunities
- 4. Market Factor Analysis
- 4.1. Porters Five Forces
- 4.1.1. Bargaining Power of Suppliers
- 4.1.2. Bargaining Power of Buyers
- 4.1.3. Threat of New Entrants
- 4.1.4. Threat of Substitutes
- 4.1.5. Competitive Rivalry
- 4.2. PESTEL analysis
- 4.3. BCG Analysis
- 4.3.1. Stars (High Growth, High Market Share)
- 4.3.2. Cash Cows (Low Growth, High Market Share)
- 4.3.3. Question Mark (High Growth, Low Market Share)
- 4.3.4. Dogs (Low Growth, Low Market Share)
- 4.4. Ansoff Matrix Analysis
- 4.5. Supply Chain Analysis
- 4.6. Regulatory Landscape
- 4.7. Current Market Potential and Opportunity Assessment (TAM–SAM–SOM Framework)
- 4.8. DMV Analyst Note
- 4.1. Porters Five Forces
- 5. Market Analysis, Insights and Forecast 2021-2033
- 5.1. Market Analysis, Insights and Forecast - by Application
- 5.1.1. Photovoltaic
- 5.1.2. Automobile
- 5.1.3. Wind Power
- 5.1.4. Industrial
- 5.1.5. Other
- 5.2. Market Analysis, Insights and Forecast - by Type
- 5.2.1. DC Hall Current Sensor
- 5.2.2. AC Hall Current Sensor
- 5.3. Market Analysis, Insights and Forecast - by Region
- 5.3.1. North America
- 5.3.2. South America
- 5.3.3. Europe
- 5.3.4. Middle East & Africa
- 5.3.5. Asia Pacific
- 5.1. Market Analysis, Insights and Forecast - by Application
- 6. Global Closed Loop Hall Current Sensor Analysis, Insights and Forecast, 2021-2033
- 6.1. Market Analysis, Insights and Forecast - by Application
- 6.1.1. Photovoltaic
- 6.1.2. Automobile
- 6.1.3. Wind Power
- 6.1.4. Industrial
- 6.1.5. Other
- 6.2. Market Analysis, Insights and Forecast - by Type
- 6.2.1. DC Hall Current Sensor
- 6.2.2. AC Hall Current Sensor
- 6.1. Market Analysis, Insights and Forecast - by Application
- 7. North America Closed Loop Hall Current Sensor Analysis, Insights and Forecast, 2020-2032
- 7.1. Market Analysis, Insights and Forecast - by Application
- 7.1.1. Photovoltaic
- 7.1.2. Automobile
- 7.1.3. Wind Power
- 7.1.4. Industrial
- 7.1.5. Other
- 7.2. Market Analysis, Insights and Forecast - by Type
- 7.2.1. DC Hall Current Sensor
- 7.2.2. AC Hall Current Sensor
- 7.1. Market Analysis, Insights and Forecast - by Application
- 8. South America Closed Loop Hall Current Sensor Analysis, Insights and Forecast, 2020-2032
- 8.1. Market Analysis, Insights and Forecast - by Application
- 8.1.1. Photovoltaic
- 8.1.2. Automobile
- 8.1.3. Wind Power
- 8.1.4. Industrial
- 8.1.5. Other
- 8.2. Market Analysis, Insights and Forecast - by Type
- 8.2.1. DC Hall Current Sensor
- 8.2.2. AC Hall Current Sensor
- 8.1. Market Analysis, Insights and Forecast - by Application
- 9. Europe Closed Loop Hall Current Sensor Analysis, Insights and Forecast, 2020-2032
- 9.1. Market Analysis, Insights and Forecast - by Application
- 9.1.1. Photovoltaic
- 9.1.2. Automobile
- 9.1.3. Wind Power
- 9.1.4. Industrial
- 9.1.5. Other
- 9.2. Market Analysis, Insights and Forecast - by Type
- 9.2.1. DC Hall Current Sensor
- 9.2.2. AC Hall Current Sensor
- 9.1. Market Analysis, Insights and Forecast - by Application
- 10. Middle East & Africa Closed Loop Hall Current Sensor Analysis, Insights and Forecast, 2020-2032
- 10.1. Market Analysis, Insights and Forecast - by Application
- 10.1.1. Photovoltaic
- 10.1.2. Automobile
- 10.1.3. Wind Power
- 10.1.4. Industrial
- 10.1.5. Other
- 10.2. Market Analysis, Insights and Forecast - by Type
- 10.2.1. DC Hall Current Sensor
- 10.2.2. AC Hall Current Sensor
- 10.1. Market Analysis, Insights and Forecast - by Application
- 11. Asia Pacific Closed Loop Hall Current Sensor Analysis, Insights and Forecast, 2020-2032
- 11.1. Market Analysis, Insights and Forecast - by Application
- 11.1.1. Photovoltaic
- 11.1.2. Automobile
- 11.1.3. Wind Power
- 11.1.4. Industrial
- 11.1.5. Other
- 11.2. Market Analysis, Insights and Forecast - by Type
- 11.2.1. DC Hall Current Sensor
- 11.2.2. AC Hall Current Sensor
- 11.1. Market Analysis, Insights and Forecast - by Application
- 12. Competitive Analysis
- 12.1. Company Profiles
- 12.1.1 Kohshin Electric Corporation
- 12.1.1.1. Company Overview
- 12.1.1.2. Products
- 12.1.1.3. Company Financials
- 12.1.1.4. SWOT Analysis
- 12.1.2 Honeywell International Inc
- 12.1.2.1. Company Overview
- 12.1.2.2. Products
- 12.1.2.3. Company Financials
- 12.1.2.4. SWOT Analysis
- 12.1.3 Acrel
- 12.1.3.1. Company Overview
- 12.1.3.2. Products
- 12.1.3.3. Company Financials
- 12.1.3.4. SWOT Analysis
- 12.1.4 Electrohms
- 12.1.4.1. Company Overview
- 12.1.4.2. Products
- 12.1.4.3. Company Financials
- 12.1.4.4. SWOT Analysis
- 12.1.5 YHDC
- 12.1.5.1. Company Overview
- 12.1.5.2. Products
- 12.1.5.3. Company Financials
- 12.1.5.4. SWOT Analysis
- 12.1.6 Nanjing Chieful Science & Technology
- 12.1.6.1. Company Overview
- 12.1.6.2. Products
- 12.1.6.3. Company Financials
- 12.1.6.4. SWOT Analysis
- 12.1.7 LEM
- 12.1.7.1. Company Overview
- 12.1.7.2. Products
- 12.1.7.3. Company Financials
- 12.1.7.4. SWOT Analysis
- 12.1.8 ChenYang Technologies GmbH & Co. KG
- 12.1.8.1. Company Overview
- 12.1.8.2. Products
- 12.1.8.3. Company Financials
- 12.1.8.4. SWOT Analysis
- 12.1.9 TAMURA
- 12.1.9.1. Company Overview
- 12.1.9.2. Products
- 12.1.9.3. Company Financials
- 12.1.9.4. SWOT Analysis
- 12.1.10 VACUUMSCHMELZE
- 12.1.10.1. Company Overview
- 12.1.10.2. Products
- 12.1.10.3. Company Financials
- 12.1.10.4. SWOT Analysis
- 12.1.11 Danisense
- 12.1.11.1. Company Overview
- 12.1.11.2. Products
- 12.1.11.3. Company Financials
- 12.1.11.4. SWOT Analysis
- 12.1.12 TDK
- 12.1.12.1. Company Overview
- 12.1.12.2. Products
- 12.1.12.3. Company Financials
- 12.1.12.4. SWOT Analysis
- 12.1.13 ABB
- 12.1.13.1. Company Overview
- 12.1.13.2. Products
- 12.1.13.3. Company Financials
- 12.1.13.4. SWOT Analysis
- 12.1.14 Telcon
- 12.1.14.1. Company Overview
- 12.1.14.2. Products
- 12.1.14.3. Company Financials
- 12.1.14.4. SWOT Analysis
- 12.1.15 Shenzhen Socan Technology
- 12.1.15.1. Company Overview
- 12.1.15.2. Products
- 12.1.15.3. Company Financials
- 12.1.15.4. SWOT Analysis
- 12.1.16 SENIS
- 12.1.16.1. Company Overview
- 12.1.16.2. Products
- 12.1.16.3. Company Financials
- 12.1.16.4. SWOT Analysis
- 12.1.1 Kohshin Electric Corporation
- 12.2. Market Entropy
- 12.2.1 Company's Key Areas Served
- 12.2.2 Recent Developments
- 12.3. Company Market Share Analysis 2025
- 12.3.1 Top 5 Companies Market Share Analysis
- 12.3.2 Top 3 Companies Market Share Analysis
- 12.4. List of Potential Customers
- 13. Research Methodology
List of Figures
- Figure 1: Global Closed Loop Hall Current Sensor Revenue Breakdown (undefined, %) by Region 2025 & 2033
- Figure 2: Global Closed Loop Hall Current Sensor Volume Breakdown (K, %) by Region 2025 & 2033
- Figure 3: North America Closed Loop Hall Current Sensor Revenue (undefined), by Application 2025 & 2033
- Figure 4: North America Closed Loop Hall Current Sensor Volume (K), by Application 2025 & 2033
- Figure 5: North America Closed Loop Hall Current Sensor Revenue Share (%), by Application 2025 & 2033
- Figure 6: North America Closed Loop Hall Current Sensor Volume Share (%), by Application 2025 & 2033
- Figure 7: North America Closed Loop Hall Current Sensor Revenue (undefined), by Type 2025 & 2033
- Figure 8: North America Closed Loop Hall Current Sensor Volume (K), by Type 2025 & 2033
- Figure 9: North America Closed Loop Hall Current Sensor Revenue Share (%), by Type 2025 & 2033
- Figure 10: North America Closed Loop Hall Current Sensor Volume Share (%), by Type 2025 & 2033
- Figure 11: North America Closed Loop Hall Current Sensor Revenue (undefined), by Country 2025 & 2033
- Figure 12: North America Closed Loop Hall Current Sensor Volume (K), by Country 2025 & 2033
- Figure 13: North America Closed Loop Hall Current Sensor Revenue Share (%), by Country 2025 & 2033
- Figure 14: North America Closed Loop Hall Current Sensor Volume Share (%), by Country 2025 & 2033
- Figure 15: South America Closed Loop Hall Current Sensor Revenue (undefined), by Application 2025 & 2033
- Figure 16: South America Closed Loop Hall Current Sensor Volume (K), by Application 2025 & 2033
- Figure 17: South America Closed Loop Hall Current Sensor Revenue Share (%), by Application 2025 & 2033
- Figure 18: South America Closed Loop Hall Current Sensor Volume Share (%), by Application 2025 & 2033
- Figure 19: South America Closed Loop Hall Current Sensor Revenue (undefined), by Type 2025 & 2033
- Figure 20: South America Closed Loop Hall Current Sensor Volume (K), by Type 2025 & 2033
- Figure 21: South America Closed Loop Hall Current Sensor Revenue Share (%), by Type 2025 & 2033
- Figure 22: South America Closed Loop Hall Current Sensor Volume Share (%), by Type 2025 & 2033
- Figure 23: South America Closed Loop Hall Current Sensor Revenue (undefined), by Country 2025 & 2033
- Figure 24: South America Closed Loop Hall Current Sensor Volume (K), by Country 2025 & 2033
- Figure 25: South America Closed Loop Hall Current Sensor Revenue Share (%), by Country 2025 & 2033
- Figure 26: South America Closed Loop Hall Current Sensor Volume Share (%), by Country 2025 & 2033
- Figure 27: Europe Closed Loop Hall Current Sensor Revenue (undefined), by Application 2025 & 2033
- Figure 28: Europe Closed Loop Hall Current Sensor Volume (K), by Application 2025 & 2033
- Figure 29: Europe Closed Loop Hall Current Sensor Revenue Share (%), by Application 2025 & 2033
- Figure 30: Europe Closed Loop Hall Current Sensor Volume Share (%), by Application 2025 & 2033
- Figure 31: Europe Closed Loop Hall Current Sensor Revenue (undefined), by Type 2025 & 2033
- Figure 32: Europe Closed Loop Hall Current Sensor Volume (K), by Type 2025 & 2033
- Figure 33: Europe Closed Loop Hall Current Sensor Revenue Share (%), by Type 2025 & 2033
- Figure 34: Europe Closed Loop Hall Current Sensor Volume Share (%), by Type 2025 & 2033
- Figure 35: Europe Closed Loop Hall Current Sensor Revenue (undefined), by Country 2025 & 2033
- Figure 36: Europe Closed Loop Hall Current Sensor Volume (K), by Country 2025 & 2033
- Figure 37: Europe Closed Loop Hall Current Sensor Revenue Share (%), by Country 2025 & 2033
- Figure 38: Europe Closed Loop Hall Current Sensor Volume Share (%), by Country 2025 & 2033
- Figure 39: Middle East & Africa Closed Loop Hall Current Sensor Revenue (undefined), by Application 2025 & 2033
- Figure 40: Middle East & Africa Closed Loop Hall Current Sensor Volume (K), by Application 2025 & 2033
- Figure 41: Middle East & Africa Closed Loop Hall Current Sensor Revenue Share (%), by Application 2025 & 2033
- Figure 42: Middle East & Africa Closed Loop Hall Current Sensor Volume Share (%), by Application 2025 & 2033
- Figure 43: Middle East & Africa Closed Loop Hall Current Sensor Revenue (undefined), by Type 2025 & 2033
- Figure 44: Middle East & Africa Closed Loop Hall Current Sensor Volume (K), by Type 2025 & 2033
- Figure 45: Middle East & Africa Closed Loop Hall Current Sensor Revenue Share (%), by Type 2025 & 2033
- Figure 46: Middle East & Africa Closed Loop Hall Current Sensor Volume Share (%), by Type 2025 & 2033
- Figure 47: Middle East & Africa Closed Loop Hall Current Sensor Revenue (undefined), by Country 2025 & 2033
- Figure 48: Middle East & Africa Closed Loop Hall Current Sensor Volume (K), by Country 2025 & 2033
- Figure 49: Middle East & Africa Closed Loop Hall Current Sensor Revenue Share (%), by Country 2025 & 2033
- Figure 50: Middle East & Africa Closed Loop Hall Current Sensor Volume Share (%), by Country 2025 & 2033
- Figure 51: Asia Pacific Closed Loop Hall Current Sensor Revenue (undefined), by Application 2025 & 2033
- Figure 52: Asia Pacific Closed Loop Hall Current Sensor Volume (K), by Application 2025 & 2033
- Figure 53: Asia Pacific Closed Loop Hall Current Sensor Revenue Share (%), by Application 2025 & 2033
- Figure 54: Asia Pacific Closed Loop Hall Current Sensor Volume Share (%), by Application 2025 & 2033
- Figure 55: Asia Pacific Closed Loop Hall Current Sensor Revenue (undefined), by Type 2025 & 2033
- Figure 56: Asia Pacific Closed Loop Hall Current Sensor Volume (K), by Type 2025 & 2033
- Figure 57: Asia Pacific Closed Loop Hall Current Sensor Revenue Share (%), by Type 2025 & 2033
- Figure 58: Asia Pacific Closed Loop Hall Current Sensor Volume Share (%), by Type 2025 & 2033
- Figure 59: Asia Pacific Closed Loop Hall Current Sensor Revenue (undefined), by Country 2025 & 2033
- Figure 60: Asia Pacific Closed Loop Hall Current Sensor Volume (K), by Country 2025 & 2033
- Figure 61: Asia Pacific Closed Loop Hall Current Sensor Revenue Share (%), by Country 2025 & 2033
- Figure 62: Asia Pacific Closed Loop Hall Current Sensor Volume Share (%), by Country 2025 & 2033
List of Tables
- Table 1: Global Closed Loop Hall Current Sensor Revenue undefined Forecast, by Application 2020 & 2033
- Table 2: Global Closed Loop Hall Current Sensor Volume K Forecast, by Application 2020 & 2033
- Table 3: Global Closed Loop Hall Current Sensor Revenue undefined Forecast, by Type 2020 & 2033
- Table 4: Global Closed Loop Hall Current Sensor Volume K Forecast, by Type 2020 & 2033
- Table 5: Global Closed Loop Hall Current Sensor Revenue undefined Forecast, by Region 2020 & 2033
- Table 6: Global Closed Loop Hall Current Sensor Volume K Forecast, by Region 2020 & 2033
- Table 7: Global Closed Loop Hall Current Sensor Revenue undefined Forecast, by Application 2020 & 2033
- Table 8: Global Closed Loop Hall Current Sensor Volume K Forecast, by Application 2020 & 2033
- Table 9: Global Closed Loop Hall Current Sensor Revenue undefined Forecast, by Type 2020 & 2033
- Table 10: Global Closed Loop Hall Current Sensor Volume K Forecast, by Type 2020 & 2033
- Table 11: Global Closed Loop Hall Current Sensor Revenue undefined Forecast, by Country 2020 & 2033
- Table 12: Global Closed Loop Hall Current Sensor Volume K Forecast, by Country 2020 & 2033
- Table 13: United States Closed Loop Hall Current Sensor Revenue (undefined) Forecast, by Application 2020 & 2033
- Table 14: United States Closed Loop Hall Current Sensor Volume (K) Forecast, by Application 2020 & 2033
- Table 15: Canada Closed Loop Hall Current Sensor Revenue (undefined) Forecast, by Application 2020 & 2033
- Table 16: Canada Closed Loop Hall Current Sensor Volume (K) Forecast, by Application 2020 & 2033
- Table 17: Mexico Closed Loop Hall Current Sensor Revenue (undefined) Forecast, by Application 2020 & 2033
- Table 18: Mexico Closed Loop Hall Current Sensor Volume (K) Forecast, by Application 2020 & 2033
- Table 19: Global Closed Loop Hall Current Sensor Revenue undefined Forecast, by Application 2020 & 2033
- Table 20: Global Closed Loop Hall Current Sensor Volume K Forecast, by Application 2020 & 2033
- Table 21: Global Closed Loop Hall Current Sensor Revenue undefined Forecast, by Type 2020 & 2033
- Table 22: Global Closed Loop Hall Current Sensor Volume K Forecast, by Type 2020 & 2033
- Table 23: Global Closed Loop Hall Current Sensor Revenue undefined Forecast, by Country 2020 & 2033
- Table 24: Global Closed Loop Hall Current Sensor Volume K Forecast, by Country 2020 & 2033
- Table 25: Brazil Closed Loop Hall Current Sensor Revenue (undefined) Forecast, by Application 2020 & 2033
- Table 26: Brazil Closed Loop Hall Current Sensor Volume (K) Forecast, by Application 2020 & 2033
- Table 27: Argentina Closed Loop Hall Current Sensor Revenue (undefined) Forecast, by Application 2020 & 2033
- Table 28: Argentina Closed Loop Hall Current Sensor Volume (K) Forecast, by Application 2020 & 2033
- Table 29: Rest of South America Closed Loop Hall Current Sensor Revenue (undefined) Forecast, by Application 2020 & 2033
- Table 30: Rest of South America Closed Loop Hall Current Sensor Volume (K) Forecast, by Application 2020 & 2033
- Table 31: Global Closed Loop Hall Current Sensor Revenue undefined Forecast, by Application 2020 & 2033
- Table 32: Global Closed Loop Hall Current Sensor Volume K Forecast, by Application 2020 & 2033
- Table 33: Global Closed Loop Hall Current Sensor Revenue undefined Forecast, by Type 2020 & 2033
- Table 34: Global Closed Loop Hall Current Sensor Volume K Forecast, by Type 2020 & 2033
- Table 35: Global Closed Loop Hall Current Sensor Revenue undefined Forecast, by Country 2020 & 2033
- Table 36: Global Closed Loop Hall Current Sensor Volume K Forecast, by Country 2020 & 2033
- Table 37: United Kingdom Closed Loop Hall Current Sensor Revenue (undefined) Forecast, by Application 2020 & 2033
- Table 38: United Kingdom Closed Loop Hall Current Sensor Volume (K) Forecast, by Application 2020 & 2033
- Table 39: Germany Closed Loop Hall Current Sensor Revenue (undefined) Forecast, by Application 2020 & 2033
- Table 40: Germany Closed Loop Hall Current Sensor Volume (K) Forecast, by Application 2020 & 2033
- Table 41: France Closed Loop Hall Current Sensor Revenue (undefined) Forecast, by Application 2020 & 2033
- Table 42: France Closed Loop Hall Current Sensor Volume (K) Forecast, by Application 2020 & 2033
- Table 43: Italy Closed Loop Hall Current Sensor Revenue (undefined) Forecast, by Application 2020 & 2033
- Table 44: Italy Closed Loop Hall Current Sensor Volume (K) Forecast, by Application 2020 & 2033
- Table 45: Spain Closed Loop Hall Current Sensor Revenue (undefined) Forecast, by Application 2020 & 2033
- Table 46: Spain Closed Loop Hall Current Sensor Volume (K) Forecast, by Application 2020 & 2033
- Table 47: Russia Closed Loop Hall Current Sensor Revenue (undefined) Forecast, by Application 2020 & 2033
- Table 48: Russia Closed Loop Hall Current Sensor Volume (K) Forecast, by Application 2020 & 2033
- Table 49: Benelux Closed Loop Hall Current Sensor Revenue (undefined) Forecast, by Application 2020 & 2033
- Table 50: Benelux Closed Loop Hall Current Sensor Volume (K) Forecast, by Application 2020 & 2033
- Table 51: Nordics Closed Loop Hall Current Sensor Revenue (undefined) Forecast, by Application 2020 & 2033
- Table 52: Nordics Closed Loop Hall Current Sensor Volume (K) Forecast, by Application 2020 & 2033
- Table 53: Rest of Europe Closed Loop Hall Current Sensor Revenue (undefined) Forecast, by Application 2020 & 2033
- Table 54: Rest of Europe Closed Loop Hall Current Sensor Volume (K) Forecast, by Application 2020 & 2033
- Table 55: Global Closed Loop Hall Current Sensor Revenue undefined Forecast, by Application 2020 & 2033
- Table 56: Global Closed Loop Hall Current Sensor Volume K Forecast, by Application 2020 & 2033
- Table 57: Global Closed Loop Hall Current Sensor Revenue undefined Forecast, by Type 2020 & 2033
- Table 58: Global Closed Loop Hall Current Sensor Volume K Forecast, by Type 2020 & 2033
- Table 59: Global Closed Loop Hall Current Sensor Revenue undefined Forecast, by Country 2020 & 2033
- Table 60: Global Closed Loop Hall Current Sensor Volume K Forecast, by Country 2020 & 2033
- Table 61: Turkey Closed Loop Hall Current Sensor Revenue (undefined) Forecast, by Application 2020 & 2033
- Table 62: Turkey Closed Loop Hall Current Sensor Volume (K) Forecast, by Application 2020 & 2033
- Table 63: Israel Closed Loop Hall Current Sensor Revenue (undefined) Forecast, by Application 2020 & 2033
- Table 64: Israel Closed Loop Hall Current Sensor Volume (K) Forecast, by Application 2020 & 2033
- Table 65: GCC Closed Loop Hall Current Sensor Revenue (undefined) Forecast, by Application 2020 & 2033
- Table 66: GCC Closed Loop Hall Current Sensor Volume (K) Forecast, by Application 2020 & 2033
- Table 67: North Africa Closed Loop Hall Current Sensor Revenue (undefined) Forecast, by Application 2020 & 2033
- Table 68: North Africa Closed Loop Hall Current Sensor Volume (K) Forecast, by Application 2020 & 2033
- Table 69: South Africa Closed Loop Hall Current Sensor Revenue (undefined) Forecast, by Application 2020 & 2033
- Table 70: South Africa Closed Loop Hall Current Sensor Volume (K) Forecast, by Application 2020 & 2033
- Table 71: Rest of Middle East & Africa Closed Loop Hall Current Sensor Revenue (undefined) Forecast, by Application 2020 & 2033
- Table 72: Rest of Middle East & Africa Closed Loop Hall Current Sensor Volume (K) Forecast, by Application 2020 & 2033
- Table 73: Global Closed Loop Hall Current Sensor Revenue undefined Forecast, by Application 2020 & 2033
- Table 74: Global Closed Loop Hall Current Sensor Volume K Forecast, by Application 2020 & 2033
- Table 75: Global Closed Loop Hall Current Sensor Revenue undefined Forecast, by Type 2020 & 2033
- Table 76: Global Closed Loop Hall Current Sensor Volume K Forecast, by Type 2020 & 2033
- Table 77: Global Closed Loop Hall Current Sensor Revenue undefined Forecast, by Country 2020 & 2033
- Table 78: Global Closed Loop Hall Current Sensor Volume K Forecast, by Country 2020 & 2033
- Table 79: China Closed Loop Hall Current Sensor Revenue (undefined) Forecast, by Application 2020 & 2033
- Table 80: China Closed Loop Hall Current Sensor Volume (K) Forecast, by Application 2020 & 2033
- Table 81: India Closed Loop Hall Current Sensor Revenue (undefined) Forecast, by Application 2020 & 2033
- Table 82: India Closed Loop Hall Current Sensor Volume (K) Forecast, by Application 2020 & 2033
- Table 83: Japan Closed Loop Hall Current Sensor Revenue (undefined) Forecast, by Application 2020 & 2033
- Table 84: Japan Closed Loop Hall Current Sensor Volume (K) Forecast, by Application 2020 & 2033
- Table 85: South Korea Closed Loop Hall Current Sensor Revenue (undefined) Forecast, by Application 2020 & 2033
- Table 86: South Korea Closed Loop Hall Current Sensor Volume (K) Forecast, by Application 2020 & 2033
- Table 87: ASEAN Closed Loop Hall Current Sensor Revenue (undefined) Forecast, by Application 2020 & 2033
- Table 88: ASEAN Closed Loop Hall Current Sensor Volume (K) Forecast, by Application 2020 & 2033
- Table 89: Oceania Closed Loop Hall Current Sensor Revenue (undefined) Forecast, by Application 2020 & 2033
- Table 90: Oceania Closed Loop Hall Current Sensor Volume (K) Forecast, by Application 2020 & 2033
- Table 91: Rest of Asia Pacific Closed Loop Hall Current Sensor Revenue (undefined) Forecast, by Application 2020 & 2033
- Table 92: Rest of Asia Pacific Closed Loop Hall Current Sensor Volume (K) Forecast, by Application 2020 & 2033
Frequently Asked Questions
1. What is the projected Compound Annual Growth Rate (CAGR) of the Closed Loop Hall Current Sensor?
The projected CAGR is approximately 10.3%.
2. Which companies are prominent players in the Closed Loop Hall Current Sensor?
Key companies in the market include Kohshin Electric Corporation, Honeywell International, Inc, Acrel, Electrohms, YHDC, Nanjing Chieful Science & Technology, LEM, ChenYang Technologies GmbH & Co. KG, TAMURA, VACUUMSCHMELZE, Danisense, TDK, ABB, Telcon, Shenzhen Socan Technology, SENIS.
3. What are the main segments of the Closed Loop Hall Current Sensor?
The market segments include Application, Type.
4. Can you provide details about the market size?
The market size is estimated to be USD XXX N/A as of 2022.
5. What are some drivers contributing to market growth?
N/A
6. What are the notable trends driving market growth?
N/A
7. Are there any restraints impacting market growth?
N/A
8. Can you provide examples of recent developments in the market?
N/A
9. What pricing options are available for accessing the report?
Pricing options include single-user, multi-user, and enterprise licenses priced at USD 3950.00, USD 5925.00, and USD 7900.00 respectively.
10. Is the market size provided in terms of value or volume?
The market size is provided in terms of value, measured in N/A and volume, measured in K.
11. Are there any specific market keywords associated with the report?
Yes, the market keyword associated with the report is "Closed Loop Hall Current Sensor," which aids in identifying and referencing the specific market segment covered.
12. How do I determine which pricing option suits my needs best?
The pricing options vary based on user requirements and access needs. Individual users may opt for single-user licenses, while businesses requiring broader access may choose multi-user or enterprise licenses for cost-effective access to the report.
13. Are there any additional resources or data provided in the Closed Loop Hall Current Sensor report?
While the report offers comprehensive insights, it's advisable to review the specific contents or supplementary materials provided to ascertain if additional resources or data are available.
14. How can I stay updated on further developments or reports in the Closed Loop Hall Current Sensor?
To stay informed about further developments, trends, and reports in the Closed Loop Hall Current Sensor, consider subscribing to industry newsletters, following relevant companies and organizations, or regularly checking reputable industry news sources and publications.
Methodology
Step 1 - Identification of Relevant Samples Size from Population Database


Step 2 - Approaches for Defining Global Market Size (Value, Volume* & Price*)

Note*: In applicable scenarios
Step 3 - Data Sources
Primary Research
- Web Analytics
- Survey Reports
- Research Institute
- Latest Research Reports
- Opinion Leaders
Secondary Research
- Annual Reports
- White Paper
- Latest Press Release
- Industry Association
- Paid Database
- Investor Presentations

Step 4 - Data Triangulation
Involves using different sources of information in order to increase the validity of a study
These sources are likely to be stakeholders in a program - participants, other researchers, program staff, other community members, and so on.
Then we put all data in single framework & apply various statistical tools to find out the dynamic on the market.
During the analysis stage, feedback from the stakeholder groups would be compared to determine areas of agreement as well as areas of divergence