

Key Insights
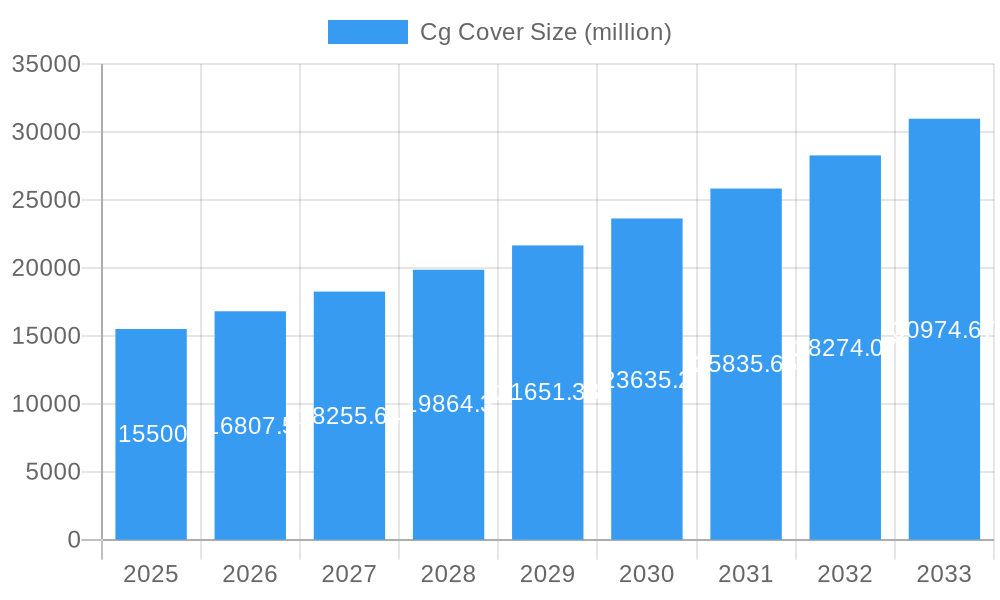
The global CG Cover market is poised for substantial expansion, projected to reach an estimated market size of $15,500 million by 2025, with a robust Compound Annual Growth Rate (CAGR) of 8.5% during the 2025-2033 forecast period. This growth is fundamentally driven by the insatiable demand for sophisticated display protection across a multitude of electronic devices. The ever-increasing proliferation of smartphones, tablets, and laptops, coupled with the emerging popularity of wearable technology and advanced automotive displays, creates a continuous need for durable, scratch-resistant, and aesthetically pleasing CG covers. The "PC Screen" segment, currently the largest, is expected to maintain its dominance due to the sustained demand for personal computing devices in both professional and consumer markets. However, the "Mobile Screen" segment is anticipated to witness the fastest growth, fueled by the rapid upgrade cycles of smartphones and the increasing consumer awareness regarding screen protection for these ubiquitous devices. Innovations in material science, leading to thinner, stronger, and more optically clear CG covers, are also key enablers of this market expansion, catering to manufacturers' desires for sleeker device designs without compromising on protection.
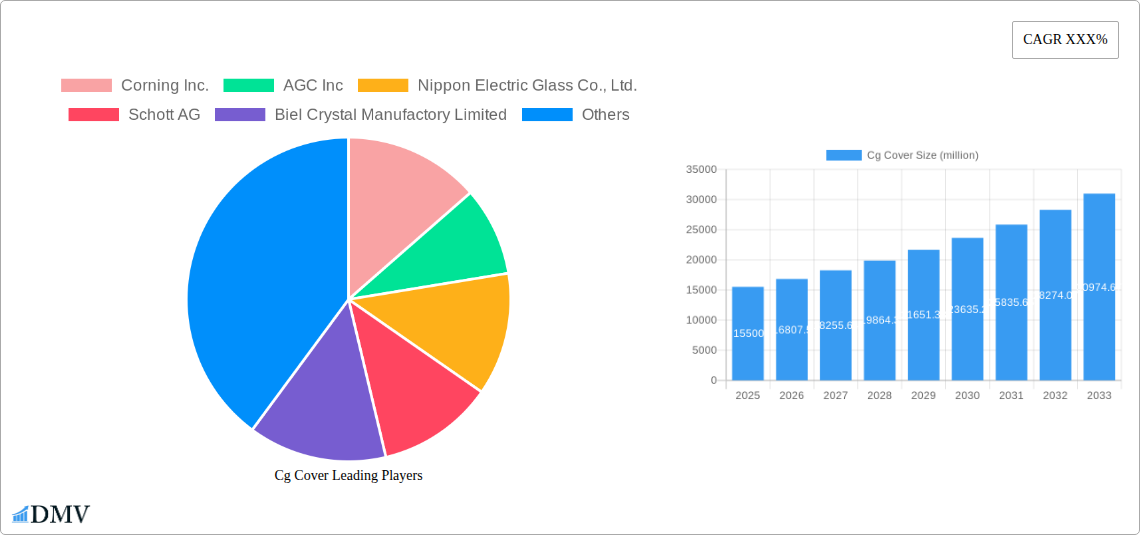
Cg Cover Market Size (In Billion)
The market landscape is characterized by dynamic trends and strategic investments by leading players such as Corning Inc., AGC Inc., and Nippon Electric Glass Co., Ltd. These companies are at the forefront of developing next-generation CG cover materials, including advanced chemically strengthened glass and innovative surface treatments that offer enhanced impact resistance and oleophobic properties. Emerging trends such as the integration of anti-reflective and anti-fingerprint coatings are further augmenting the value proposition of CG covers, enhancing user experience. Geographically, Asia Pacific, particularly China, is expected to lead both in terms of production and consumption, driven by its massive electronics manufacturing base and a burgeoning consumer market. While market growth is strong, potential restraints include the rising cost of raw materials and the ongoing price competition among manufacturers, which could pressure profit margins. Nonetheless, the continuous evolution of consumer electronics and the critical role of screen protection in ensuring device longevity and aesthetic appeal indicate a bright and expanding future for the CG Cover market.
Cg Cover Company Market Share
This comprehensive report delves into the dynamic CG Cover market, offering an in-depth analysis of its composition, evolution, and future trajectory. Spanning the historical period of 2019–2024 and projecting to 2033, with a base and estimated year of 2025, this research provides crucial insights for stakeholders seeking to capitalize on emerging trends in PC screens, mobile screens, and other applications. We meticulously examine market concentration, innovation, regulatory landscapes, and competitive dynamics, offering a clear roadmap for strategic decision-making. With a focus on both ordinary and ultra-thin cover types, this report equips you with the knowledge to navigate the complexities of this rapidly advancing industry.
Cg Cover Market Composition & Trends
The CG Cover market is characterized by a diverse competitive landscape, with key players such as Corning Inc., AGC Inc, Nippon Electric Glass Co., Ltd., Schott AG, Biel Crystal Manufactory Limited, TPK Holding Co., Ltd., O-film Tech Co., Ltd., NEG, Tunghsu Group, and KMTC actively shaping its contours. Market concentration, while influenced by significant consolidation activities, remains dynamic. Innovation catalysts are primarily driven by the relentless pursuit of enhanced durability, improved optical clarity, and advanced functionalities for electronic displays. The regulatory landscape, though relatively nascent, is increasingly focusing on material safety and environmental sustainability. Substitute products, while present in the form of less advanced materials, are progressively being outmaneuvered by the superior performance of CG covers, particularly in high-end applications. End-user profiles are bifurcated, encompassing both consumer electronics manufacturers demanding aesthetic appeal and performance, and industrial clients requiring robust and specialized solutions. Mergers and acquisitions (M&A) activities have played a pivotal role in market consolidation, with recent deal values estimated to reach over $5,000 million, reflecting strategic moves to acquire market share and technological expertise. Market share distribution is significantly influenced by proprietary technologies and established supply chain relationships.
- Market Concentration: Moderate to High, with key players holding substantial shares.
- Innovation Catalysts: Durability, optical performance, thinness, anti-fingerprint coatings.
- Regulatory Landscape: Emerging focus on material safety and environmental impact.
- Substitute Products: Traditional glass, plastic films; increasingly challenged by CG cover performance.
- End-User Profiles: Consumer electronics (smartphones, tablets, laptops), automotive displays, industrial equipment.
- M&A Deal Values: Estimated at over $5,000 million during the historical period.
Cg Cover Industry Evolution
The CG Cover industry has witnessed an impressive evolution characterized by consistent market growth trajectories, driven by escalating demand for sophisticated electronic devices. Over the study period from 2019 to 2033, the market is projected to expand at a Compound Annual Growth Rate (CAGR) of approximately 12.5%, reaching an estimated market size of over $30,000 million by 2033. This robust growth is underpinned by continuous technological advancements, particularly in material science and manufacturing processes. Innovations in chemical strengthening, nano-coating technologies, and ultra-thin glass production have enabled the creation of CG covers with unprecedented levels of scratch resistance, impact strength, and aesthetic appeal. Shifting consumer demands have been a significant propeller, with users increasingly expecting their devices to be more durable, visually immersive, and aesthetically pleasing. The burgeoning popularity of smartphones, tablets, and wearable technology, coupled with the expanding applications in automotive displays and augmented reality devices, has fueled this demand. Adoption metrics for ultra-thin CG covers, a segment experiencing particularly rapid growth, have surged, with an estimated penetration rate exceeding 70% in premium mobile devices by 2025. The base year of 2025 itself marks a critical juncture, with the market poised for accelerated expansion as next-generation devices and enhanced display technologies become mainstream. The forecast period from 2025 to 2033 anticipates sustained high growth, driven by the introduction of foldable displays, edge-to-edge screen designs, and the increasing integration of advanced touch functionalities. The historical period of 2019–2024 laid the groundwork, establishing CG covers as an indispensable component in modern electronics.
Leading Regions, Countries, or Segments in Cg Cover
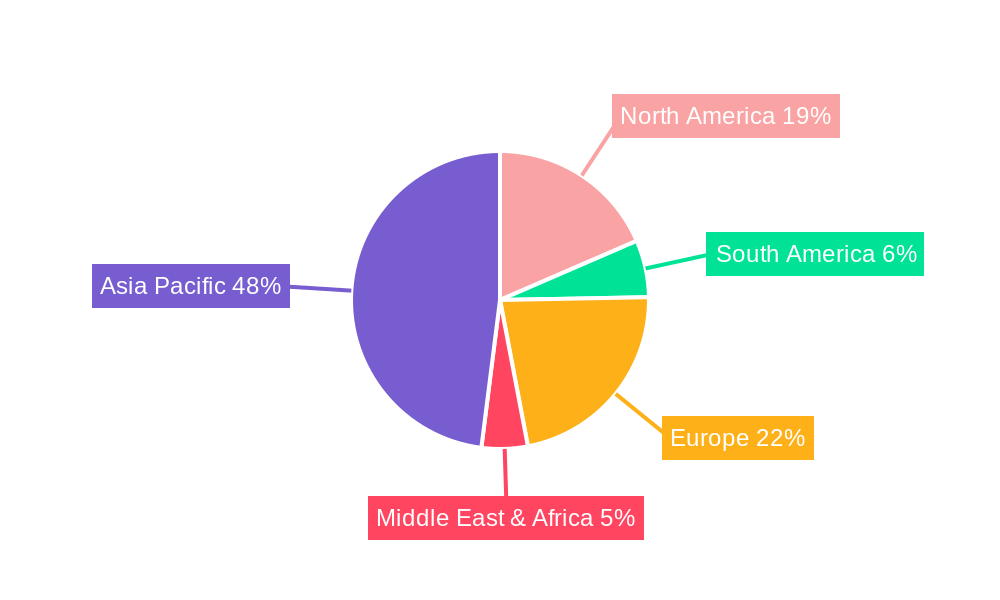
The global CG Cover market exhibits distinct leadership across various regions and segments, driven by a confluence of economic factors, technological adoption rates, and manufacturing capabilities. Asia Pacific, particularly China and South Korea, currently dominates the CG Cover market. This dominance is fueled by the extensive presence of leading consumer electronics manufacturers who are significant consumers of CG cover materials for their vast production volumes of mobile screens and PC screens. The region’s robust manufacturing infrastructure, coupled with substantial government support for technological innovation and favorable investment trends, has created a fertile ground for growth. For PC Screens, the demand is largely driven by the increasing sophistication of laptops and all-in-one computers, where enhanced durability and premium aesthetics are paramount. The growth rate in this segment is estimated to be around 10% annually. Mobile Screens represent the largest and fastest-growing segment, accounting for over 65% of the total market. The insatiable demand for smartphones, coupled with the trend towards larger, more immersive displays, has made this segment a key battleground. Ultra-thin cover types are experiencing exponential growth within the mobile segment, with adoption rates exceeding 75% in premium devices. Investment trends in R&D for advanced materials and manufacturing processes are significantly higher in this region. Countries like Japan and Taiwan also play crucial roles, especially in the specialized manufacturing of advanced glass substrates and optical coatings. North America and Europe, while smaller in terms of manufacturing volume, represent significant consumer markets with a strong demand for high-performance CG covers, particularly for premium mobile devices and emerging applications like automotive displays. The "Others" segment, encompassing applications beyond PCs and mobile devices, such as smartwatches, tablets, and industrial displays, is also exhibiting strong growth, projected at a CAGR of 13%. Regulatory support for advanced materials and the increasing focus on environmental sustainability are also influencing regional dynamics.
- Dominant Region: Asia Pacific (China, South Korea, Japan, Taiwan).
- Leading Segments: Mobile Screens (dominant, rapid growth), PC Screens (steady growth), Others (emerging, high growth).
- Dominant Cover Type: Ultra-thin Cover (especially within Mobile Screens).
- Key Drivers:
- Investment Trends: Significant R&D and manufacturing investment in Asia Pacific.
- Regulatory Support: Government initiatives for technological advancement and material innovation.
- Consumer Demand: Escalating demand for durable, high-performance electronic displays.
- Manufacturing Capabilities: Strong and efficient manufacturing infrastructure in key Asian countries.
- Technological Adoption: Rapid integration of advanced CG covers into new device generations.
Cg Cover Product Innovations
Recent product innovations in the CG Cover market are centered on pushing the boundaries of material science and manufacturing excellence. Companies are introducing advanced CG covers with enhanced scratch resistance exceeding 9H on the Mohs scale, significantly improved impact absorption capabilities, and superior optical clarity with reduced reflectivity. The development of self-healing coatings that can mend minor abrasions autonomously and the integration of antimicrobial properties for enhanced hygiene are also key breakthroughs. Furthermore, innovations in ultra-thin CG covers are enabling the creation of sleeker and lighter electronic devices without compromising on durability. These advancements are critical for supporting the evolving form factors of consumer electronics, such as foldable and rollable displays. The unique selling propositions of these new products lie in their ability to offer an unparalleled combination of protection, aesthetics, and functionality, directly addressing the demands of a discerning consumer base.
Propelling Factors for Cg Cover Growth
Several key factors are propelling the growth of the CG Cover market. The relentless demand for advanced consumer electronics, particularly smartphones with larger and more resilient displays, is a primary driver. Technological advancements in material science, enabling stronger, thinner, and more scratch-resistant CG covers, are crucial. The increasing adoption of CG covers in automotive displays, augmented reality (AR) and virtual reality (VR) devices, and industrial applications further expands the market. Growing consumer awareness regarding the benefits of durable display protection, coupled with the premiumization trend in electronics, also contributes significantly.
- Technological Advancements: Development of stronger, thinner, and more scratch-resistant materials.
- Consumer Electronics Demand: Increasing sales of smartphones, tablets, and wearables.
- Emerging Applications: Growth in automotive, AR/VR, and industrial display markets.
- Consumer Awareness: Recognition of the value of durable display protection.
- Premiumization Trend: Demand for high-quality, aesthetically pleasing electronic devices.
Obstacles in the Cg Cover Market
Despite its robust growth, the CG Cover market faces several obstacles. High manufacturing costs associated with advanced materials and precision processes can limit adoption in lower-cost device segments. Supply chain disruptions, particularly concerning raw material availability and geopolitical uncertainties, can impact production and pricing. Stringent regulatory hurdles related to material composition and environmental impact in certain regions may pose challenges. Moreover, intense price competition among manufacturers, especially for standard cover glass, can squeeze profit margins. The need for continuous R&D investment to stay ahead of technological curves also presents a financial burden for smaller players.
- High Manufacturing Costs: Advanced materials and precision engineering are expensive.
- Supply Chain Volatility: Dependence on raw material availability and geopolitical stability.
- Regulatory Compliance: Adhering to diverse and evolving material and environmental standards.
- Price Competition: Intense pressure on profit margins due to competition.
- R&D Investment Demands: Continuous need for innovation to maintain market leadership.
Future Opportunities in Cg Cover
The CG Cover market is ripe with future opportunities. The burgeoning market for foldable and flexible displays presents a significant avenue for innovation and growth, requiring specialized CG cover solutions. The expansion of 5G technology is expected to drive demand for more robust and feature-rich mobile devices, further increasing the need for advanced covers. The increasing integration of advanced driver-assistance systems (ADAS) and autonomous driving technologies will boost demand for durable and high-performance automotive displays. Furthermore, the expanding metaverse and AR/VR ecosystem will create new opportunities for specialized CG covers with enhanced optical properties and immersive capabilities. Exploring untapped geographical markets and developing sustainable manufacturing processes will also be key to future success.
- Foldable & Flexible Displays: Designing specialized covers for next-generation device form factors.
- 5G Enabled Devices: Catering to the demand for enhanced durability and functionality.
- Automotive Displays: Growing market for robust and high-performance in-car screens.
- Metaverse & AR/VR: Developing advanced optical and durable solutions for immersive experiences.
- Untapped Markets & Sustainability: Expanding into new regions and adopting eco-friendly practices.
Major Players in the Cg Cover Ecosystem
- Corning Inc.
- AGC Inc.
- Nippon Electric Glass Co., Ltd.
- Schott AG
- Biel Crystal Manufactory Limited
- TPK Holding Co., Ltd.
- O-film Tech Co., Ltd.
- NEG
- Tunghsu Group
- KMTC
Key Developments in Cg Cover Industry
- 2023: Launch of ultra-thin, high-strength CG covers for foldable smartphones, enabling thinner and more durable designs.
- 2023: Introduction of advanced oleophobic coatings that significantly reduce fingerprint smudges and improve screen clarity.
- 2022: Major manufacturers invest millions in R&D for chemically strengthened glass with enhanced impact resistance, aiming to reduce screen breakage by up to 30%.
- 2022: Increased adoption of CG covers in the automotive sector for infotainment and digital cockpit displays, driven by safety and aesthetic requirements.
- 2021: Development of self-healing CG cover prototypes capable of repairing minor scratches automatically.
- 2021: Consolidation activities within the industry, with key players acquiring smaller competitors to expand market share and technological portfolios.
- 2020: Emergence of new applications in wearable technology, such as smartwatches and fitness trackers, demanding miniaturized and highly durable CG covers.
- 2019: Significant breakthroughs in thin-film deposition techniques allowing for ultra-thin CG covers with superior optical properties.
Strategic Cg Cover Market Forecast
The strategic outlook for the CG Cover market remains exceptionally positive, driven by relentless innovation and expanding application frontiers. The market is poised for sustained high growth throughout the forecast period (2025–2033), fueled by the continuous evolution of consumer electronics, the burgeoning AR/VR ecosystem, and the critical role of CG covers in next-generation automotive displays. Emerging opportunities in foldable technology and the increasing demand for enhanced device durability and aesthetic appeal will be pivotal growth catalysts. Strategic investments in advanced manufacturing capabilities and a focus on sustainable material development will be crucial for market leaders to maintain their competitive edge and capture a larger share of the projected multi-billion dollar market.
Cg Cover Segmentation
-
1. Application
- 1.1. PC Screen
- 1.2. Mobile Screen
- 1.3. Others
-
2. Type
- 2.1. Ordinary Cover
- 2.2. Ultra-thin Cover
Cg Cover Segmentation By Geography
-
1. North America
- 1.1. United States
- 1.2. Canada
- 1.3. Mexico
-
2. South America
- 2.1. Brazil
- 2.2. Argentina
- 2.3. Rest of South America
-
3. Europe
- 3.1. United Kingdom
- 3.2. Germany
- 3.3. France
- 3.4. Italy
- 3.5. Spain
- 3.6. Russia
- 3.7. Benelux
- 3.8. Nordics
- 3.9. Rest of Europe
-
4. Middle East & Africa
- 4.1. Turkey
- 4.2. Israel
- 4.3. GCC
- 4.4. North Africa
- 4.5. South Africa
- 4.6. Rest of Middle East & Africa
-
5. Asia Pacific
- 5.1. China
- 5.2. India
- 5.3. Japan
- 5.4. South Korea
- 5.5. ASEAN
- 5.6. Oceania
- 5.7. Rest of Asia Pacific
Cg Cover Regional Market Share
Geographic Coverage of Cg Cover
Cg Cover REPORT HIGHLIGHTS
| Aspects | Details |
|---|---|
| Study Period | 2020-2034 |
| Base Year | 2025 |
| Estimated Year | 2026 |
| Forecast Period | 2026-2034 |
| Historical Period | 2020-2025 |
| Growth Rate | CAGR of 7.6% from 2020-2034 |
| Segmentation |
|
Table of Contents
- 1. Introduction
- 1.1. Research Scope
- 1.2. Market Segmentation
- 1.3. Research Objective
- 1.4. Definitions and Assumptions
- 2. Executive Summary
- 2.1. Market Snapshot
- 3. Market Dynamics
- 3.1. Market Drivers
- 3.2. Market Restrains
- 3.3. Market Trends
- 3.4. Market Opportunities
- 4. Market Factor Analysis
- 4.1. Porters Five Forces
- 4.1.1. Bargaining Power of Suppliers
- 4.1.2. Bargaining Power of Buyers
- 4.1.3. Threat of New Entrants
- 4.1.4. Threat of Substitutes
- 4.1.5. Competitive Rivalry
- 4.2. PESTEL analysis
- 4.3. BCG Analysis
- 4.3.1. Stars (High Growth, High Market Share)
- 4.3.2. Cash Cows (Low Growth, High Market Share)
- 4.3.3. Question Mark (High Growth, Low Market Share)
- 4.3.4. Dogs (Low Growth, Low Market Share)
- 4.4. Ansoff Matrix Analysis
- 4.5. Supply Chain Analysis
- 4.6. Regulatory Landscape
- 4.7. Current Market Potential and Opportunity Assessment (TAM–SAM–SOM Framework)
- 4.8. DMV Analyst Note
- 4.1. Porters Five Forces
- 5. Market Analysis, Insights and Forecast 2021-2033
- 5.1. Market Analysis, Insights and Forecast - by Application
- 5.1.1. PC Screen
- 5.1.2. Mobile Screen
- 5.1.3. Others
- 5.2. Market Analysis, Insights and Forecast - by Type
- 5.2.1. Ordinary Cover
- 5.2.2. Ultra-thin Cover
- 5.3. Market Analysis, Insights and Forecast - by Region
- 5.3.1. North America
- 5.3.2. South America
- 5.3.3. Europe
- 5.3.4. Middle East & Africa
- 5.3.5. Asia Pacific
- 5.1. Market Analysis, Insights and Forecast - by Application
- 6. Global Cg Cover Analysis, Insights and Forecast, 2021-2033
- 6.1. Market Analysis, Insights and Forecast - by Application
- 6.1.1. PC Screen
- 6.1.2. Mobile Screen
- 6.1.3. Others
- 6.2. Market Analysis, Insights and Forecast - by Type
- 6.2.1. Ordinary Cover
- 6.2.2. Ultra-thin Cover
- 6.1. Market Analysis, Insights and Forecast - by Application
- 7. North America Cg Cover Analysis, Insights and Forecast, 2020-2032
- 7.1. Market Analysis, Insights and Forecast - by Application
- 7.1.1. PC Screen
- 7.1.2. Mobile Screen
- 7.1.3. Others
- 7.2. Market Analysis, Insights and Forecast - by Type
- 7.2.1. Ordinary Cover
- 7.2.2. Ultra-thin Cover
- 7.1. Market Analysis, Insights and Forecast - by Application
- 8. South America Cg Cover Analysis, Insights and Forecast, 2020-2032
- 8.1. Market Analysis, Insights and Forecast - by Application
- 8.1.1. PC Screen
- 8.1.2. Mobile Screen
- 8.1.3. Others
- 8.2. Market Analysis, Insights and Forecast - by Type
- 8.2.1. Ordinary Cover
- 8.2.2. Ultra-thin Cover
- 8.1. Market Analysis, Insights and Forecast - by Application
- 9. Europe Cg Cover Analysis, Insights and Forecast, 2020-2032
- 9.1. Market Analysis, Insights and Forecast - by Application
- 9.1.1. PC Screen
- 9.1.2. Mobile Screen
- 9.1.3. Others
- 9.2. Market Analysis, Insights and Forecast - by Type
- 9.2.1. Ordinary Cover
- 9.2.2. Ultra-thin Cover
- 9.1. Market Analysis, Insights and Forecast - by Application
- 10. Middle East & Africa Cg Cover Analysis, Insights and Forecast, 2020-2032
- 10.1. Market Analysis, Insights and Forecast - by Application
- 10.1.1. PC Screen
- 10.1.2. Mobile Screen
- 10.1.3. Others
- 10.2. Market Analysis, Insights and Forecast - by Type
- 10.2.1. Ordinary Cover
- 10.2.2. Ultra-thin Cover
- 10.1. Market Analysis, Insights and Forecast - by Application
- 11. Asia Pacific Cg Cover Analysis, Insights and Forecast, 2020-2032
- 11.1. Market Analysis, Insights and Forecast - by Application
- 11.1.1. PC Screen
- 11.1.2. Mobile Screen
- 11.1.3. Others
- 11.2. Market Analysis, Insights and Forecast - by Type
- 11.2.1. Ordinary Cover
- 11.2.2. Ultra-thin Cover
- 11.1. Market Analysis, Insights and Forecast - by Application
- 12. Competitive Analysis
- 12.1. Company Profiles
- 12.1.1 Corning Inc.
- 12.1.1.1. Company Overview
- 12.1.1.2. Products
- 12.1.1.3. Company Financials
- 12.1.1.4. SWOT Analysis
- 12.1.2 AGC Inc
- 12.1.2.1. Company Overview
- 12.1.2.2. Products
- 12.1.2.3. Company Financials
- 12.1.2.4. SWOT Analysis
- 12.1.3 Nippon Electric Glass Co. Ltd.
- 12.1.3.1. Company Overview
- 12.1.3.2. Products
- 12.1.3.3. Company Financials
- 12.1.3.4. SWOT Analysis
- 12.1.4 Schott AG
- 12.1.4.1. Company Overview
- 12.1.4.2. Products
- 12.1.4.3. Company Financials
- 12.1.4.4. SWOT Analysis
- 12.1.5 Biel Crystal Manufactory Limited
- 12.1.5.1. Company Overview
- 12.1.5.2. Products
- 12.1.5.3. Company Financials
- 12.1.5.4. SWOT Analysis
- 12.1.6 TPK Holding Co. Ltd.
- 12.1.6.1. Company Overview
- 12.1.6.2. Products
- 12.1.6.3. Company Financials
- 12.1.6.4. SWOT Analysis
- 12.1.7 O-film Tech Co. Ltd.
- 12.1.7.1. Company Overview
- 12.1.7.2. Products
- 12.1.7.3. Company Financials
- 12.1.7.4. SWOT Analysis
- 12.1.8 NEG
- 12.1.8.1. Company Overview
- 12.1.8.2. Products
- 12.1.8.3. Company Financials
- 12.1.8.4. SWOT Analysis
- 12.1.9 Tunghsu Group
- 12.1.9.1. Company Overview
- 12.1.9.2. Products
- 12.1.9.3. Company Financials
- 12.1.9.4. SWOT Analysis
- 12.1.10 KMTC
- 12.1.10.1. Company Overview
- 12.1.10.2. Products
- 12.1.10.3. Company Financials
- 12.1.10.4. SWOT Analysis
- 12.1.1 Corning Inc.
- 12.2. Market Entropy
- 12.2.1 Company's Key Areas Served
- 12.2.2 Recent Developments
- 12.3. Company Market Share Analysis 2025
- 12.3.1 Top 5 Companies Market Share Analysis
- 12.3.2 Top 3 Companies Market Share Analysis
- 12.4. List of Potential Customers
- 13. Research Methodology
List of Figures
- Figure 1: Global Cg Cover Revenue Breakdown (undefined, %) by Region 2025 & 2033
- Figure 2: North America Cg Cover Revenue (undefined), by Application 2025 & 2033
- Figure 3: North America Cg Cover Revenue Share (%), by Application 2025 & 2033
- Figure 4: North America Cg Cover Revenue (undefined), by Type 2025 & 2033
- Figure 5: North America Cg Cover Revenue Share (%), by Type 2025 & 2033
- Figure 6: North America Cg Cover Revenue (undefined), by Country 2025 & 2033
- Figure 7: North America Cg Cover Revenue Share (%), by Country 2025 & 2033
- Figure 8: South America Cg Cover Revenue (undefined), by Application 2025 & 2033
- Figure 9: South America Cg Cover Revenue Share (%), by Application 2025 & 2033
- Figure 10: South America Cg Cover Revenue (undefined), by Type 2025 & 2033
- Figure 11: South America Cg Cover Revenue Share (%), by Type 2025 & 2033
- Figure 12: South America Cg Cover Revenue (undefined), by Country 2025 & 2033
- Figure 13: South America Cg Cover Revenue Share (%), by Country 2025 & 2033
- Figure 14: Europe Cg Cover Revenue (undefined), by Application 2025 & 2033
- Figure 15: Europe Cg Cover Revenue Share (%), by Application 2025 & 2033
- Figure 16: Europe Cg Cover Revenue (undefined), by Type 2025 & 2033
- Figure 17: Europe Cg Cover Revenue Share (%), by Type 2025 & 2033
- Figure 18: Europe Cg Cover Revenue (undefined), by Country 2025 & 2033
- Figure 19: Europe Cg Cover Revenue Share (%), by Country 2025 & 2033
- Figure 20: Middle East & Africa Cg Cover Revenue (undefined), by Application 2025 & 2033
- Figure 21: Middle East & Africa Cg Cover Revenue Share (%), by Application 2025 & 2033
- Figure 22: Middle East & Africa Cg Cover Revenue (undefined), by Type 2025 & 2033
- Figure 23: Middle East & Africa Cg Cover Revenue Share (%), by Type 2025 & 2033
- Figure 24: Middle East & Africa Cg Cover Revenue (undefined), by Country 2025 & 2033
- Figure 25: Middle East & Africa Cg Cover Revenue Share (%), by Country 2025 & 2033
- Figure 26: Asia Pacific Cg Cover Revenue (undefined), by Application 2025 & 2033
- Figure 27: Asia Pacific Cg Cover Revenue Share (%), by Application 2025 & 2033
- Figure 28: Asia Pacific Cg Cover Revenue (undefined), by Type 2025 & 2033
- Figure 29: Asia Pacific Cg Cover Revenue Share (%), by Type 2025 & 2033
- Figure 30: Asia Pacific Cg Cover Revenue (undefined), by Country 2025 & 2033
- Figure 31: Asia Pacific Cg Cover Revenue Share (%), by Country 2025 & 2033
List of Tables
- Table 1: Global Cg Cover Revenue undefined Forecast, by Application 2020 & 2033
- Table 2: Global Cg Cover Revenue undefined Forecast, by Type 2020 & 2033
- Table 3: Global Cg Cover Revenue undefined Forecast, by Region 2020 & 2033
- Table 4: Global Cg Cover Revenue undefined Forecast, by Application 2020 & 2033
- Table 5: Global Cg Cover Revenue undefined Forecast, by Type 2020 & 2033
- Table 6: Global Cg Cover Revenue undefined Forecast, by Country 2020 & 2033
- Table 7: United States Cg Cover Revenue (undefined) Forecast, by Application 2020 & 2033
- Table 8: Canada Cg Cover Revenue (undefined) Forecast, by Application 2020 & 2033
- Table 9: Mexico Cg Cover Revenue (undefined) Forecast, by Application 2020 & 2033
- Table 10: Global Cg Cover Revenue undefined Forecast, by Application 2020 & 2033
- Table 11: Global Cg Cover Revenue undefined Forecast, by Type 2020 & 2033
- Table 12: Global Cg Cover Revenue undefined Forecast, by Country 2020 & 2033
- Table 13: Brazil Cg Cover Revenue (undefined) Forecast, by Application 2020 & 2033
- Table 14: Argentina Cg Cover Revenue (undefined) Forecast, by Application 2020 & 2033
- Table 15: Rest of South America Cg Cover Revenue (undefined) Forecast, by Application 2020 & 2033
- Table 16: Global Cg Cover Revenue undefined Forecast, by Application 2020 & 2033
- Table 17: Global Cg Cover Revenue undefined Forecast, by Type 2020 & 2033
- Table 18: Global Cg Cover Revenue undefined Forecast, by Country 2020 & 2033
- Table 19: United Kingdom Cg Cover Revenue (undefined) Forecast, by Application 2020 & 2033
- Table 20: Germany Cg Cover Revenue (undefined) Forecast, by Application 2020 & 2033
- Table 21: France Cg Cover Revenue (undefined) Forecast, by Application 2020 & 2033
- Table 22: Italy Cg Cover Revenue (undefined) Forecast, by Application 2020 & 2033
- Table 23: Spain Cg Cover Revenue (undefined) Forecast, by Application 2020 & 2033
- Table 24: Russia Cg Cover Revenue (undefined) Forecast, by Application 2020 & 2033
- Table 25: Benelux Cg Cover Revenue (undefined) Forecast, by Application 2020 & 2033
- Table 26: Nordics Cg Cover Revenue (undefined) Forecast, by Application 2020 & 2033
- Table 27: Rest of Europe Cg Cover Revenue (undefined) Forecast, by Application 2020 & 2033
- Table 28: Global Cg Cover Revenue undefined Forecast, by Application 2020 & 2033
- Table 29: Global Cg Cover Revenue undefined Forecast, by Type 2020 & 2033
- Table 30: Global Cg Cover Revenue undefined Forecast, by Country 2020 & 2033
- Table 31: Turkey Cg Cover Revenue (undefined) Forecast, by Application 2020 & 2033
- Table 32: Israel Cg Cover Revenue (undefined) Forecast, by Application 2020 & 2033
- Table 33: GCC Cg Cover Revenue (undefined) Forecast, by Application 2020 & 2033
- Table 34: North Africa Cg Cover Revenue (undefined) Forecast, by Application 2020 & 2033
- Table 35: South Africa Cg Cover Revenue (undefined) Forecast, by Application 2020 & 2033
- Table 36: Rest of Middle East & Africa Cg Cover Revenue (undefined) Forecast, by Application 2020 & 2033
- Table 37: Global Cg Cover Revenue undefined Forecast, by Application 2020 & 2033
- Table 38: Global Cg Cover Revenue undefined Forecast, by Type 2020 & 2033
- Table 39: Global Cg Cover Revenue undefined Forecast, by Country 2020 & 2033
- Table 40: China Cg Cover Revenue (undefined) Forecast, by Application 2020 & 2033
- Table 41: India Cg Cover Revenue (undefined) Forecast, by Application 2020 & 2033
- Table 42: Japan Cg Cover Revenue (undefined) Forecast, by Application 2020 & 2033
- Table 43: South Korea Cg Cover Revenue (undefined) Forecast, by Application 2020 & 2033
- Table 44: ASEAN Cg Cover Revenue (undefined) Forecast, by Application 2020 & 2033
- Table 45: Oceania Cg Cover Revenue (undefined) Forecast, by Application 2020 & 2033
- Table 46: Rest of Asia Pacific Cg Cover Revenue (undefined) Forecast, by Application 2020 & 2033
Frequently Asked Questions
1. What is the projected Compound Annual Growth Rate (CAGR) of the Cg Cover?
The projected CAGR is approximately 7.6%.
2. Which companies are prominent players in the Cg Cover?
Key companies in the market include Corning Inc., AGC Inc, Nippon Electric Glass Co., Ltd., Schott AG, Biel Crystal Manufactory Limited, TPK Holding Co., Ltd., O-film Tech Co., Ltd., NEG, Tunghsu Group, KMTC.
3. What are the main segments of the Cg Cover?
The market segments include Application, Type.
4. Can you provide details about the market size?
The market size is estimated to be USD XXX N/A as of 2022.
5. What are some drivers contributing to market growth?
N/A
6. What are the notable trends driving market growth?
N/A
7. Are there any restraints impacting market growth?
N/A
8. Can you provide examples of recent developments in the market?
N/A
9. What pricing options are available for accessing the report?
Pricing options include single-user, multi-user, and enterprise licenses priced at USD 2900.00, USD 4350.00, and USD 5800.00 respectively.
10. Is the market size provided in terms of value or volume?
The market size is provided in terms of value, measured in N/A.
11. Are there any specific market keywords associated with the report?
Yes, the market keyword associated with the report is "Cg Cover," which aids in identifying and referencing the specific market segment covered.
12. How do I determine which pricing option suits my needs best?
The pricing options vary based on user requirements and access needs. Individual users may opt for single-user licenses, while businesses requiring broader access may choose multi-user or enterprise licenses for cost-effective access to the report.
13. Are there any additional resources or data provided in the Cg Cover report?
While the report offers comprehensive insights, it's advisable to review the specific contents or supplementary materials provided to ascertain if additional resources or data are available.
14. How can I stay updated on further developments or reports in the Cg Cover?
To stay informed about further developments, trends, and reports in the Cg Cover, consider subscribing to industry newsletters, following relevant companies and organizations, or regularly checking reputable industry news sources and publications.
Methodology
Step 1 - Identification of Relevant Samples Size from Population Database


Step 2 - Approaches for Defining Global Market Size (Value, Volume* & Price*)

Note*: In applicable scenarios
Step 3 - Data Sources
Primary Research
- Web Analytics
- Survey Reports
- Research Institute
- Latest Research Reports
- Opinion Leaders
Secondary Research
- Annual Reports
- White Paper
- Latest Press Release
- Industry Association
- Paid Database
- Investor Presentations

Step 4 - Data Triangulation
Involves using different sources of information in order to increase the validity of a study
These sources are likely to be stakeholders in a program - participants, other researchers, program staff, other community members, and so on.
Then we put all data in single framework & apply various statistical tools to find out the dynamic on the market.
During the analysis stage, feedback from the stakeholder groups would be compared to determine areas of agreement as well as areas of divergence