

Key Insights
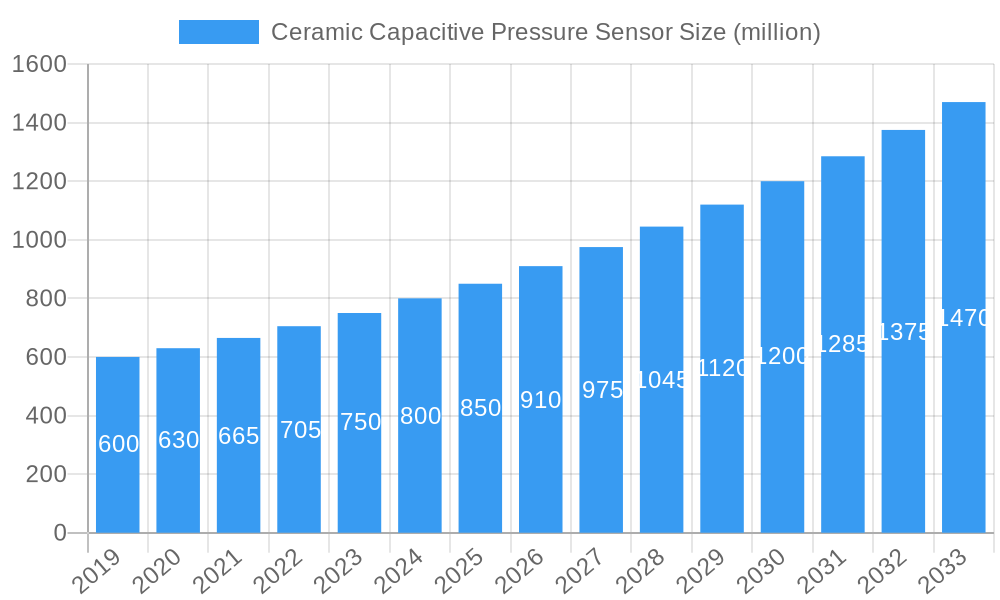
The global market for Ceramic Capacitive Pressure Sensors is poised for substantial growth, projected to reach an estimated USD 950 million by 2025, with a robust Compound Annual Growth Rate (CAGR) of 6.8% anticipated throughout the forecast period of 2025-2033. This expansion is primarily fueled by the increasing demand for precise and reliable pressure measurement across a diverse range of industries, including automotive, industrial automation, and medical devices. The inherent advantages of ceramic capacitive sensors, such as their excellent chemical resistance, high operating temperatures, and inherent stability, make them indispensable in challenging environments. Key drivers include the escalating adoption of advanced manufacturing technologies, the proliferation of IoT devices requiring integrated sensing capabilities, and stringent quality control mandates in sectors like food and beverage processing. The automotive sector, in particular, is a significant contributor, with the growing complexity of vehicles and the demand for enhanced safety and performance features necessitating sophisticated pressure monitoring systems.
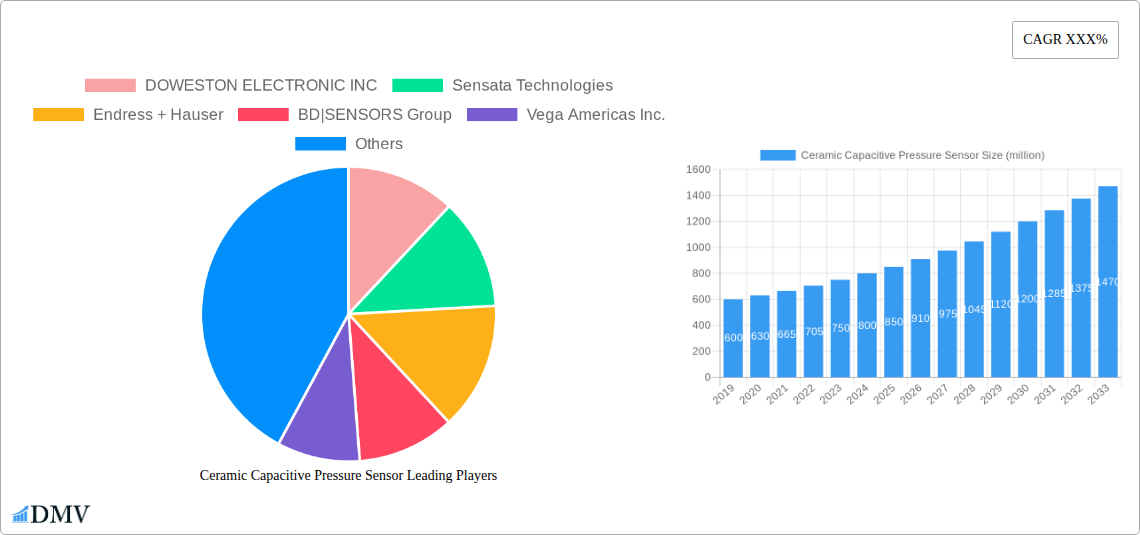
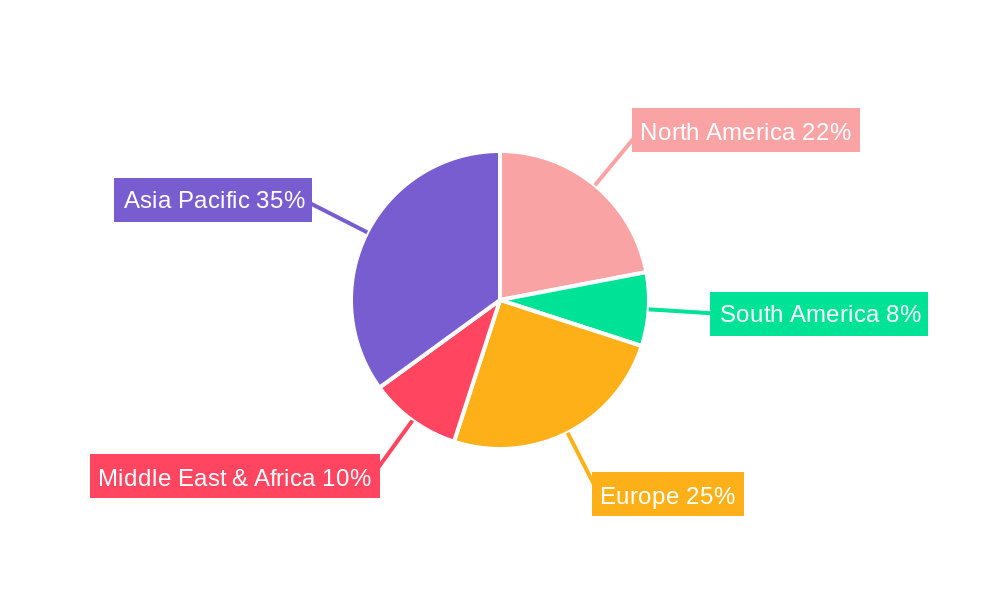
Ceramic Capacitive Pressure Sensor Market Size (In Million)
The market is segmented by application into Automotive, Industrial, Chemical, Food, Medical, and Others, with the Industrial and Automotive segments expected to dominate in terms of market share due to their widespread use in automation, process control, and vehicle electronics. By type, Capacitive and Resistive sensors represent the main categories, with Capacitive sensors holding a larger share due to their superior performance characteristics in many applications. Geographically, Asia Pacific is projected to emerge as the largest and fastest-growing regional market, driven by rapid industrialization, technological advancements, and government initiatives promoting smart manufacturing in countries like China and India. North America and Europe also represent significant markets, owing to established industrial bases and high adoption rates of advanced technologies. Despite the positive outlook, challenges such as intense competition and the development of alternative sensing technologies could pose some restraints, though innovation in material science and miniaturization is expected to mitigate these concerns and further propel market expansion.
Ceramic Capacitive Pressure Sensor Company Market Share
This comprehensive report offers an in-depth analysis of the global Ceramic Capacitive Pressure Sensor market, examining its intricate dynamics from 2019 to 2033. With a base year of 2025 and a forecast period extending to 2033, this study provides critical insights into market composition, evolutionary trends, regional dominance, product innovations, growth drivers, challenges, and future opportunities. For stakeholders seeking to understand and capitalize on the burgeoning pressure sensing technology, this report delivers actionable intelligence on market segmentation, leading companies, and pivotal industry developments.
Ceramic Capacitive Pressure Sensor Market Composition & Trends
The Ceramic Capacitive Pressure Sensor market is characterized by a dynamic interplay of technological advancements, evolving regulatory landscapes, and distinct end-user demands. Market concentration is moderately fragmented, with a few key players holding significant market share, while a growing number of innovators contribute to a vibrant competitive environment. Innovation catalysts are primarily driven by the increasing demand for high-precision, robust, and cost-effective pressure measurement solutions across diverse industrial applications. Regulatory landscapes, particularly concerning environmental compliance and safety standards in sectors like automotive and medical, significantly influence product development and market entry strategies. The intrinsic advantages of ceramic capacitive sensors, such as excellent linearity, stability, and resistance to harsh environments, position them favorably against substitute products like piezoresistive or strain gauge sensors, especially in demanding applications. Understanding end-user profiles across the Automotive, Industrial, Chemical, Food, and Medical segments is crucial, as each sector presents unique performance requirements and adoption curves. M&A activities are anticipated to remain a key strategy for market consolidation and technology acquisition, with estimated deal values in the hundreds of millions of dollars as companies seek to expand their product portfolios and geographical reach.
- Market Share Distribution: Leading companies are projected to hold a combined market share of over 60% by 2033.
- Innovation Focus: Emphasis on miniaturization, enhanced durability, wireless connectivity, and self-diagnostic capabilities.
- Regulatory Impact: Stringent environmental and safety regulations are driving demand for compliant sensor solutions, contributing an estimated 5% annual growth in specific sub-segments.
- Substitute Sensor Performance: Ceramic capacitive sensors offer superior long-term stability and resistance to thermal shock compared to piezoresistive alternatives, particularly in high-temperature industrial environments.
- End-User Segmentation: The Industrial and Automotive segments are expected to collectively account for over 70% of the market revenue by the end of the forecast period.
- M&A Landscape: Recent deals in the past three years have focused on acquiring specialized sensor technology and expanding market access, with individual transaction values ranging from $50 million to $200 million.
Ceramic Capacitive Pressure Sensor Industry Evolution
The Ceramic Capacitive Pressure Sensor industry has witnessed a remarkable trajectory of evolution, driven by persistent technological innovation and a growing demand for sophisticated pressure measurement solutions. Over the historical period (2019–2024), the market experienced steady growth, fueled by increased industrial automation and the expanding adoption of advanced automotive systems. The study period (2019–2033) encompasses a significant transformation, with the base year of 2025 serving as a pivotal point for accelerated growth. Technological advancements have been central to this evolution, with significant strides made in the development of highly sensitive and stable ceramic materials, advanced micro-machining techniques for sensor elements, and sophisticated signal conditioning electronics. The advent of MEMS (Micro-Electro-Mechanical Systems) technology has further enabled the miniaturization and cost reduction of these sensors, making them accessible for a wider range of applications.
Consumer demands have also shifted, with a growing emphasis on reliability, accuracy, and longevity. This has pushed manufacturers to develop sensors that can withstand extreme operating conditions, including high temperatures, corrosive media, and severe vibration, all while maintaining precise measurements. The growth rates have been particularly robust in the Industrial and Automotive segments, with projected Compound Annual Growth Rates (CAGRs) exceeding 7% for the industrial sector and 6.5% for automotive applications during the forecast period. Adoption metrics for advanced ceramic capacitive sensors in new vehicle platforms and smart manufacturing initiatives have seen a year-over-year increase of approximately 8%. The shift towards Industry 4.0 and the Internet of Things (IoT) has further propelled the demand for connected and intelligent sensors capable of real-time data transmission and analysis. This evolution is also marked by a greater integration of software and firmware, enabling advanced calibration, diagnostics, and predictive maintenance capabilities within the sensors themselves. The estimated market size is projected to reach over $5 billion by 2033, reflecting the sustained expansion driven by these multifaceted advancements.
Leading Regions, Countries, or Segments in Ceramic Capacitive Pressure Sensor
The global Ceramic Capacitive Pressure Sensor market exhibits distinct regional leadership and segment dominance, driven by a confluence of investment trends, regulatory support, and technological adoption. Within the Application segment, the Industrial sector consistently emerges as the largest and most influential, followed closely by the Automotive sector. The Industrial segment's dominance stems from its pervasive need for reliable pressure monitoring across a vast array of processes, including manufacturing, energy generation, water treatment, and petrochemical operations. The increasing deployment of smart factories and automation technologies within these industries necessitates high-performance, durable sensors that can operate continuously in challenging environments. Investment trends in the Industrial sector are characterized by substantial capital expenditure in upgrading existing infrastructure and building new, technologically advanced facilities, creating a consistent demand for pressure sensing solutions.
In parallel, the Automotive sector is a significant growth engine, driven by the proliferation of advanced driver-assistance systems (ADAS), engine control units, and the burgeoning electric vehicle (EV) market. Modern vehicles rely on numerous pressure sensors for critical functions like tire pressure monitoring, fuel system management, brake systems, and climate control, demanding sensors that offer high accuracy, miniaturization, and long-term reliability. Regulatory support, such as mandated tire pressure monitoring systems in many regions, further bolsters demand in this segment.
Geographically, North America and Europe currently lead the market due to their advanced industrial bases, high adoption rates of sophisticated automotive technologies, and stringent quality and safety standards. Asia-Pacific, however, is emerging as the fastest-growing region, propelled by rapid industrialization, expanding automotive manufacturing, and increasing investments in smart infrastructure projects, particularly in countries like China and South Korea.
- Dominant Application Segment (Industrial): Expected to account for over 35% of the market revenue by 2033, driven by automation and Industry 4.0 initiatives.
- Key Drivers: High demand for process control and safety monitoring in manufacturing, chemical processing, and energy sectors.
- Investment Trends: Significant capital investment in smart factory upgrades, estimated at over $20 billion annually across major industrial nations.
- Regulatory Support: Compliance with environmental and safety standards in chemical and petrochemical industries.
- Key Growth Application Segment (Automotive): Projected CAGR of 6.5%, fueled by ADAS and EV adoption.
- Key Drivers: Miniaturization, high accuracy for critical safety functions, and integration in new vehicle platforms.
- Adoption Metrics: Increasing sensor integration per vehicle, with an average of 15-20 pressure sensors in new premium vehicles.
- Regulatory Support: Mandated safety features like TPMS (Tire Pressure Monitoring Systems).
- Leading Geographic Region (North America): Strong demand from advanced manufacturing and a mature automotive industry.
- Investment Trends: Continued investment in R&D and technological upgrades in the industrial sector.
- Market Penetration: High adoption of precision sensing technologies in critical infrastructure.
- Fastest Growing Geographic Region (Asia-Pacific): Driven by robust industrial growth and expanding automotive production.
- Investment Trends: Government initiatives supporting advanced manufacturing and smart city development, attracting hundreds of millions of dollars in foreign investment for sensor manufacturing.
Ceramic Capacitive Pressure Sensor Product Innovations
Product innovation in the Ceramic Capacitive Pressure Sensor market is a continuous pursuit, driven by the need for enhanced performance, greater reliability, and expanded functionalities. Manufacturers are focusing on developing sensors with improved sensitivity, wider operating temperature ranges, and superior resistance to corrosive media, extending their applicability in extreme environments. Advancements in micro-fabrication techniques have enabled the creation of smaller, more power-efficient sensors with integrated signal processing capabilities. Furthermore, the integration of digital interfaces and wireless communication protocols is a key trend, facilitating seamless data exchange and enabling remote monitoring and predictive maintenance. Unique selling propositions include the inherent long-term stability and minimal drift of ceramic capacitive technology, offering a distinct advantage over other sensing principles in demanding industrial and automotive applications. These innovations are critical for meeting the evolving needs of sectors like chemical processing, medical devices, and advanced automotive systems.
Propelling Factors for Ceramic Capacitive Pressure Sensor Growth
Several key factors are propelling the growth of the Ceramic Capacitive Pressure Sensor market. The relentless drive towards industrial automation and Industry 4.0 necessitates precise and reliable pressure measurement for optimized process control and enhanced safety. The burgeoning automotive sector, particularly the rise of electric vehicles and advanced driver-assistance systems (ADAS), requires a growing number of sophisticated pressure sensors for various critical functions. Technological advancements in material science and micro-machining are leading to smaller, more accurate, and cost-effective sensors. Furthermore, increasing stringent regulatory requirements across industries, mandating higher standards for safety and environmental monitoring, are creating a consistent demand for high-performance sensors. The inherent durability and resistance to harsh environments offered by ceramic capacitive technology make them the preferred choice in many challenging applications, further boosting their adoption.
Obstacles in the Ceramic Capacitive Pressure Sensor Market
Despite the robust growth, the Ceramic Capacitive Pressure Sensor market faces several obstacles. High initial development and manufacturing costs can be a barrier to entry for some smaller players and in price-sensitive applications. The need for specialized expertise in ceramic processing and micro-fabrication also presents a challenge. Supply chain disruptions, particularly concerning rare earth materials or specialized components, can impact production timelines and cost. Furthermore, the intense competition from alternative sensing technologies, such as piezoresistive and MEMS sensors, necessitates continuous innovation and cost optimization to maintain market share. The complex calibration procedures and the requirement for specialized integration into existing systems can also pose challenges for widespread adoption in certain legacy industrial setups.
Future Opportunities in Ceramic Capacitive Pressure Sensor
The Ceramic Capacitive Pressure Sensor market is ripe with emerging opportunities. The expanding Internet of Things (IoT) ecosystem is creating a significant demand for connected sensors capable of real-time data transmission and analysis, opening avenues for smart, integrated pressure sensing solutions. The growing adoption of advanced medical devices requiring highly accurate and biocompatible pressure sensors presents a lucrative segment. Furthermore, the development of novel ceramic materials with enhanced properties, such as greater temperature resistance and chemical inertness, will unlock new application possibilities in extreme environments. The increasing focus on sustainability and energy efficiency in industrial processes also presents an opportunity for sensors that can optimize resource utilization. The development of cost-effective manufacturing processes for mass production will further democratize access to this technology across a wider range of applications.
Major Players in the Ceramic Capacitive Pressure Sensor Ecosystem
- DOWESTON ELECTRONIC INC
- Sensata Technologies
- Endress + Hauser
- BD|SENSORS Group
- Vega Americas Inc.
- ACS-Control-System GmbH
- Angst+Pfister Sensors and Power AG
- Metallux SA
- Baumer Ltd
- ifm electronic
- Suzhou Novosense Microelectronics
- Shenzhen Amperon Technology Co. Ltd
Key Developments in Ceramic Capacitive Pressure Sensor Industry
- 2023 November: Sensata Technologies launched a new series of rugged ceramic capacitive pressure sensors designed for extreme industrial environments, featuring enhanced corrosion resistance and operating temperatures up to 200°C.
- 2023 October: Endress + Hauser announced significant advancements in their digital sensor offerings, integrating advanced diagnostics and predictive maintenance capabilities into their ceramic capacitive pressure transmitters, improving operational efficiency by an estimated 15%.
- 2023 July: Suzhou Novosense Microelectronics secured a significant funding round of $50 million to scale up production of their high-precision ceramic capacitive pressure sensor chips for the automotive and consumer electronics markets.
- 2022 December: ifm electronic introduced a new generation of compact ceramic capacitive pressure sensors with improved accuracy and response times, targeting high-volume OEM applications in the food and beverage industry.
- 2022 September: Metallux SA expanded its product portfolio with a new range of intrinsically safe ceramic capacitive pressure sensors for hazardous area applications in the oil and gas sector.
Strategic Ceramic Capacitive Pressure Sensor Market Forecast
The strategic forecast for the Ceramic Capacitive Pressure Sensor market is exceptionally positive, driven by an anticipated surge in demand from key sectors. The accelerating adoption of smart manufacturing and IoT technologies will continue to fuel the need for reliable and connected pressure sensors. The burgeoning automotive industry, particularly in the electric vehicle segment, presents a significant growth vector. Technological advancements, including the development of miniaturized and intelligent sensors, coupled with ongoing innovation in high-performance ceramic materials, will further expand application horizons. Market players focusing on cost optimization, enhanced feature sets, and strategic partnerships will be well-positioned to capitalize on emerging opportunities and maintain a competitive edge, projecting a sustained growth trajectory for the market.
Ceramic Capacitive Pressure Sensor Segmentation
-
1. Application
- 1.1. Automotive
- 1.2. Industrial
- 1.3. Chemical
- 1.4. Food
- 1.5. Medical
- 1.6. Others
-
2. Type
- 2.1. Capacitive
- 2.2. Resistive
Ceramic Capacitive Pressure Sensor Segmentation By Geography
-
1. North America
- 1.1. United States
- 1.2. Canada
- 1.3. Mexico
-
2. South America
- 2.1. Brazil
- 2.2. Argentina
- 2.3. Rest of South America
-
3. Europe
- 3.1. United Kingdom
- 3.2. Germany
- 3.3. France
- 3.4. Italy
- 3.5. Spain
- 3.6. Russia
- 3.7. Benelux
- 3.8. Nordics
- 3.9. Rest of Europe
-
4. Middle East & Africa
- 4.1. Turkey
- 4.2. Israel
- 4.3. GCC
- 4.4. North Africa
- 4.5. South Africa
- 4.6. Rest of Middle East & Africa
-
5. Asia Pacific
- 5.1. China
- 5.2. India
- 5.3. Japan
- 5.4. South Korea
- 5.5. ASEAN
- 5.6. Oceania
- 5.7. Rest of Asia Pacific
Ceramic Capacitive Pressure Sensor Regional Market Share
Geographic Coverage of Ceramic Capacitive Pressure Sensor
Ceramic Capacitive Pressure Sensor REPORT HIGHLIGHTS
| Aspects | Details |
|---|---|
| Study Period | 2020-2034 |
| Base Year | 2025 |
| Estimated Year | 2026 |
| Forecast Period | 2026-2034 |
| Historical Period | 2020-2025 |
| Growth Rate | CAGR of 14.12% from 2020-2034 |
| Segmentation |
|
Table of Contents
- 1. Introduction
- 1.1. Research Scope
- 1.2. Market Segmentation
- 1.3. Research Objective
- 1.4. Definitions and Assumptions
- 2. Executive Summary
- 2.1. Market Snapshot
- 3. Market Dynamics
- 3.1. Market Drivers
- 3.2. Market Restrains
- 3.3. Market Trends
- 3.4. Market Opportunities
- 4. Market Factor Analysis
- 4.1. Porters Five Forces
- 4.1.1. Bargaining Power of Suppliers
- 4.1.2. Bargaining Power of Buyers
- 4.1.3. Threat of New Entrants
- 4.1.4. Threat of Substitutes
- 4.1.5. Competitive Rivalry
- 4.2. PESTEL analysis
- 4.3. BCG Analysis
- 4.3.1. Stars (High Growth, High Market Share)
- 4.3.2. Cash Cows (Low Growth, High Market Share)
- 4.3.3. Question Mark (High Growth, Low Market Share)
- 4.3.4. Dogs (Low Growth, Low Market Share)
- 4.4. Ansoff Matrix Analysis
- 4.5. Supply Chain Analysis
- 4.6. Regulatory Landscape
- 4.7. Current Market Potential and Opportunity Assessment (TAM–SAM–SOM Framework)
- 4.8. DMV Analyst Note
- 4.1. Porters Five Forces
- 5. Market Analysis, Insights and Forecast 2021-2033
- 5.1. Market Analysis, Insights and Forecast - by Application
- 5.1.1. Automotive
- 5.1.2. Industrial
- 5.1.3. Chemical
- 5.1.4. Food
- 5.1.5. Medical
- 5.1.6. Others
- 5.2. Market Analysis, Insights and Forecast - by Type
- 5.2.1. Capacitive
- 5.2.2. Resistive
- 5.3. Market Analysis, Insights and Forecast - by Region
- 5.3.1. North America
- 5.3.2. South America
- 5.3.3. Europe
- 5.3.4. Middle East & Africa
- 5.3.5. Asia Pacific
- 5.1. Market Analysis, Insights and Forecast - by Application
- 6. Global Ceramic Capacitive Pressure Sensor Analysis, Insights and Forecast, 2021-2033
- 6.1. Market Analysis, Insights and Forecast - by Application
- 6.1.1. Automotive
- 6.1.2. Industrial
- 6.1.3. Chemical
- 6.1.4. Food
- 6.1.5. Medical
- 6.1.6. Others
- 6.2. Market Analysis, Insights and Forecast - by Type
- 6.2.1. Capacitive
- 6.2.2. Resistive
- 6.1. Market Analysis, Insights and Forecast - by Application
- 7. North America Ceramic Capacitive Pressure Sensor Analysis, Insights and Forecast, 2020-2032
- 7.1. Market Analysis, Insights and Forecast - by Application
- 7.1.1. Automotive
- 7.1.2. Industrial
- 7.1.3. Chemical
- 7.1.4. Food
- 7.1.5. Medical
- 7.1.6. Others
- 7.2. Market Analysis, Insights and Forecast - by Type
- 7.2.1. Capacitive
- 7.2.2. Resistive
- 7.1. Market Analysis, Insights and Forecast - by Application
- 8. South America Ceramic Capacitive Pressure Sensor Analysis, Insights and Forecast, 2020-2032
- 8.1. Market Analysis, Insights and Forecast - by Application
- 8.1.1. Automotive
- 8.1.2. Industrial
- 8.1.3. Chemical
- 8.1.4. Food
- 8.1.5. Medical
- 8.1.6. Others
- 8.2. Market Analysis, Insights and Forecast - by Type
- 8.2.1. Capacitive
- 8.2.2. Resistive
- 8.1. Market Analysis, Insights and Forecast - by Application
- 9. Europe Ceramic Capacitive Pressure Sensor Analysis, Insights and Forecast, 2020-2032
- 9.1. Market Analysis, Insights and Forecast - by Application
- 9.1.1. Automotive
- 9.1.2. Industrial
- 9.1.3. Chemical
- 9.1.4. Food
- 9.1.5. Medical
- 9.1.6. Others
- 9.2. Market Analysis, Insights and Forecast - by Type
- 9.2.1. Capacitive
- 9.2.2. Resistive
- 9.1. Market Analysis, Insights and Forecast - by Application
- 10. Middle East & Africa Ceramic Capacitive Pressure Sensor Analysis, Insights and Forecast, 2020-2032
- 10.1. Market Analysis, Insights and Forecast - by Application
- 10.1.1. Automotive
- 10.1.2. Industrial
- 10.1.3. Chemical
- 10.1.4. Food
- 10.1.5. Medical
- 10.1.6. Others
- 10.2. Market Analysis, Insights and Forecast - by Type
- 10.2.1. Capacitive
- 10.2.2. Resistive
- 10.1. Market Analysis, Insights and Forecast - by Application
- 11. Asia Pacific Ceramic Capacitive Pressure Sensor Analysis, Insights and Forecast, 2020-2032
- 11.1. Market Analysis, Insights and Forecast - by Application
- 11.1.1. Automotive
- 11.1.2. Industrial
- 11.1.3. Chemical
- 11.1.4. Food
- 11.1.5. Medical
- 11.1.6. Others
- 11.2. Market Analysis, Insights and Forecast - by Type
- 11.2.1. Capacitive
- 11.2.2. Resistive
- 11.1. Market Analysis, Insights and Forecast - by Application
- 12. Competitive Analysis
- 12.1. Company Profiles
- 12.1.1 DOWESTON ELECTRONIC INC
- 12.1.1.1. Company Overview
- 12.1.1.2. Products
- 12.1.1.3. Company Financials
- 12.1.1.4. SWOT Analysis
- 12.1.2 Sensata Technologies
- 12.1.2.1. Company Overview
- 12.1.2.2. Products
- 12.1.2.3. Company Financials
- 12.1.2.4. SWOT Analysis
- 12.1.3 Endress + Hauser
- 12.1.3.1. Company Overview
- 12.1.3.2. Products
- 12.1.3.3. Company Financials
- 12.1.3.4. SWOT Analysis
- 12.1.4 BD|SENSORS Group
- 12.1.4.1. Company Overview
- 12.1.4.2. Products
- 12.1.4.3. Company Financials
- 12.1.4.4. SWOT Analysis
- 12.1.5 Vega Americas Inc.
- 12.1.5.1. Company Overview
- 12.1.5.2. Products
- 12.1.5.3. Company Financials
- 12.1.5.4. SWOT Analysis
- 12.1.6 ACS-Control-System GmbH
- 12.1.6.1. Company Overview
- 12.1.6.2. Products
- 12.1.6.3. Company Financials
- 12.1.6.4. SWOT Analysis
- 12.1.7 Angst+Pfister Sensors and Power AG
- 12.1.7.1. Company Overview
- 12.1.7.2. Products
- 12.1.7.3. Company Financials
- 12.1.7.4. SWOT Analysis
- 12.1.8 Metallux SA
- 12.1.8.1. Company Overview
- 12.1.8.2. Products
- 12.1.8.3. Company Financials
- 12.1.8.4. SWOT Analysis
- 12.1.9 Baumer Ltd
- 12.1.9.1. Company Overview
- 12.1.9.2. Products
- 12.1.9.3. Company Financials
- 12.1.9.4. SWOT Analysis
- 12.1.10 ifm electronic
- 12.1.10.1. Company Overview
- 12.1.10.2. Products
- 12.1.10.3. Company Financials
- 12.1.10.4. SWOT Analysis
- 12.1.11 Suzhou Novosense Microelectronics
- 12.1.11.1. Company Overview
- 12.1.11.2. Products
- 12.1.11.3. Company Financials
- 12.1.11.4. SWOT Analysis
- 12.1.12 Shenzhen Amperon Technology Co. Ltd
- 12.1.12.1. Company Overview
- 12.1.12.2. Products
- 12.1.12.3. Company Financials
- 12.1.12.4. SWOT Analysis
- 12.1.1 DOWESTON ELECTRONIC INC
- 12.2. Market Entropy
- 12.2.1 Company's Key Areas Served
- 12.2.2 Recent Developments
- 12.3. Company Market Share Analysis 2025
- 12.3.1 Top 5 Companies Market Share Analysis
- 12.3.2 Top 3 Companies Market Share Analysis
- 12.4. List of Potential Customers
- 13. Research Methodology
List of Figures
- Figure 1: Global Ceramic Capacitive Pressure Sensor Revenue Breakdown (undefined, %) by Region 2025 & 2033
- Figure 2: Global Ceramic Capacitive Pressure Sensor Volume Breakdown (K, %) by Region 2025 & 2033
- Figure 3: North America Ceramic Capacitive Pressure Sensor Revenue (undefined), by Application 2025 & 2033
- Figure 4: North America Ceramic Capacitive Pressure Sensor Volume (K), by Application 2025 & 2033
- Figure 5: North America Ceramic Capacitive Pressure Sensor Revenue Share (%), by Application 2025 & 2033
- Figure 6: North America Ceramic Capacitive Pressure Sensor Volume Share (%), by Application 2025 & 2033
- Figure 7: North America Ceramic Capacitive Pressure Sensor Revenue (undefined), by Type 2025 & 2033
- Figure 8: North America Ceramic Capacitive Pressure Sensor Volume (K), by Type 2025 & 2033
- Figure 9: North America Ceramic Capacitive Pressure Sensor Revenue Share (%), by Type 2025 & 2033
- Figure 10: North America Ceramic Capacitive Pressure Sensor Volume Share (%), by Type 2025 & 2033
- Figure 11: North America Ceramic Capacitive Pressure Sensor Revenue (undefined), by Country 2025 & 2033
- Figure 12: North America Ceramic Capacitive Pressure Sensor Volume (K), by Country 2025 & 2033
- Figure 13: North America Ceramic Capacitive Pressure Sensor Revenue Share (%), by Country 2025 & 2033
- Figure 14: North America Ceramic Capacitive Pressure Sensor Volume Share (%), by Country 2025 & 2033
- Figure 15: South America Ceramic Capacitive Pressure Sensor Revenue (undefined), by Application 2025 & 2033
- Figure 16: South America Ceramic Capacitive Pressure Sensor Volume (K), by Application 2025 & 2033
- Figure 17: South America Ceramic Capacitive Pressure Sensor Revenue Share (%), by Application 2025 & 2033
- Figure 18: South America Ceramic Capacitive Pressure Sensor Volume Share (%), by Application 2025 & 2033
- Figure 19: South America Ceramic Capacitive Pressure Sensor Revenue (undefined), by Type 2025 & 2033
- Figure 20: South America Ceramic Capacitive Pressure Sensor Volume (K), by Type 2025 & 2033
- Figure 21: South America Ceramic Capacitive Pressure Sensor Revenue Share (%), by Type 2025 & 2033
- Figure 22: South America Ceramic Capacitive Pressure Sensor Volume Share (%), by Type 2025 & 2033
- Figure 23: South America Ceramic Capacitive Pressure Sensor Revenue (undefined), by Country 2025 & 2033
- Figure 24: South America Ceramic Capacitive Pressure Sensor Volume (K), by Country 2025 & 2033
- Figure 25: South America Ceramic Capacitive Pressure Sensor Revenue Share (%), by Country 2025 & 2033
- Figure 26: South America Ceramic Capacitive Pressure Sensor Volume Share (%), by Country 2025 & 2033
- Figure 27: Europe Ceramic Capacitive Pressure Sensor Revenue (undefined), by Application 2025 & 2033
- Figure 28: Europe Ceramic Capacitive Pressure Sensor Volume (K), by Application 2025 & 2033
- Figure 29: Europe Ceramic Capacitive Pressure Sensor Revenue Share (%), by Application 2025 & 2033
- Figure 30: Europe Ceramic Capacitive Pressure Sensor Volume Share (%), by Application 2025 & 2033
- Figure 31: Europe Ceramic Capacitive Pressure Sensor Revenue (undefined), by Type 2025 & 2033
- Figure 32: Europe Ceramic Capacitive Pressure Sensor Volume (K), by Type 2025 & 2033
- Figure 33: Europe Ceramic Capacitive Pressure Sensor Revenue Share (%), by Type 2025 & 2033
- Figure 34: Europe Ceramic Capacitive Pressure Sensor Volume Share (%), by Type 2025 & 2033
- Figure 35: Europe Ceramic Capacitive Pressure Sensor Revenue (undefined), by Country 2025 & 2033
- Figure 36: Europe Ceramic Capacitive Pressure Sensor Volume (K), by Country 2025 & 2033
- Figure 37: Europe Ceramic Capacitive Pressure Sensor Revenue Share (%), by Country 2025 & 2033
- Figure 38: Europe Ceramic Capacitive Pressure Sensor Volume Share (%), by Country 2025 & 2033
- Figure 39: Middle East & Africa Ceramic Capacitive Pressure Sensor Revenue (undefined), by Application 2025 & 2033
- Figure 40: Middle East & Africa Ceramic Capacitive Pressure Sensor Volume (K), by Application 2025 & 2033
- Figure 41: Middle East & Africa Ceramic Capacitive Pressure Sensor Revenue Share (%), by Application 2025 & 2033
- Figure 42: Middle East & Africa Ceramic Capacitive Pressure Sensor Volume Share (%), by Application 2025 & 2033
- Figure 43: Middle East & Africa Ceramic Capacitive Pressure Sensor Revenue (undefined), by Type 2025 & 2033
- Figure 44: Middle East & Africa Ceramic Capacitive Pressure Sensor Volume (K), by Type 2025 & 2033
- Figure 45: Middle East & Africa Ceramic Capacitive Pressure Sensor Revenue Share (%), by Type 2025 & 2033
- Figure 46: Middle East & Africa Ceramic Capacitive Pressure Sensor Volume Share (%), by Type 2025 & 2033
- Figure 47: Middle East & Africa Ceramic Capacitive Pressure Sensor Revenue (undefined), by Country 2025 & 2033
- Figure 48: Middle East & Africa Ceramic Capacitive Pressure Sensor Volume (K), by Country 2025 & 2033
- Figure 49: Middle East & Africa Ceramic Capacitive Pressure Sensor Revenue Share (%), by Country 2025 & 2033
- Figure 50: Middle East & Africa Ceramic Capacitive Pressure Sensor Volume Share (%), by Country 2025 & 2033
- Figure 51: Asia Pacific Ceramic Capacitive Pressure Sensor Revenue (undefined), by Application 2025 & 2033
- Figure 52: Asia Pacific Ceramic Capacitive Pressure Sensor Volume (K), by Application 2025 & 2033
- Figure 53: Asia Pacific Ceramic Capacitive Pressure Sensor Revenue Share (%), by Application 2025 & 2033
- Figure 54: Asia Pacific Ceramic Capacitive Pressure Sensor Volume Share (%), by Application 2025 & 2033
- Figure 55: Asia Pacific Ceramic Capacitive Pressure Sensor Revenue (undefined), by Type 2025 & 2033
- Figure 56: Asia Pacific Ceramic Capacitive Pressure Sensor Volume (K), by Type 2025 & 2033
- Figure 57: Asia Pacific Ceramic Capacitive Pressure Sensor Revenue Share (%), by Type 2025 & 2033
- Figure 58: Asia Pacific Ceramic Capacitive Pressure Sensor Volume Share (%), by Type 2025 & 2033
- Figure 59: Asia Pacific Ceramic Capacitive Pressure Sensor Revenue (undefined), by Country 2025 & 2033
- Figure 60: Asia Pacific Ceramic Capacitive Pressure Sensor Volume (K), by Country 2025 & 2033
- Figure 61: Asia Pacific Ceramic Capacitive Pressure Sensor Revenue Share (%), by Country 2025 & 2033
- Figure 62: Asia Pacific Ceramic Capacitive Pressure Sensor Volume Share (%), by Country 2025 & 2033
List of Tables
- Table 1: Global Ceramic Capacitive Pressure Sensor Revenue undefined Forecast, by Application 2020 & 2033
- Table 2: Global Ceramic Capacitive Pressure Sensor Volume K Forecast, by Application 2020 & 2033
- Table 3: Global Ceramic Capacitive Pressure Sensor Revenue undefined Forecast, by Type 2020 & 2033
- Table 4: Global Ceramic Capacitive Pressure Sensor Volume K Forecast, by Type 2020 & 2033
- Table 5: Global Ceramic Capacitive Pressure Sensor Revenue undefined Forecast, by Region 2020 & 2033
- Table 6: Global Ceramic Capacitive Pressure Sensor Volume K Forecast, by Region 2020 & 2033
- Table 7: Global Ceramic Capacitive Pressure Sensor Revenue undefined Forecast, by Application 2020 & 2033
- Table 8: Global Ceramic Capacitive Pressure Sensor Volume K Forecast, by Application 2020 & 2033
- Table 9: Global Ceramic Capacitive Pressure Sensor Revenue undefined Forecast, by Type 2020 & 2033
- Table 10: Global Ceramic Capacitive Pressure Sensor Volume K Forecast, by Type 2020 & 2033
- Table 11: Global Ceramic Capacitive Pressure Sensor Revenue undefined Forecast, by Country 2020 & 2033
- Table 12: Global Ceramic Capacitive Pressure Sensor Volume K Forecast, by Country 2020 & 2033
- Table 13: United States Ceramic Capacitive Pressure Sensor Revenue (undefined) Forecast, by Application 2020 & 2033
- Table 14: United States Ceramic Capacitive Pressure Sensor Volume (K) Forecast, by Application 2020 & 2033
- Table 15: Canada Ceramic Capacitive Pressure Sensor Revenue (undefined) Forecast, by Application 2020 & 2033
- Table 16: Canada Ceramic Capacitive Pressure Sensor Volume (K) Forecast, by Application 2020 & 2033
- Table 17: Mexico Ceramic Capacitive Pressure Sensor Revenue (undefined) Forecast, by Application 2020 & 2033
- Table 18: Mexico Ceramic Capacitive Pressure Sensor Volume (K) Forecast, by Application 2020 & 2033
- Table 19: Global Ceramic Capacitive Pressure Sensor Revenue undefined Forecast, by Application 2020 & 2033
- Table 20: Global Ceramic Capacitive Pressure Sensor Volume K Forecast, by Application 2020 & 2033
- Table 21: Global Ceramic Capacitive Pressure Sensor Revenue undefined Forecast, by Type 2020 & 2033
- Table 22: Global Ceramic Capacitive Pressure Sensor Volume K Forecast, by Type 2020 & 2033
- Table 23: Global Ceramic Capacitive Pressure Sensor Revenue undefined Forecast, by Country 2020 & 2033
- Table 24: Global Ceramic Capacitive Pressure Sensor Volume K Forecast, by Country 2020 & 2033
- Table 25: Brazil Ceramic Capacitive Pressure Sensor Revenue (undefined) Forecast, by Application 2020 & 2033
- Table 26: Brazil Ceramic Capacitive Pressure Sensor Volume (K) Forecast, by Application 2020 & 2033
- Table 27: Argentina Ceramic Capacitive Pressure Sensor Revenue (undefined) Forecast, by Application 2020 & 2033
- Table 28: Argentina Ceramic Capacitive Pressure Sensor Volume (K) Forecast, by Application 2020 & 2033
- Table 29: Rest of South America Ceramic Capacitive Pressure Sensor Revenue (undefined) Forecast, by Application 2020 & 2033
- Table 30: Rest of South America Ceramic Capacitive Pressure Sensor Volume (K) Forecast, by Application 2020 & 2033
- Table 31: Global Ceramic Capacitive Pressure Sensor Revenue undefined Forecast, by Application 2020 & 2033
- Table 32: Global Ceramic Capacitive Pressure Sensor Volume K Forecast, by Application 2020 & 2033
- Table 33: Global Ceramic Capacitive Pressure Sensor Revenue undefined Forecast, by Type 2020 & 2033
- Table 34: Global Ceramic Capacitive Pressure Sensor Volume K Forecast, by Type 2020 & 2033
- Table 35: Global Ceramic Capacitive Pressure Sensor Revenue undefined Forecast, by Country 2020 & 2033
- Table 36: Global Ceramic Capacitive Pressure Sensor Volume K Forecast, by Country 2020 & 2033
- Table 37: United Kingdom Ceramic Capacitive Pressure Sensor Revenue (undefined) Forecast, by Application 2020 & 2033
- Table 38: United Kingdom Ceramic Capacitive Pressure Sensor Volume (K) Forecast, by Application 2020 & 2033
- Table 39: Germany Ceramic Capacitive Pressure Sensor Revenue (undefined) Forecast, by Application 2020 & 2033
- Table 40: Germany Ceramic Capacitive Pressure Sensor Volume (K) Forecast, by Application 2020 & 2033
- Table 41: France Ceramic Capacitive Pressure Sensor Revenue (undefined) Forecast, by Application 2020 & 2033
- Table 42: France Ceramic Capacitive Pressure Sensor Volume (K) Forecast, by Application 2020 & 2033
- Table 43: Italy Ceramic Capacitive Pressure Sensor Revenue (undefined) Forecast, by Application 2020 & 2033
- Table 44: Italy Ceramic Capacitive Pressure Sensor Volume (K) Forecast, by Application 2020 & 2033
- Table 45: Spain Ceramic Capacitive Pressure Sensor Revenue (undefined) Forecast, by Application 2020 & 2033
- Table 46: Spain Ceramic Capacitive Pressure Sensor Volume (K) Forecast, by Application 2020 & 2033
- Table 47: Russia Ceramic Capacitive Pressure Sensor Revenue (undefined) Forecast, by Application 2020 & 2033
- Table 48: Russia Ceramic Capacitive Pressure Sensor Volume (K) Forecast, by Application 2020 & 2033
- Table 49: Benelux Ceramic Capacitive Pressure Sensor Revenue (undefined) Forecast, by Application 2020 & 2033
- Table 50: Benelux Ceramic Capacitive Pressure Sensor Volume (K) Forecast, by Application 2020 & 2033
- Table 51: Nordics Ceramic Capacitive Pressure Sensor Revenue (undefined) Forecast, by Application 2020 & 2033
- Table 52: Nordics Ceramic Capacitive Pressure Sensor Volume (K) Forecast, by Application 2020 & 2033
- Table 53: Rest of Europe Ceramic Capacitive Pressure Sensor Revenue (undefined) Forecast, by Application 2020 & 2033
- Table 54: Rest of Europe Ceramic Capacitive Pressure Sensor Volume (K) Forecast, by Application 2020 & 2033
- Table 55: Global Ceramic Capacitive Pressure Sensor Revenue undefined Forecast, by Application 2020 & 2033
- Table 56: Global Ceramic Capacitive Pressure Sensor Volume K Forecast, by Application 2020 & 2033
- Table 57: Global Ceramic Capacitive Pressure Sensor Revenue undefined Forecast, by Type 2020 & 2033
- Table 58: Global Ceramic Capacitive Pressure Sensor Volume K Forecast, by Type 2020 & 2033
- Table 59: Global Ceramic Capacitive Pressure Sensor Revenue undefined Forecast, by Country 2020 & 2033
- Table 60: Global Ceramic Capacitive Pressure Sensor Volume K Forecast, by Country 2020 & 2033
- Table 61: Turkey Ceramic Capacitive Pressure Sensor Revenue (undefined) Forecast, by Application 2020 & 2033
- Table 62: Turkey Ceramic Capacitive Pressure Sensor Volume (K) Forecast, by Application 2020 & 2033
- Table 63: Israel Ceramic Capacitive Pressure Sensor Revenue (undefined) Forecast, by Application 2020 & 2033
- Table 64: Israel Ceramic Capacitive Pressure Sensor Volume (K) Forecast, by Application 2020 & 2033
- Table 65: GCC Ceramic Capacitive Pressure Sensor Revenue (undefined) Forecast, by Application 2020 & 2033
- Table 66: GCC Ceramic Capacitive Pressure Sensor Volume (K) Forecast, by Application 2020 & 2033
- Table 67: North Africa Ceramic Capacitive Pressure Sensor Revenue (undefined) Forecast, by Application 2020 & 2033
- Table 68: North Africa Ceramic Capacitive Pressure Sensor Volume (K) Forecast, by Application 2020 & 2033
- Table 69: South Africa Ceramic Capacitive Pressure Sensor Revenue (undefined) Forecast, by Application 2020 & 2033
- Table 70: South Africa Ceramic Capacitive Pressure Sensor Volume (K) Forecast, by Application 2020 & 2033
- Table 71: Rest of Middle East & Africa Ceramic Capacitive Pressure Sensor Revenue (undefined) Forecast, by Application 2020 & 2033
- Table 72: Rest of Middle East & Africa Ceramic Capacitive Pressure Sensor Volume (K) Forecast, by Application 2020 & 2033
- Table 73: Global Ceramic Capacitive Pressure Sensor Revenue undefined Forecast, by Application 2020 & 2033
- Table 74: Global Ceramic Capacitive Pressure Sensor Volume K Forecast, by Application 2020 & 2033
- Table 75: Global Ceramic Capacitive Pressure Sensor Revenue undefined Forecast, by Type 2020 & 2033
- Table 76: Global Ceramic Capacitive Pressure Sensor Volume K Forecast, by Type 2020 & 2033
- Table 77: Global Ceramic Capacitive Pressure Sensor Revenue undefined Forecast, by Country 2020 & 2033
- Table 78: Global Ceramic Capacitive Pressure Sensor Volume K Forecast, by Country 2020 & 2033
- Table 79: China Ceramic Capacitive Pressure Sensor Revenue (undefined) Forecast, by Application 2020 & 2033
- Table 80: China Ceramic Capacitive Pressure Sensor Volume (K) Forecast, by Application 2020 & 2033
- Table 81: India Ceramic Capacitive Pressure Sensor Revenue (undefined) Forecast, by Application 2020 & 2033
- Table 82: India Ceramic Capacitive Pressure Sensor Volume (K) Forecast, by Application 2020 & 2033
- Table 83: Japan Ceramic Capacitive Pressure Sensor Revenue (undefined) Forecast, by Application 2020 & 2033
- Table 84: Japan Ceramic Capacitive Pressure Sensor Volume (K) Forecast, by Application 2020 & 2033
- Table 85: South Korea Ceramic Capacitive Pressure Sensor Revenue (undefined) Forecast, by Application 2020 & 2033
- Table 86: South Korea Ceramic Capacitive Pressure Sensor Volume (K) Forecast, by Application 2020 & 2033
- Table 87: ASEAN Ceramic Capacitive Pressure Sensor Revenue (undefined) Forecast, by Application 2020 & 2033
- Table 88: ASEAN Ceramic Capacitive Pressure Sensor Volume (K) Forecast, by Application 2020 & 2033
- Table 89: Oceania Ceramic Capacitive Pressure Sensor Revenue (undefined) Forecast, by Application 2020 & 2033
- Table 90: Oceania Ceramic Capacitive Pressure Sensor Volume (K) Forecast, by Application 2020 & 2033
- Table 91: Rest of Asia Pacific Ceramic Capacitive Pressure Sensor Revenue (undefined) Forecast, by Application 2020 & 2033
- Table 92: Rest of Asia Pacific Ceramic Capacitive Pressure Sensor Volume (K) Forecast, by Application 2020 & 2033
Frequently Asked Questions
1. What is the projected Compound Annual Growth Rate (CAGR) of the Ceramic Capacitive Pressure Sensor?
The projected CAGR is approximately 14.12%.
2. Which companies are prominent players in the Ceramic Capacitive Pressure Sensor?
Key companies in the market include DOWESTON ELECTRONIC INC, Sensata Technologies, Endress + Hauser, BD|SENSORS Group, Vega Americas Inc., ACS-Control-System GmbH, Angst+Pfister Sensors and Power AG, Metallux SA, Baumer Ltd, ifm electronic, Suzhou Novosense Microelectronics, Shenzhen Amperon Technology Co. Ltd.
3. What are the main segments of the Ceramic Capacitive Pressure Sensor?
The market segments include Application, Type.
4. Can you provide details about the market size?
The market size is estimated to be USD XXX N/A as of 2022.
5. What are some drivers contributing to market growth?
N/A
6. What are the notable trends driving market growth?
N/A
7. Are there any restraints impacting market growth?
N/A
8. Can you provide examples of recent developments in the market?
N/A
9. What pricing options are available for accessing the report?
Pricing options include single-user, multi-user, and enterprise licenses priced at USD 3950.00, USD 5925.00, and USD 7900.00 respectively.
10. Is the market size provided in terms of value or volume?
The market size is provided in terms of value, measured in N/A and volume, measured in K.
11. Are there any specific market keywords associated with the report?
Yes, the market keyword associated with the report is "Ceramic Capacitive Pressure Sensor," which aids in identifying and referencing the specific market segment covered.
12. How do I determine which pricing option suits my needs best?
The pricing options vary based on user requirements and access needs. Individual users may opt for single-user licenses, while businesses requiring broader access may choose multi-user or enterprise licenses for cost-effective access to the report.
13. Are there any additional resources or data provided in the Ceramic Capacitive Pressure Sensor report?
While the report offers comprehensive insights, it's advisable to review the specific contents or supplementary materials provided to ascertain if additional resources or data are available.
14. How can I stay updated on further developments or reports in the Ceramic Capacitive Pressure Sensor?
To stay informed about further developments, trends, and reports in the Ceramic Capacitive Pressure Sensor, consider subscribing to industry newsletters, following relevant companies and organizations, or regularly checking reputable industry news sources and publications.
Methodology
Step 1 - Identification of Relevant Samples Size from Population Database


Step 2 - Approaches for Defining Global Market Size (Value, Volume* & Price*)

Note*: In applicable scenarios
Step 3 - Data Sources
Primary Research
- Web Analytics
- Survey Reports
- Research Institute
- Latest Research Reports
- Opinion Leaders
Secondary Research
- Annual Reports
- White Paper
- Latest Press Release
- Industry Association
- Paid Database
- Investor Presentations

Step 4 - Data Triangulation
Involves using different sources of information in order to increase the validity of a study
These sources are likely to be stakeholders in a program - participants, other researchers, program staff, other community members, and so on.
Then we put all data in single framework & apply various statistical tools to find out the dynamic on the market.
During the analysis stage, feedback from the stakeholder groups would be compared to determine areas of agreement as well as areas of divergence