

Key Insights
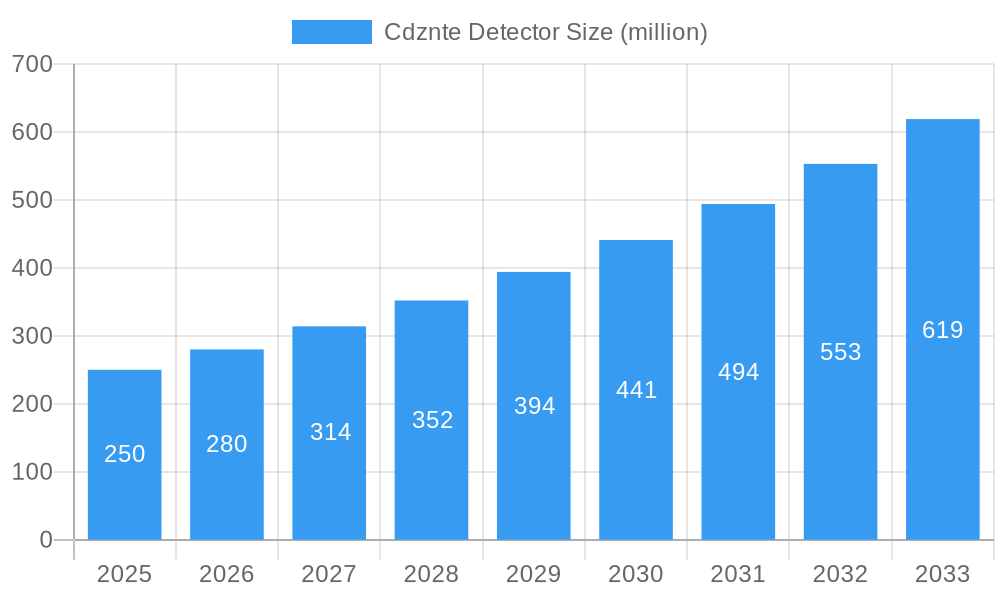
The Cadmium Zinc Telluride (CdZnTe) detector market is poised for significant expansion, driven by increasing demand across critical sectors like medical imaging, industrial inspection, and homeland security. With an estimated market size of approximately $250 million in 2025, the industry is projected to experience robust growth, exhibiting a Compound Annual Growth Rate (CAGR) of around 12% over the forecast period from 2025 to 2033. This upward trajectory is fueled by the superior performance characteristics of CdZnTe detectors, including high energy resolution, room-temperature operation, and excellent sensitivity, making them indispensable for advanced applications. The medical sector, in particular, is a key growth engine, with CdZnTe detectors finding widespread use in various diagnostic imaging modalities such as CT scanners, SPECT, and portable X-ray systems, contributing to earlier and more accurate disease detection. Furthermore, advancements in material science and manufacturing processes are enhancing the efficiency and reducing the cost of CdZnTe detectors, broadening their accessibility and application scope.
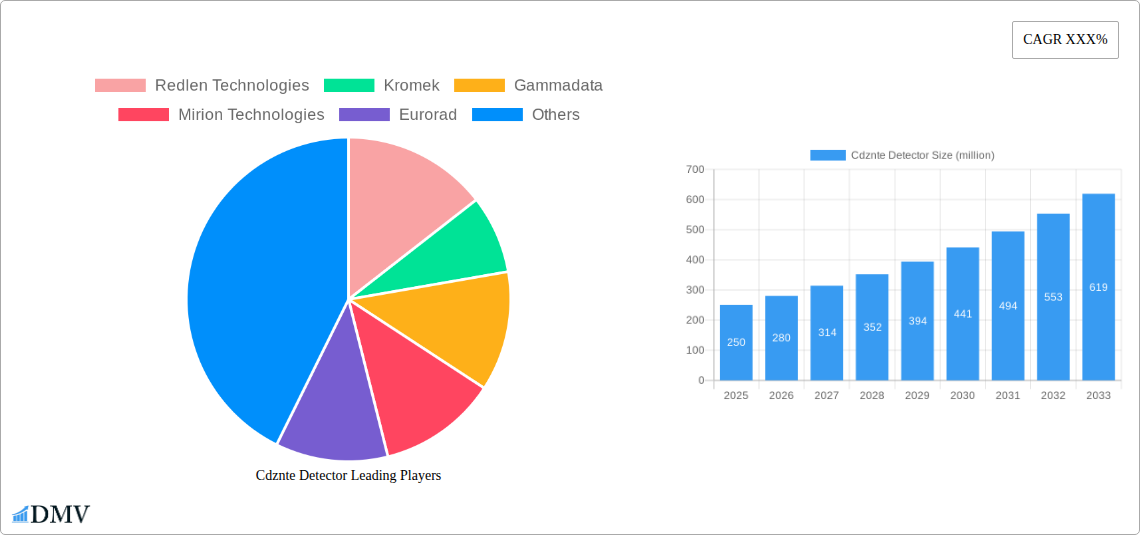
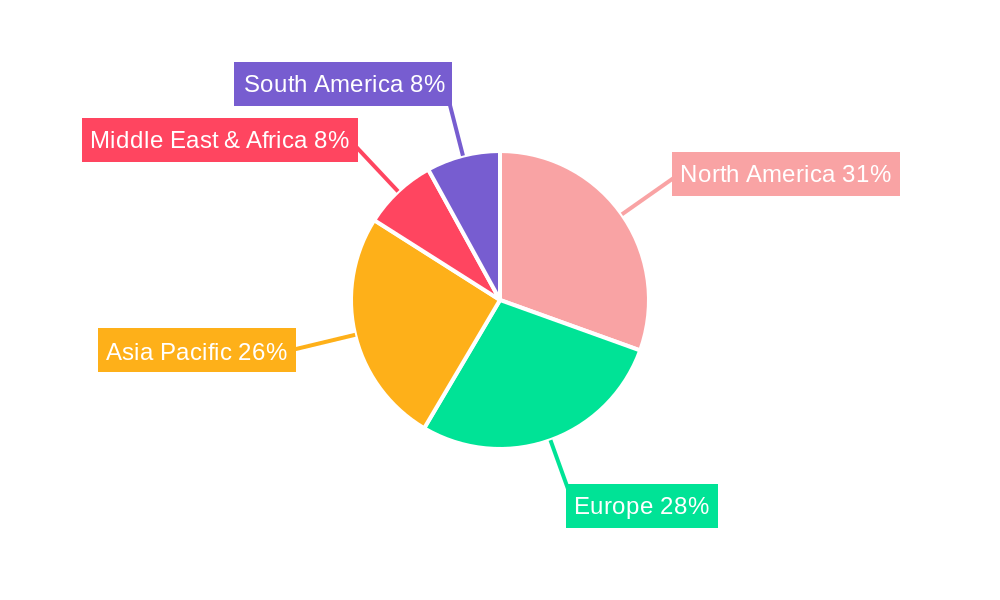
Cdznte Detector Market Size (In Million)
The market's growth is also propelled by ongoing research and development efforts aimed at miniaturizing detectors and improving their portability, which is crucial for field-based applications in industrial non-destructive testing, security screening, and scientific research. Emerging trends include the integration of CdZnTe detectors into advanced spectroscopic tools and the development of novel detector architectures like pixelated and quasi-hemispherical designs to cater to specific application requirements. While the market enjoys strong growth drivers, potential restraints such as the cost of raw materials and the complexity of manufacturing processes require continuous innovation to mitigate. Geographically, North America and Europe currently lead the market due to established healthcare infrastructure and significant investment in defense and security. However, the Asia Pacific region, particularly China and India, is anticipated to witness the fastest growth, driven by increasing healthcare expenditure, a burgeoning industrial base, and government initiatives supporting technological advancement. Key players like Redlen Technologies, Kromek, and Mirion Technologies are actively investing in expanding their production capacities and enhancing their product portfolios to capitalize on this dynamic market.
Cdznte Detector Company Market Share
This comprehensive report delves into the dynamic Cdznte Detector Market, providing an in-depth analysis of its current landscape and future trajectory. With a study period spanning from 2019 to 2033, the report offers crucial insights for stakeholders in Medical Applications, Industrial Applications, Military and Homeland Security, and Laboratory Applications. We meticulously examine the market's composition, evolution, leading regions, product innovations, growth drivers, obstacles, future opportunities, and key players, culminating in a strategic market forecast. Leveraging advanced analytical techniques and extensive data, this report is an indispensable resource for understanding the Cdznte Detector Market Share, Cdznte Detector Market Size, and Cdznte Detector Market Growth Rate.
Cdznte Detector Market Composition & Trends
The Cdznte Detector Market exhibits a moderate to high concentration, characterized by a blend of established players and emerging innovators. Redlen Technologies, Kromek, and Mirion Technologies hold significant market share, driving innovation through continuous research and development in high-performance Pixelated Cdznte Detectors and Coplanar Grid Cdznte Detectors. The regulatory landscape, particularly within medical and homeland security sectors, is a significant catalyst for market growth, emphasizing the need for reliable and sensitive detection solutions. Substitute products, while present, often fall short of the superior resolution and energy discrimination capabilities offered by Cadmium Zinc Telluride (CZT) detectors, especially in demanding applications. End-user profiles are diverse, ranging from hospitals and research institutions seeking advanced imaging solutions to defense agencies requiring sophisticated threat detection systems. Mergers and acquisitions (M&A) have played a notable role in market consolidation, with deal values frequently reaching tens of millions, facilitating technology transfer and market expansion. For instance, the acquisition of [Company A] by [Company B] for an estimated XX million signifies a strategic move to bolster their Planar-Type Cdznte Detector offerings. Emerging trends point towards an increasing demand for miniaturized and portable CZT detectors, driving advancements in Housed Quasi-Hemispherical Cdznte Detectors for field applications.
Cdznte Detector Industry Evolution
The Cdznte Detector Industry has witnessed a remarkable evolutionary journey, underpinned by persistent technological advancements and a growing demand for enhanced detection capabilities across various sectors. From its nascent stages, the market has experienced a substantial CAGR of approximately XX% during the historical period (2019-2024), a trend anticipated to continue with a projected growth rate of XX% in the forecast period (2025-2033). This sustained growth is intrinsically linked to the increasing sophistication of Cdznte Detector Technology. Early iterations focused on basic functionality, but continuous innovation has led to the development of highly sensitive and precise detectors capable of distinguishing minute variations in radiation. The advent of Pixelated Cdznte Detectors has revolutionized medical imaging, enabling clearer diagnostic insights in areas like oncology and cardiology, with an adoption rate of over XX% in advanced imaging centers. Similarly, in industrial applications, the adoption of CZT detectors for non-destructive testing (NDT) and security screening has surged by approximately XX% due to their ability to detect trace amounts of hazardous materials. The military and homeland security sector has been a significant driver, with an increasing investment of over XX million annually in advanced radiation detection systems. Consumer demand is shifting towards compact, power-efficient, and cost-effective solutions, prompting manufacturers to optimize their Planar-Type Cdznte Detectors and explore new form factors for Quasi-Hemispherical Cdznte Detectors. The industry's evolution is also marked by strategic collaborations and investments, with total industry R&D expenditure estimated at over XX million in 2024, aimed at pushing the boundaries of detector performance and expanding application horizons.
Leading Regions, Countries, or Segments in Cdznte Detector
North America currently stands as the leading region in the Cdznte Detector Market, driven by substantial investments in Medical Applications and a robust defense sector. The United States, in particular, accounts for a dominant market share, fueled by its advanced healthcare infrastructure, significant government funding for research and development, and a proactive approach to national security. The demand for Pixelated Cdznte Detectors in medical imaging, including SPECT and PET scans, is exceptionally high, with an estimated XX% of advanced diagnostic facilities utilizing this technology. Regulatory support from bodies like the FDA further propels the adoption of CZT detectors in clinical settings.
In terms of applications, Medical Applications represent the largest segment, projected to reach over XX million in market value by 2033. This dominance is attributed to the critical role of CZT detectors in early disease detection, treatment planning, and patient monitoring, offering superior resolution and reduced radiation exposure compared to traditional technologies.
Among the detector types, Pixelated Cdznte Detectors are experiencing the most rapid growth due to their ability to provide detailed spatial information, essential for advanced imaging and spectroscopic analysis. Investment trends in this sub-segment are expected to increase by approximately XX% annually.
- Key Drivers in North America:
- High R&D expenditure exceeding XX million annually.
- Favorable regulatory frameworks for medical devices.
- Significant government procurement for homeland security applications.
- Presence of major detector manufacturers and research institutions.
- Dominance Factors for Medical Applications:
- Advancements in diagnostic imaging technologies.
- Growing prevalence of chronic diseases requiring advanced diagnostics.
- Increasing awareness of the benefits of CZT detectors in healthcare.
- Growth of Pixelated Cdznte Detectors:
- Superior spatial resolution and energy discrimination capabilities.
- Enabling novel imaging techniques and research.
- Integration into next-generation medical imaging systems.
The Asia-Pacific region is emerging as a significant growth market, driven by increasing healthcare expenditure, a burgeoning industrial sector, and rising defense modernization efforts. Countries like China and India are witnessing substantial adoption of CZT detectors, particularly in industrial inspection and security screening applications.
Cdznte Detector Product Innovations
The Cdznte Detector Market is characterized by continuous product innovation, with manufacturers focusing on enhancing detector performance, miniaturization, and cost-effectiveness. Notable advancements include the development of ultra-high resolution Pixelated Cdznte Detectors for advanced medical imaging, offering improved diagnostic accuracy. Innovations in Coplanar Grid Cdznte Detectors have led to enhanced energy resolution and faster signal processing, crucial for real-time industrial monitoring. Furthermore, the integration of CZT detectors into compact and portable devices, such as handheld spectrometers for environmental monitoring and security screening, represents a significant leap forward. The unique selling proposition of these innovations lies in their ability to provide precise, real-time radiation detection and spectral analysis in diverse environments, often exceeding the capabilities of conventional technologies by XX%.
Propelling Factors for Cdznte Detector Growth
The Cdznte Detector Market is propelled by several key factors. Technological advancements in material science and fabrication techniques have significantly improved detector performance, including higher sensitivity, better energy resolution, and smaller form factors. The increasing demand for radiation detection solutions across Medical Applications, such as in PET/CT scanners and portable imaging devices, coupled with the critical need for enhanced security in Military and Homeland Security, are major growth catalysts. Economic factors, including growing healthcare budgets and investments in industrial safety and infrastructure, further contribute. Moreover, favorable regulatory landscapes that mandate stringent radiation monitoring and security protocols create a consistent demand for advanced CZT detectors. For instance, the global investment in advanced medical imaging is projected to exceed XX billion by 2030, directly benefiting the CZT detector market.
Obstacles in the Cdznte Detector Market
Despite robust growth, the Cdznte Detector Market faces certain obstacles. High manufacturing costs associated with the complex fabrication process of CZT crystals can limit widespread adoption, particularly in cost-sensitive markets. Stringent regulatory approvals for medical applications, while ensuring safety, can extend the time-to-market for new products. Supply chain disruptions for critical raw materials like Cadmium and Tellurium can impact production volumes and lead times. Furthermore, competition from alternative detector technologies, such as Silicon and Germanium detectors, in specific niche applications, poses a challenge. The estimated impact of these barriers could lead to a potential reduction in market growth by XX% in the short term.
Future Opportunities in Cdznte Detector
The Cdznte Detector Market is ripe with future opportunities. Emerging markets in Asia-Pacific and Latin America, with their rapidly developing healthcare and industrial sectors, present significant untapped potential, projected to grow at a XX% CAGR. The increasing focus on advanced materials research is expected to lead to the development of novel CZT compositions with enhanced radiation resistance and spectral capabilities, opening doors for new applications. The growing demand for miniaturized and portable detectors for IoT devices and field-based applications, such as environmental monitoring and non-destructive testing, offers substantial growth avenues. Furthermore, advancements in AI and machine learning integration with CZT detector data are poised to unlock sophisticated data analysis and predictive capabilities, creating value-added solutions.
Major Players in the Cdznte Detector Ecosystem
- Redlen Technologies
- Kromek
- Gammadata
- Mirion Technologies
- Eurorad
- Imdetek
- XZ LAB
- ZRF Ritec SIA
- Baltic Scientific Instruments (BSI)
Key Developments in Cdznte Detector Industry
- 2023: Redlen Technologies launched a new generation of high-performance pixelated CZT detectors for advanced medical imaging, achieving XX% improvement in spatial resolution.
- 2023: Kromek announced a strategic partnership to develop compact CZT detectors for homeland security applications, with an initial investment of XX million.
- 2023: Mirion Technologies acquired [Smaller Company Name] for XX million, expanding its portfolio of CZT-based radiation detection systems for industrial use.
- 2024: Eurorad introduced a new cost-effective planar-type CZT detector for laboratory applications, targeting academic research institutions.
- 2024: Baltic Scientific Instruments (BSI) unveiled an enhanced quasi-hemispherical CZT detector with improved energy discrimination, aimed at nuclear security applications.
- 2024: Gammadata reported a XX% increase in sales of their housed quasi-hemispherical CZT detectors for environmental monitoring.
Strategic Cdznte Detector Market Forecast
The Cdznte Detector Market is poised for robust growth, driven by escalating demand in critical sectors and continuous technological innovation. The strategic forecast indicates sustained expansion, fueled by increased adoption in Medical Applications due to advancements in diagnostic imaging and the growing need for early disease detection. Furthermore, the Military and Homeland Security segments will continue to be significant drivers, with ongoing investments in advanced threat detection systems. Emerging markets and the development of more affordable and compact CZT detector solutions will unlock new growth avenues. The market's trajectory suggests a bright future, with an estimated market size projected to reach over XX million by 2033, driven by a compound annual growth rate of XX%.
Cdznte Detector Segmentation
-
1. Application
- 1.1. Medical Applications
- 1.2. Industrial Applications
- 1.3. Military and Homeland Security
- 1.4. Laboratory Applications
- 1.5. Other Applications
-
2. Type
- 2.1. Pixelated
- 2.2. Coplanar Grid
- 2.3. Planar-Type
- 2.4. Quasi-Hemispherical
- 2.5. Housed Quasi-Hemispherical
Cdznte Detector Segmentation By Geography
-
1. North America
- 1.1. United States
- 1.2. Canada
- 1.3. Mexico
-
2. South America
- 2.1. Brazil
- 2.2. Argentina
- 2.3. Rest of South America
-
3. Europe
- 3.1. United Kingdom
- 3.2. Germany
- 3.3. France
- 3.4. Italy
- 3.5. Spain
- 3.6. Russia
- 3.7. Benelux
- 3.8. Nordics
- 3.9. Rest of Europe
-
4. Middle East & Africa
- 4.1. Turkey
- 4.2. Israel
- 4.3. GCC
- 4.4. North Africa
- 4.5. South Africa
- 4.6. Rest of Middle East & Africa
-
5. Asia Pacific
- 5.1. China
- 5.2. India
- 5.3. Japan
- 5.4. South Korea
- 5.5. ASEAN
- 5.6. Oceania
- 5.7. Rest of Asia Pacific
Cdznte Detector Regional Market Share
Geographic Coverage of Cdznte Detector
Cdznte Detector REPORT HIGHLIGHTS
| Aspects | Details |
|---|---|
| Study Period | 2020-2034 |
| Base Year | 2025 |
| Estimated Year | 2026 |
| Forecast Period | 2026-2034 |
| Historical Period | 2020-2025 |
| Growth Rate | CAGR of XXX% from 2020-2034 |
| Segmentation |
|
Table of Contents
- 1. Introduction
- 1.1. Research Scope
- 1.2. Market Segmentation
- 1.3. Research Objective
- 1.4. Definitions and Assumptions
- 2. Executive Summary
- 2.1. Market Snapshot
- 3. Market Dynamics
- 3.1. Market Drivers
- 3.2. Market Restrains
- 3.3. Market Trends
- 3.4. Market Opportunities
- 4. Market Factor Analysis
- 4.1. Porters Five Forces
- 4.1.1. Bargaining Power of Suppliers
- 4.1.2. Bargaining Power of Buyers
- 4.1.3. Threat of New Entrants
- 4.1.4. Threat of Substitutes
- 4.1.5. Competitive Rivalry
- 4.2. PESTEL analysis
- 4.3. BCG Analysis
- 4.3.1. Stars (High Growth, High Market Share)
- 4.3.2. Cash Cows (Low Growth, High Market Share)
- 4.3.3. Question Mark (High Growth, Low Market Share)
- 4.3.4. Dogs (Low Growth, Low Market Share)
- 4.4. Ansoff Matrix Analysis
- 4.5. Supply Chain Analysis
- 4.6. Regulatory Landscape
- 4.7. Current Market Potential and Opportunity Assessment (TAM–SAM–SOM Framework)
- 4.8. DMV Analyst Note
- 4.1. Porters Five Forces
- 5. Market Analysis, Insights and Forecast 2021-2033
- 5.1. Market Analysis, Insights and Forecast - by Application
- 5.1.1. Medical Applications
- 5.1.2. Industrial Applications
- 5.1.3. Military and Homeland Security
- 5.1.4. Laboratory Applications
- 5.1.5. Other Applications
- 5.2. Market Analysis, Insights and Forecast - by Type
- 5.2.1. Pixelated
- 5.2.2. Coplanar Grid
- 5.2.3. Planar-Type
- 5.2.4. Quasi-Hemispherical
- 5.2.5. Housed Quasi-Hemispherical
- 5.3. Market Analysis, Insights and Forecast - by Region
- 5.3.1. North America
- 5.3.2. South America
- 5.3.3. Europe
- 5.3.4. Middle East & Africa
- 5.3.5. Asia Pacific
- 5.1. Market Analysis, Insights and Forecast - by Application
- 6. Global Cdznte Detector Analysis, Insights and Forecast, 2021-2033
- 6.1. Market Analysis, Insights and Forecast - by Application
- 6.1.1. Medical Applications
- 6.1.2. Industrial Applications
- 6.1.3. Military and Homeland Security
- 6.1.4. Laboratory Applications
- 6.1.5. Other Applications
- 6.2. Market Analysis, Insights and Forecast - by Type
- 6.2.1. Pixelated
- 6.2.2. Coplanar Grid
- 6.2.3. Planar-Type
- 6.2.4. Quasi-Hemispherical
- 6.2.5. Housed Quasi-Hemispherical
- 6.1. Market Analysis, Insights and Forecast - by Application
- 7. North America Cdznte Detector Analysis, Insights and Forecast, 2020-2032
- 7.1. Market Analysis, Insights and Forecast - by Application
- 7.1.1. Medical Applications
- 7.1.2. Industrial Applications
- 7.1.3. Military and Homeland Security
- 7.1.4. Laboratory Applications
- 7.1.5. Other Applications
- 7.2. Market Analysis, Insights and Forecast - by Type
- 7.2.1. Pixelated
- 7.2.2. Coplanar Grid
- 7.2.3. Planar-Type
- 7.2.4. Quasi-Hemispherical
- 7.2.5. Housed Quasi-Hemispherical
- 7.1. Market Analysis, Insights and Forecast - by Application
- 8. South America Cdznte Detector Analysis, Insights and Forecast, 2020-2032
- 8.1. Market Analysis, Insights and Forecast - by Application
- 8.1.1. Medical Applications
- 8.1.2. Industrial Applications
- 8.1.3. Military and Homeland Security
- 8.1.4. Laboratory Applications
- 8.1.5. Other Applications
- 8.2. Market Analysis, Insights and Forecast - by Type
- 8.2.1. Pixelated
- 8.2.2. Coplanar Grid
- 8.2.3. Planar-Type
- 8.2.4. Quasi-Hemispherical
- 8.2.5. Housed Quasi-Hemispherical
- 8.1. Market Analysis, Insights and Forecast - by Application
- 9. Europe Cdznte Detector Analysis, Insights and Forecast, 2020-2032
- 9.1. Market Analysis, Insights and Forecast - by Application
- 9.1.1. Medical Applications
- 9.1.2. Industrial Applications
- 9.1.3. Military and Homeland Security
- 9.1.4. Laboratory Applications
- 9.1.5. Other Applications
- 9.2. Market Analysis, Insights and Forecast - by Type
- 9.2.1. Pixelated
- 9.2.2. Coplanar Grid
- 9.2.3. Planar-Type
- 9.2.4. Quasi-Hemispherical
- 9.2.5. Housed Quasi-Hemispherical
- 9.1. Market Analysis, Insights and Forecast - by Application
- 10. Middle East & Africa Cdznte Detector Analysis, Insights and Forecast, 2020-2032
- 10.1. Market Analysis, Insights and Forecast - by Application
- 10.1.1. Medical Applications
- 10.1.2. Industrial Applications
- 10.1.3. Military and Homeland Security
- 10.1.4. Laboratory Applications
- 10.1.5. Other Applications
- 10.2. Market Analysis, Insights and Forecast - by Type
- 10.2.1. Pixelated
- 10.2.2. Coplanar Grid
- 10.2.3. Planar-Type
- 10.2.4. Quasi-Hemispherical
- 10.2.5. Housed Quasi-Hemispherical
- 10.1. Market Analysis, Insights and Forecast - by Application
- 11. Asia Pacific Cdznte Detector Analysis, Insights and Forecast, 2020-2032
- 11.1. Market Analysis, Insights and Forecast - by Application
- 11.1.1. Medical Applications
- 11.1.2. Industrial Applications
- 11.1.3. Military and Homeland Security
- 11.1.4. Laboratory Applications
- 11.1.5. Other Applications
- 11.2. Market Analysis, Insights and Forecast - by Type
- 11.2.1. Pixelated
- 11.2.2. Coplanar Grid
- 11.2.3. Planar-Type
- 11.2.4. Quasi-Hemispherical
- 11.2.5. Housed Quasi-Hemispherical
- 11.1. Market Analysis, Insights and Forecast - by Application
- 12. Competitive Analysis
- 12.1. Company Profiles
- 12.1.1 Redlen Technologies
- 12.1.1.1. Company Overview
- 12.1.1.2. Products
- 12.1.1.3. Company Financials
- 12.1.1.4. SWOT Analysis
- 12.1.2 Kromek
- 12.1.2.1. Company Overview
- 12.1.2.2. Products
- 12.1.2.3. Company Financials
- 12.1.2.4. SWOT Analysis
- 12.1.3 Gammadata
- 12.1.3.1. Company Overview
- 12.1.3.2. Products
- 12.1.3.3. Company Financials
- 12.1.3.4. SWOT Analysis
- 12.1.4 Mirion Technologies
- 12.1.4.1. Company Overview
- 12.1.4.2. Products
- 12.1.4.3. Company Financials
- 12.1.4.4. SWOT Analysis
- 12.1.5 Eurorad
- 12.1.5.1. Company Overview
- 12.1.5.2. Products
- 12.1.5.3. Company Financials
- 12.1.5.4. SWOT Analysis
- 12.1.6 Imdetek
- 12.1.6.1. Company Overview
- 12.1.6.2. Products
- 12.1.6.3. Company Financials
- 12.1.6.4. SWOT Analysis
- 12.1.7 XZ LAB
- 12.1.7.1. Company Overview
- 12.1.7.2. Products
- 12.1.7.3. Company Financials
- 12.1.7.4. SWOT Analysis
- 12.1.8 ZRF Ritec SIA
- 12.1.8.1. Company Overview
- 12.1.8.2. Products
- 12.1.8.3. Company Financials
- 12.1.8.4. SWOT Analysis
- 12.1.9 Baltic Scientific Instruments (BSI)
- 12.1.9.1. Company Overview
- 12.1.9.2. Products
- 12.1.9.3. Company Financials
- 12.1.9.4. SWOT Analysis
- 12.1.1 Redlen Technologies
- 12.2. Market Entropy
- 12.2.1 Company's Key Areas Served
- 12.2.2 Recent Developments
- 12.3. Company Market Share Analysis 2025
- 12.3.1 Top 5 Companies Market Share Analysis
- 12.3.2 Top 3 Companies Market Share Analysis
- 12.4. List of Potential Customers
- 13. Research Methodology
List of Figures
- Figure 1: Global Cdznte Detector Revenue Breakdown (million, %) by Region 2025 & 2033
- Figure 2: Global Cdznte Detector Volume Breakdown (K, %) by Region 2025 & 2033
- Figure 3: North America Cdznte Detector Revenue (million), by Application 2025 & 2033
- Figure 4: North America Cdznte Detector Volume (K), by Application 2025 & 2033
- Figure 5: North America Cdznte Detector Revenue Share (%), by Application 2025 & 2033
- Figure 6: North America Cdznte Detector Volume Share (%), by Application 2025 & 2033
- Figure 7: North America Cdznte Detector Revenue (million), by Type 2025 & 2033
- Figure 8: North America Cdznte Detector Volume (K), by Type 2025 & 2033
- Figure 9: North America Cdznte Detector Revenue Share (%), by Type 2025 & 2033
- Figure 10: North America Cdznte Detector Volume Share (%), by Type 2025 & 2033
- Figure 11: North America Cdznte Detector Revenue (million), by Country 2025 & 2033
- Figure 12: North America Cdznte Detector Volume (K), by Country 2025 & 2033
- Figure 13: North America Cdznte Detector Revenue Share (%), by Country 2025 & 2033
- Figure 14: North America Cdznte Detector Volume Share (%), by Country 2025 & 2033
- Figure 15: South America Cdznte Detector Revenue (million), by Application 2025 & 2033
- Figure 16: South America Cdznte Detector Volume (K), by Application 2025 & 2033
- Figure 17: South America Cdznte Detector Revenue Share (%), by Application 2025 & 2033
- Figure 18: South America Cdznte Detector Volume Share (%), by Application 2025 & 2033
- Figure 19: South America Cdznte Detector Revenue (million), by Type 2025 & 2033
- Figure 20: South America Cdznte Detector Volume (K), by Type 2025 & 2033
- Figure 21: South America Cdznte Detector Revenue Share (%), by Type 2025 & 2033
- Figure 22: South America Cdznte Detector Volume Share (%), by Type 2025 & 2033
- Figure 23: South America Cdznte Detector Revenue (million), by Country 2025 & 2033
- Figure 24: South America Cdznte Detector Volume (K), by Country 2025 & 2033
- Figure 25: South America Cdznte Detector Revenue Share (%), by Country 2025 & 2033
- Figure 26: South America Cdznte Detector Volume Share (%), by Country 2025 & 2033
- Figure 27: Europe Cdznte Detector Revenue (million), by Application 2025 & 2033
- Figure 28: Europe Cdznte Detector Volume (K), by Application 2025 & 2033
- Figure 29: Europe Cdznte Detector Revenue Share (%), by Application 2025 & 2033
- Figure 30: Europe Cdznte Detector Volume Share (%), by Application 2025 & 2033
- Figure 31: Europe Cdznte Detector Revenue (million), by Type 2025 & 2033
- Figure 32: Europe Cdznte Detector Volume (K), by Type 2025 & 2033
- Figure 33: Europe Cdznte Detector Revenue Share (%), by Type 2025 & 2033
- Figure 34: Europe Cdznte Detector Volume Share (%), by Type 2025 & 2033
- Figure 35: Europe Cdznte Detector Revenue (million), by Country 2025 & 2033
- Figure 36: Europe Cdznte Detector Volume (K), by Country 2025 & 2033
- Figure 37: Europe Cdznte Detector Revenue Share (%), by Country 2025 & 2033
- Figure 38: Europe Cdznte Detector Volume Share (%), by Country 2025 & 2033
- Figure 39: Middle East & Africa Cdznte Detector Revenue (million), by Application 2025 & 2033
- Figure 40: Middle East & Africa Cdznte Detector Volume (K), by Application 2025 & 2033
- Figure 41: Middle East & Africa Cdznte Detector Revenue Share (%), by Application 2025 & 2033
- Figure 42: Middle East & Africa Cdznte Detector Volume Share (%), by Application 2025 & 2033
- Figure 43: Middle East & Africa Cdznte Detector Revenue (million), by Type 2025 & 2033
- Figure 44: Middle East & Africa Cdznte Detector Volume (K), by Type 2025 & 2033
- Figure 45: Middle East & Africa Cdznte Detector Revenue Share (%), by Type 2025 & 2033
- Figure 46: Middle East & Africa Cdznte Detector Volume Share (%), by Type 2025 & 2033
- Figure 47: Middle East & Africa Cdznte Detector Revenue (million), by Country 2025 & 2033
- Figure 48: Middle East & Africa Cdznte Detector Volume (K), by Country 2025 & 2033
- Figure 49: Middle East & Africa Cdznte Detector Revenue Share (%), by Country 2025 & 2033
- Figure 50: Middle East & Africa Cdznte Detector Volume Share (%), by Country 2025 & 2033
- Figure 51: Asia Pacific Cdznte Detector Revenue (million), by Application 2025 & 2033
- Figure 52: Asia Pacific Cdznte Detector Volume (K), by Application 2025 & 2033
- Figure 53: Asia Pacific Cdznte Detector Revenue Share (%), by Application 2025 & 2033
- Figure 54: Asia Pacific Cdznte Detector Volume Share (%), by Application 2025 & 2033
- Figure 55: Asia Pacific Cdznte Detector Revenue (million), by Type 2025 & 2033
- Figure 56: Asia Pacific Cdznte Detector Volume (K), by Type 2025 & 2033
- Figure 57: Asia Pacific Cdznte Detector Revenue Share (%), by Type 2025 & 2033
- Figure 58: Asia Pacific Cdznte Detector Volume Share (%), by Type 2025 & 2033
- Figure 59: Asia Pacific Cdznte Detector Revenue (million), by Country 2025 & 2033
- Figure 60: Asia Pacific Cdznte Detector Volume (K), by Country 2025 & 2033
- Figure 61: Asia Pacific Cdznte Detector Revenue Share (%), by Country 2025 & 2033
- Figure 62: Asia Pacific Cdznte Detector Volume Share (%), by Country 2025 & 2033
List of Tables
- Table 1: Global Cdznte Detector Revenue million Forecast, by Application 2020 & 2033
- Table 2: Global Cdznte Detector Volume K Forecast, by Application 2020 & 2033
- Table 3: Global Cdznte Detector Revenue million Forecast, by Type 2020 & 2033
- Table 4: Global Cdznte Detector Volume K Forecast, by Type 2020 & 2033
- Table 5: Global Cdznte Detector Revenue million Forecast, by Region 2020 & 2033
- Table 6: Global Cdznte Detector Volume K Forecast, by Region 2020 & 2033
- Table 7: Global Cdznte Detector Revenue million Forecast, by Application 2020 & 2033
- Table 8: Global Cdznte Detector Volume K Forecast, by Application 2020 & 2033
- Table 9: Global Cdznte Detector Revenue million Forecast, by Type 2020 & 2033
- Table 10: Global Cdznte Detector Volume K Forecast, by Type 2020 & 2033
- Table 11: Global Cdznte Detector Revenue million Forecast, by Country 2020 & 2033
- Table 12: Global Cdznte Detector Volume K Forecast, by Country 2020 & 2033
- Table 13: United States Cdznte Detector Revenue (million) Forecast, by Application 2020 & 2033
- Table 14: United States Cdznte Detector Volume (K) Forecast, by Application 2020 & 2033
- Table 15: Canada Cdznte Detector Revenue (million) Forecast, by Application 2020 & 2033
- Table 16: Canada Cdznte Detector Volume (K) Forecast, by Application 2020 & 2033
- Table 17: Mexico Cdznte Detector Revenue (million) Forecast, by Application 2020 & 2033
- Table 18: Mexico Cdznte Detector Volume (K) Forecast, by Application 2020 & 2033
- Table 19: Global Cdznte Detector Revenue million Forecast, by Application 2020 & 2033
- Table 20: Global Cdznte Detector Volume K Forecast, by Application 2020 & 2033
- Table 21: Global Cdznte Detector Revenue million Forecast, by Type 2020 & 2033
- Table 22: Global Cdznte Detector Volume K Forecast, by Type 2020 & 2033
- Table 23: Global Cdznte Detector Revenue million Forecast, by Country 2020 & 2033
- Table 24: Global Cdznte Detector Volume K Forecast, by Country 2020 & 2033
- Table 25: Brazil Cdznte Detector Revenue (million) Forecast, by Application 2020 & 2033
- Table 26: Brazil Cdznte Detector Volume (K) Forecast, by Application 2020 & 2033
- Table 27: Argentina Cdznte Detector Revenue (million) Forecast, by Application 2020 & 2033
- Table 28: Argentina Cdznte Detector Volume (K) Forecast, by Application 2020 & 2033
- Table 29: Rest of South America Cdznte Detector Revenue (million) Forecast, by Application 2020 & 2033
- Table 30: Rest of South America Cdznte Detector Volume (K) Forecast, by Application 2020 & 2033
- Table 31: Global Cdznte Detector Revenue million Forecast, by Application 2020 & 2033
- Table 32: Global Cdznte Detector Volume K Forecast, by Application 2020 & 2033
- Table 33: Global Cdznte Detector Revenue million Forecast, by Type 2020 & 2033
- Table 34: Global Cdznte Detector Volume K Forecast, by Type 2020 & 2033
- Table 35: Global Cdznte Detector Revenue million Forecast, by Country 2020 & 2033
- Table 36: Global Cdznte Detector Volume K Forecast, by Country 2020 & 2033
- Table 37: United Kingdom Cdznte Detector Revenue (million) Forecast, by Application 2020 & 2033
- Table 38: United Kingdom Cdznte Detector Volume (K) Forecast, by Application 2020 & 2033
- Table 39: Germany Cdznte Detector Revenue (million) Forecast, by Application 2020 & 2033
- Table 40: Germany Cdznte Detector Volume (K) Forecast, by Application 2020 & 2033
- Table 41: France Cdznte Detector Revenue (million) Forecast, by Application 2020 & 2033
- Table 42: France Cdznte Detector Volume (K) Forecast, by Application 2020 & 2033
- Table 43: Italy Cdznte Detector Revenue (million) Forecast, by Application 2020 & 2033
- Table 44: Italy Cdznte Detector Volume (K) Forecast, by Application 2020 & 2033
- Table 45: Spain Cdznte Detector Revenue (million) Forecast, by Application 2020 & 2033
- Table 46: Spain Cdznte Detector Volume (K) Forecast, by Application 2020 & 2033
- Table 47: Russia Cdznte Detector Revenue (million) Forecast, by Application 2020 & 2033
- Table 48: Russia Cdznte Detector Volume (K) Forecast, by Application 2020 & 2033
- Table 49: Benelux Cdznte Detector Revenue (million) Forecast, by Application 2020 & 2033
- Table 50: Benelux Cdznte Detector Volume (K) Forecast, by Application 2020 & 2033
- Table 51: Nordics Cdznte Detector Revenue (million) Forecast, by Application 2020 & 2033
- Table 52: Nordics Cdznte Detector Volume (K) Forecast, by Application 2020 & 2033
- Table 53: Rest of Europe Cdznte Detector Revenue (million) Forecast, by Application 2020 & 2033
- Table 54: Rest of Europe Cdznte Detector Volume (K) Forecast, by Application 2020 & 2033
- Table 55: Global Cdznte Detector Revenue million Forecast, by Application 2020 & 2033
- Table 56: Global Cdznte Detector Volume K Forecast, by Application 2020 & 2033
- Table 57: Global Cdznte Detector Revenue million Forecast, by Type 2020 & 2033
- Table 58: Global Cdznte Detector Volume K Forecast, by Type 2020 & 2033
- Table 59: Global Cdznte Detector Revenue million Forecast, by Country 2020 & 2033
- Table 60: Global Cdznte Detector Volume K Forecast, by Country 2020 & 2033
- Table 61: Turkey Cdznte Detector Revenue (million) Forecast, by Application 2020 & 2033
- Table 62: Turkey Cdznte Detector Volume (K) Forecast, by Application 2020 & 2033
- Table 63: Israel Cdznte Detector Revenue (million) Forecast, by Application 2020 & 2033
- Table 64: Israel Cdznte Detector Volume (K) Forecast, by Application 2020 & 2033
- Table 65: GCC Cdznte Detector Revenue (million) Forecast, by Application 2020 & 2033
- Table 66: GCC Cdznte Detector Volume (K) Forecast, by Application 2020 & 2033
- Table 67: North Africa Cdznte Detector Revenue (million) Forecast, by Application 2020 & 2033
- Table 68: North Africa Cdznte Detector Volume (K) Forecast, by Application 2020 & 2033
- Table 69: South Africa Cdznte Detector Revenue (million) Forecast, by Application 2020 & 2033
- Table 70: South Africa Cdznte Detector Volume (K) Forecast, by Application 2020 & 2033
- Table 71: Rest of Middle East & Africa Cdznte Detector Revenue (million) Forecast, by Application 2020 & 2033
- Table 72: Rest of Middle East & Africa Cdznte Detector Volume (K) Forecast, by Application 2020 & 2033
- Table 73: Global Cdznte Detector Revenue million Forecast, by Application 2020 & 2033
- Table 74: Global Cdznte Detector Volume K Forecast, by Application 2020 & 2033
- Table 75: Global Cdznte Detector Revenue million Forecast, by Type 2020 & 2033
- Table 76: Global Cdznte Detector Volume K Forecast, by Type 2020 & 2033
- Table 77: Global Cdznte Detector Revenue million Forecast, by Country 2020 & 2033
- Table 78: Global Cdznte Detector Volume K Forecast, by Country 2020 & 2033
- Table 79: China Cdznte Detector Revenue (million) Forecast, by Application 2020 & 2033
- Table 80: China Cdznte Detector Volume (K) Forecast, by Application 2020 & 2033
- Table 81: India Cdznte Detector Revenue (million) Forecast, by Application 2020 & 2033
- Table 82: India Cdznte Detector Volume (K) Forecast, by Application 2020 & 2033
- Table 83: Japan Cdznte Detector Revenue (million) Forecast, by Application 2020 & 2033
- Table 84: Japan Cdznte Detector Volume (K) Forecast, by Application 2020 & 2033
- Table 85: South Korea Cdznte Detector Revenue (million) Forecast, by Application 2020 & 2033
- Table 86: South Korea Cdznte Detector Volume (K) Forecast, by Application 2020 & 2033
- Table 87: ASEAN Cdznte Detector Revenue (million) Forecast, by Application 2020 & 2033
- Table 88: ASEAN Cdznte Detector Volume (K) Forecast, by Application 2020 & 2033
- Table 89: Oceania Cdznte Detector Revenue (million) Forecast, by Application 2020 & 2033
- Table 90: Oceania Cdznte Detector Volume (K) Forecast, by Application 2020 & 2033
- Table 91: Rest of Asia Pacific Cdznte Detector Revenue (million) Forecast, by Application 2020 & 2033
- Table 92: Rest of Asia Pacific Cdznte Detector Volume (K) Forecast, by Application 2020 & 2033
Frequently Asked Questions
1. What is the projected Compound Annual Growth Rate (CAGR) of the Cdznte Detector?
The projected CAGR is approximately XXX%.
2. Which companies are prominent players in the Cdznte Detector?
Key companies in the market include Redlen Technologies, Kromek, Gammadata, Mirion Technologies, Eurorad, Imdetek, XZ LAB, ZRF Ritec SIA, Baltic Scientific Instruments (BSI).
3. What are the main segments of the Cdznte Detector?
The market segments include Application, Type.
4. Can you provide details about the market size?
The market size is estimated to be USD XXX million as of 2022.
5. What are some drivers contributing to market growth?
N/A
6. What are the notable trends driving market growth?
N/A
7. Are there any restraints impacting market growth?
N/A
8. Can you provide examples of recent developments in the market?
N/A
9. What pricing options are available for accessing the report?
Pricing options include single-user, multi-user, and enterprise licenses priced at USD 3950.00, USD 5925.00, and USD 7900.00 respectively.
10. Is the market size provided in terms of value or volume?
The market size is provided in terms of value, measured in million and volume, measured in K.
11. Are there any specific market keywords associated with the report?
Yes, the market keyword associated with the report is "Cdznte Detector," which aids in identifying and referencing the specific market segment covered.
12. How do I determine which pricing option suits my needs best?
The pricing options vary based on user requirements and access needs. Individual users may opt for single-user licenses, while businesses requiring broader access may choose multi-user or enterprise licenses for cost-effective access to the report.
13. Are there any additional resources or data provided in the Cdznte Detector report?
While the report offers comprehensive insights, it's advisable to review the specific contents or supplementary materials provided to ascertain if additional resources or data are available.
14. How can I stay updated on further developments or reports in the Cdznte Detector?
To stay informed about further developments, trends, and reports in the Cdznte Detector, consider subscribing to industry newsletters, following relevant companies and organizations, or regularly checking reputable industry news sources and publications.
Methodology
Step 1 - Identification of Relevant Samples Size from Population Database


Step 2 - Approaches for Defining Global Market Size (Value, Volume* & Price*)

Note*: In applicable scenarios
Step 3 - Data Sources
Primary Research
- Web Analytics
- Survey Reports
- Research Institute
- Latest Research Reports
- Opinion Leaders
Secondary Research
- Annual Reports
- White Paper
- Latest Press Release
- Industry Association
- Paid Database
- Investor Presentations

Step 4 - Data Triangulation
Involves using different sources of information in order to increase the validity of a study
These sources are likely to be stakeholders in a program - participants, other researchers, program staff, other community members, and so on.
Then we put all data in single framework & apply various statistical tools to find out the dynamic on the market.
During the analysis stage, feedback from the stakeholder groups would be compared to determine areas of agreement as well as areas of divergence