

Key Insights
The global CBRNE detectors market is poised for robust expansion, projected to reach a substantial USD 20.22 billion by 2025, fueled by an estimated Compound Annual Growth Rate (CAGR) of 5.9% from 2019 to 2033. This significant market valuation underscores the increasing global emphasis on security and threat detection across critical infrastructure and public spaces. The primary drivers for this growth are the escalating geopolitical tensions, the persistent threat of terrorism, and the growing awareness of the devastating impact of chemical, biological, radiological, nuclear, and explosive (CBRNE) incidents. Governments worldwide are prioritizing investments in advanced detection technologies to safeguard their citizens and national interests. This includes widespread deployment in high-risk areas like airports, train stations, and other public transportation hubs, as well as in sensitive government facilities. The demand is further propelled by advancements in sensor technology, leading to more sensitive, portable, and user-friendly detection devices.
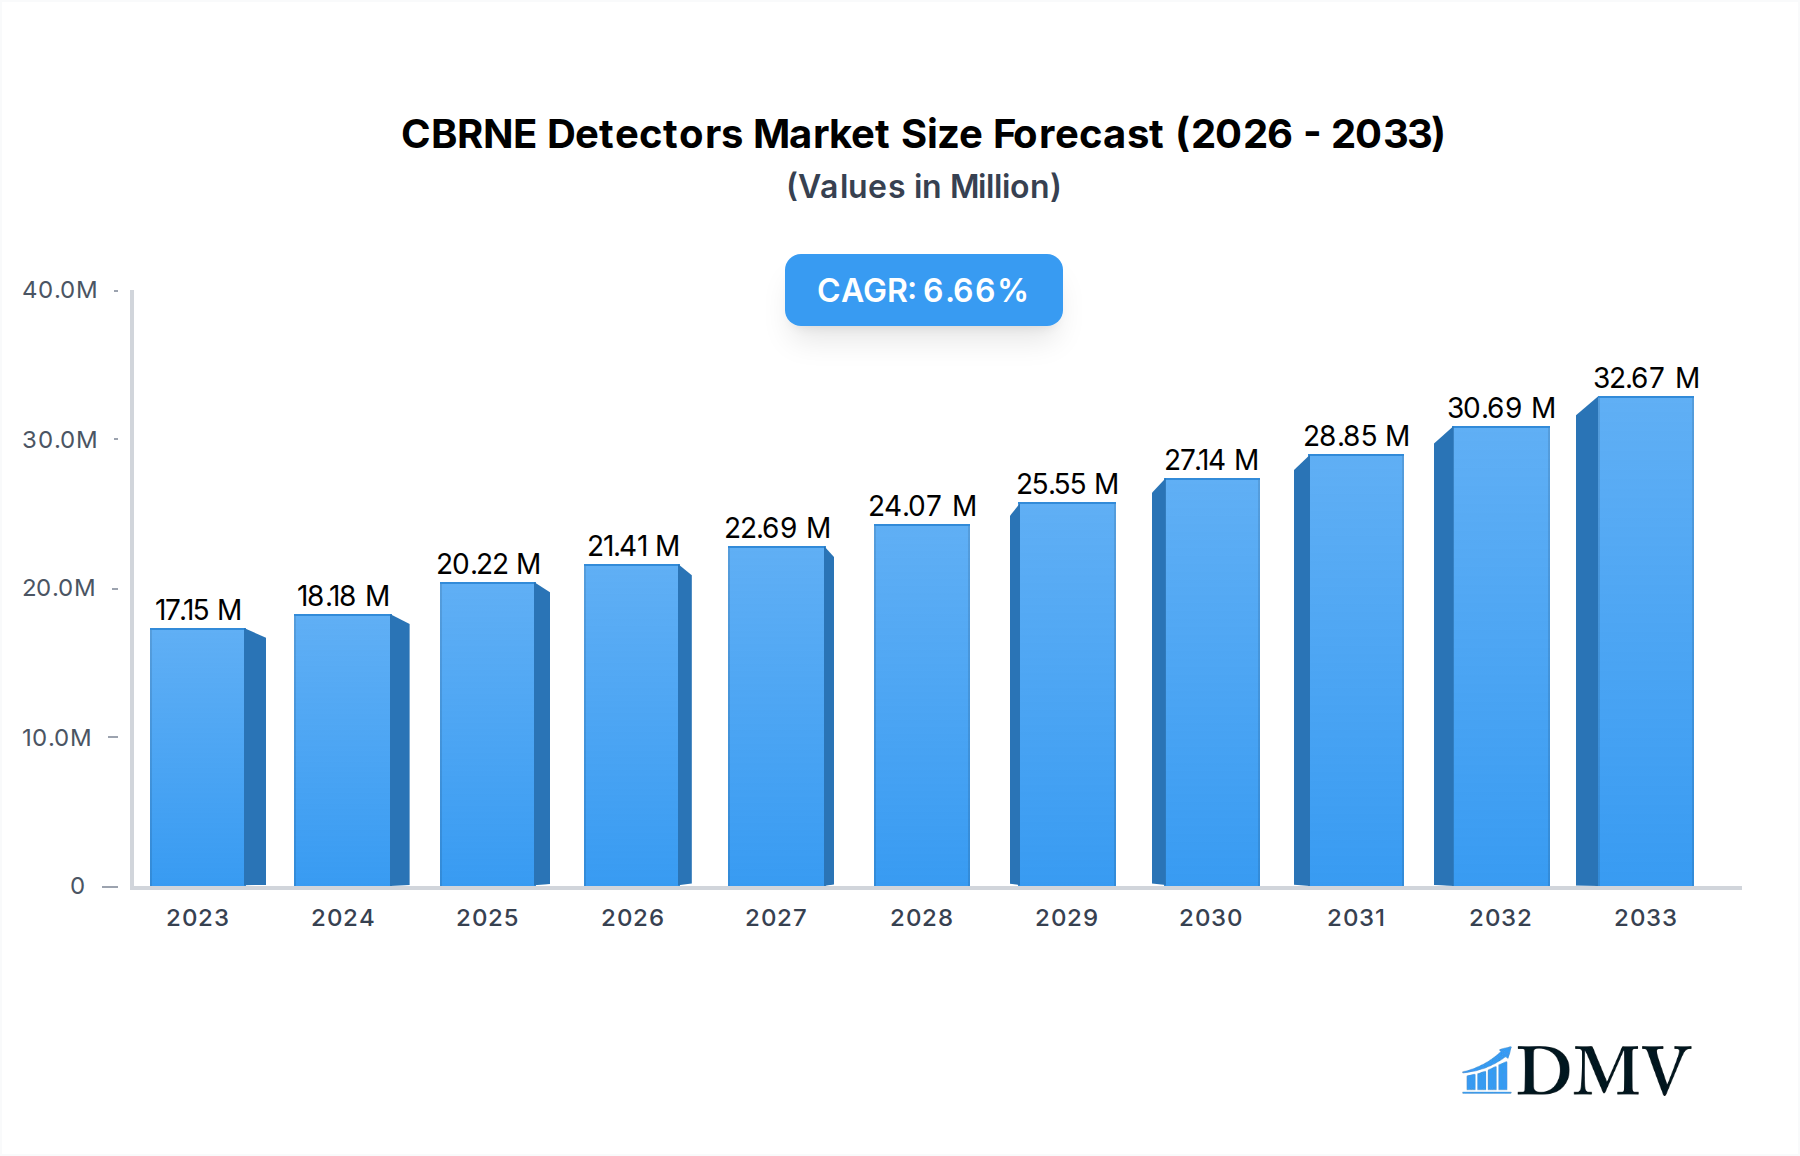
CBRNE Detectors Market Size (In Million)
The market dynamics are characterized by a clear trend towards integrated and networked detection systems, enabling real-time monitoring and rapid response capabilities. Fixed detection systems, offering continuous surveillance in strategic locations, are complemented by the growing adoption of handheld devices for on-the-spot identification and verification. The market's growth trajectory is expected to be supported by ongoing research and development efforts focused on miniaturization, improved accuracy, and cost-effectiveness of CBRNE detectors. While the market presents a promising outlook, potential restraints such as high initial investment costs for advanced systems and the need for continuous training and maintenance of personnel could pose challenges. However, the overarching need for enhanced public safety and homeland security will likely outweigh these concerns, ensuring sustained market development.

CBRNE Detectors Company Market Share
CBRNE Detectors Market Composition & Trends
The CBRNE Detectors market demonstrates a moderate to high concentration, driven by key players like Bruker, FLIR Systems, CNIM Group (Bertin Instruments), Detection Technologies Ltd., and Kromek Group plc, who collectively command a substantial market share, estimated to be in the billions. Innovation catalysts are primarily focused on enhancing sensitivity, speed of detection, and portability of devices, fueled by increasing governmental investment and a growing awareness of homeland security threats. The regulatory landscape is becoming increasingly stringent, with evolving standards for detection capabilities and interoperability, pushing manufacturers to continually invest in research and development, projected to be in the billions during the forecast period. Substitute products, such as advanced laboratory testing methods, exist but are often not suitable for real-time, on-site detection needs. End-user profiles span critical sectors including Government (defense, first responders), Airport security, Train Station checkpoints, and other industrial applications requiring threat detection. Mergers & Acquisitions (M&A) activities are significant, with estimated deal values in the billions, aimed at consolidating market position, acquiring innovative technologies, and expanding geographical reach. For instance, a recent acquisition was valued at approximately 500 million demonstrating strategic consolidation.
- Market Share Distribution: Leading companies hold an estimated 75% of the global market share.
- M&A Deal Values: The total value of M&A deals in the historical period (2019-2024) is estimated at over 1 billion.
- Innovation Investment: R&D expenditure by major players is projected to reach 2 billion annually during the forecast period.
- Regulatory Impact: Compliance with evolving international standards is a key investment driver, estimated to represent 15% of total R&D spending.
CBRNE Detectors Industry Evolution
The CBRNE Detectors industry has undergone a significant transformation, evolving from specialized military applications to broader homeland security and public safety deployments. The study period (2019–2033), with the base year (2025) and estimated year (2025), illustrates a robust growth trajectory. Throughout the historical period (2019–2024), the market experienced a compound annual growth rate (CAGR) of approximately 8.5%, driven by a confluence of factors including rising geopolitical tensions, the persistent threat of terrorism, and an increased focus on public safety at large gatherings and critical infrastructure. Technological advancements have been pivotal, transitioning from bulky, laboratory-bound equipment to sophisticated handheld and fixed detectors offering real-time, on-site identification of chemical, biological, radiological, nuclear, and explosive threats. The adoption of advanced sensor technologies, such as mass spectrometry, ion mobility spectrometry, and advanced spectroscopic methods, has dramatically improved detection limits, specificity, and speed.
The forecast period (2025–2033) anticipates a sustained CAGR of 9.0%, projecting the global market value to reach over 50 billion. This accelerated growth is attributed to several emerging trends. Firstly, there is a continuous push for miniaturization and enhanced user-friendliness, enabling wider deployment by first responders, security personnel, and even civilian agencies. Secondly, the integration of artificial intelligence (AI) and machine learning (ML) into detection systems is revolutionizing data analysis, threat identification, and early warning capabilities, with AI-powered platforms expected to capture 30% of the advanced detection market by 2033. Thirdly, the increasing sophistication of threats necessitates the development of multi-threat detectors capable of identifying a broader spectrum of agents simultaneously. Investments in next-generation technologies, including nanotechnology-based sensors and advanced bio-detection systems, are also gaining momentum. Furthermore, the growing recognition of CBRNE threats in civilian environments, such as public transportation hubs (Airport, Train Station) and major events, has spurred demand for readily deployable and cost-effective detection solutions. Government initiatives and funding for homeland security are expected to remain a significant growth catalyst. The industry is actively responding to the demand for networked detection systems, allowing for centralized monitoring and rapid response coordination, with an estimated 20% increase in networked system deployments by 2030.
Leading Regions, Countries, or Segments in CBRNE Detectors
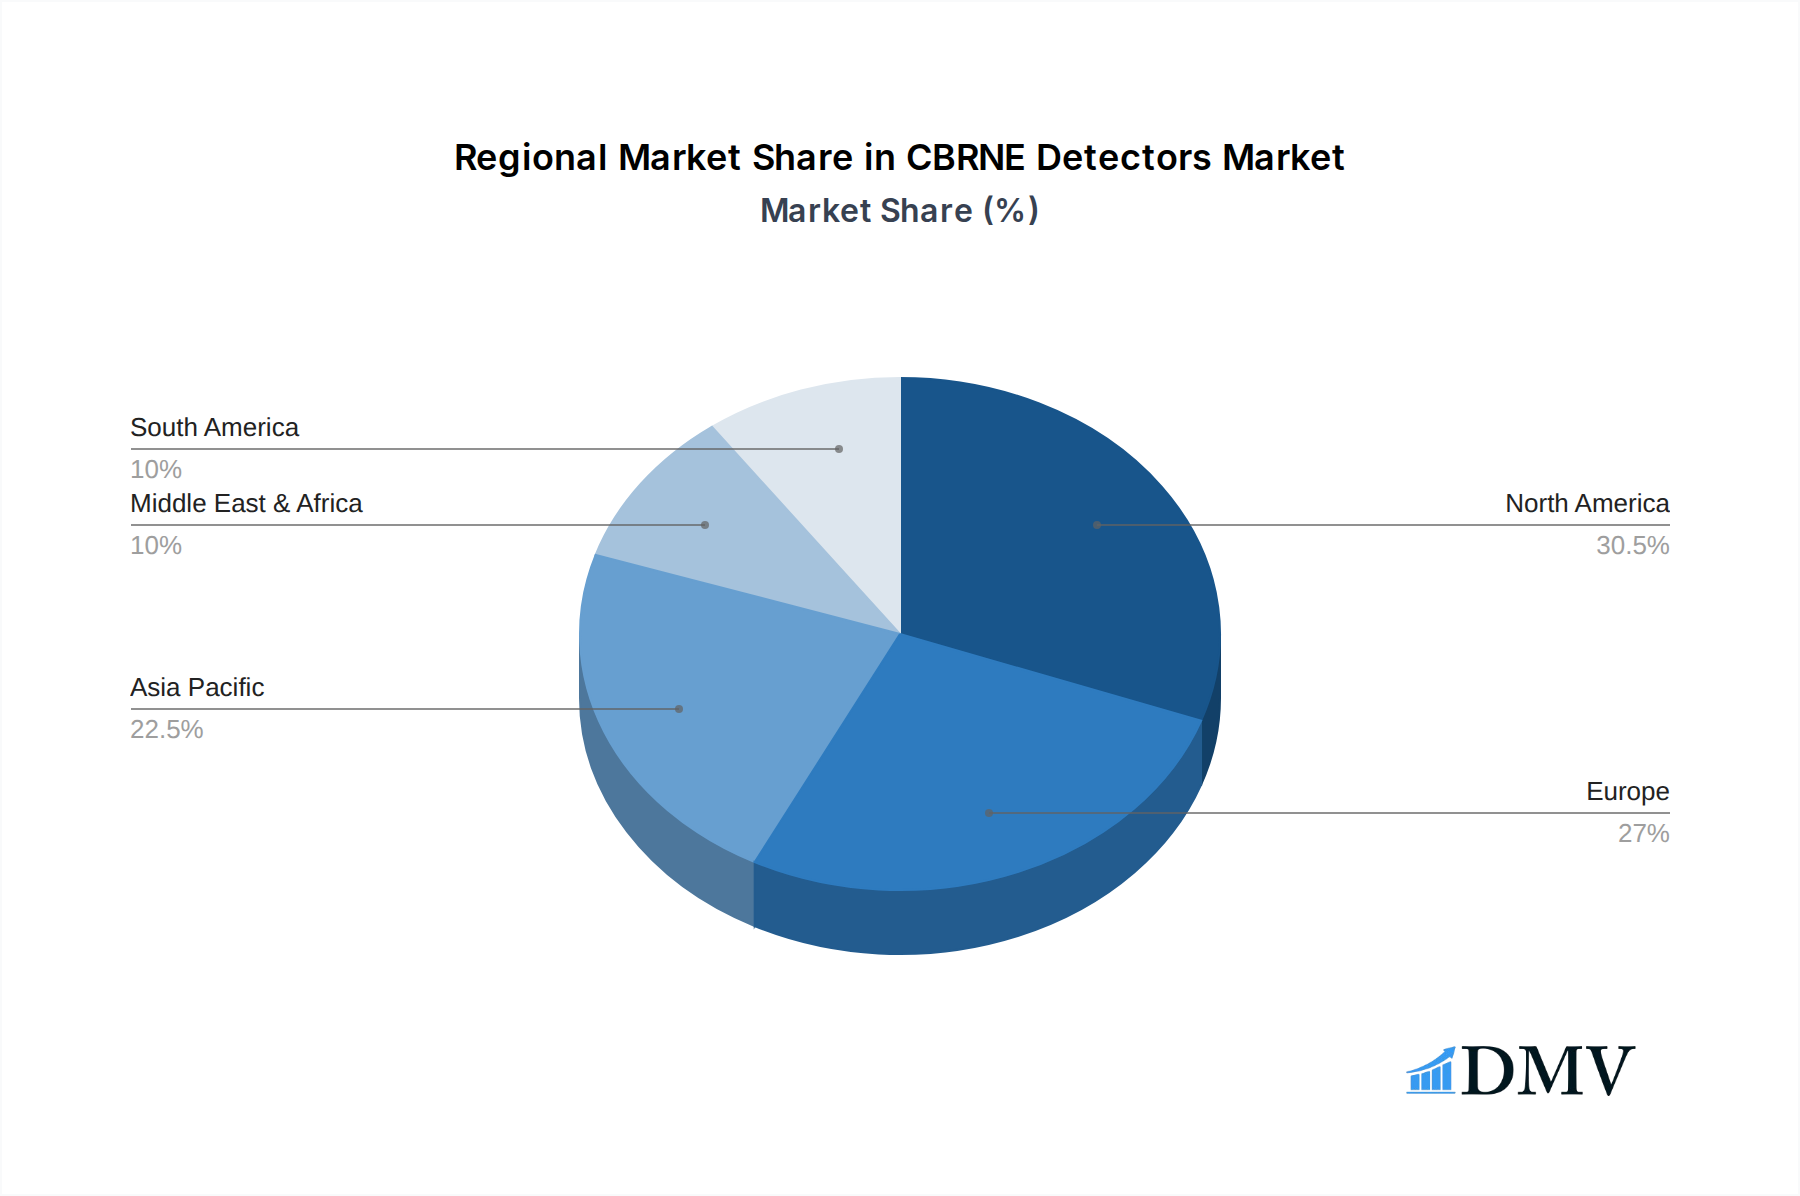
The Government application segment is unequivocally the dominant force within the CBRNE Detectors market, demonstrating unparalleled investment and demand driven by national security imperatives. This dominance is further amplified by the critical role governments play in funding research, procurement, and deployment of these advanced threat detection systems. Regions such as North America and Europe spearhead this trend, owing to their proactive approach to counter-terrorism, substantial defense budgets, and stringent regulatory frameworks mandating advanced security measures. Within these regions, countries like the United States and European Union member states are significant hubs for both demand and innovation, contributing an estimated 60% of the global market revenue. The United States alone accounts for an estimated 35% of the global market due to extensive federal funding for defense and homeland security agencies.
The dominance of the Government segment is underpinned by several key drivers. Firstly, continuous geopolitical instability and the evolving nature of global threats necessitate constant vigilance and the acquisition of cutting-edge detection technologies. Governments are investing heavily in protecting their borders, critical infrastructure, and civilian populations from a wide array of CBRNE threats. Secondly, stringent regulatory mandates and international treaties aimed at preventing the proliferation of weapons of mass destruction and combating terrorism compel governments to implement robust detection and response capabilities. These regulations often stipulate specific performance criteria for CBRNE detectors, fostering a demand for high-sensitivity and reliable systems. The estimated annual government expenditure on CBRNE detection systems is in the billions, with projections indicating a steady increase. Thirdly, the increasing frequency of large-scale public events, international summits, and sporting competitions amplifies the need for comprehensive security solutions, including the deployment of both fixed and handheld CBRNE detectors at Airports, Train Stations, and other public venues to ensure public safety. The sheer volume of individuals passing through these areas necessitates sophisticated, real-time threat assessment capabilities.
In terms of device types, while handheld detectors offer unparalleled flexibility and immediate on-the-spot threat identification, particularly for first responders and mobile security teams, the demand for fixed detection systems is also growing significantly, especially for continuous monitoring of high-threat locations like Airports and Train Stations. The integration of advanced sensor networks and automated alert systems within fixed installations represents a significant growth area. The combined market share of the Government, Airport, and Train Station applications is estimated to exceed 85% of the total CBRNE detectors market.
Key Drivers for Government Dominance:
- Escalating national security concerns and counter-terrorism efforts.
- Significant governmental funding for defense and homeland security.
- Stringent regulatory mandates and international security agreements.
- Protection of critical infrastructure and large public gatherings.
Regional Leadership: North America and Europe are leading the market with an estimated 60% combined market share.
Country-Specific Impact: The United States' contribution to the global market is estimated at 35%.
Application Segment Growth: The Government segment is projected to grow at a CAGR of 10% during the forecast period.
CBRNE Detectors Product Innovations
Product innovation in the CBRNE Detectors market is rapidly advancing, focusing on enhanced sensitivity, faster detection times, and greater portability. Recent developments include the introduction of miniaturized mass spectrometers and ion mobility spectrometers that can identify a wider range of chemical and biological agents with improved accuracy, reducing false positives. Advanced spectroscopic techniques, such as Raman and infrared spectroscopy, are being integrated into handheld devices for non-contact, rapid identification of explosives and hazardous materials. Furthermore, there's a growing trend towards networked detection systems, where multiple fixed and handheld units communicate wirelessly, providing real-time situational awareness and enabling faster, more coordinated responses. The development of AI-powered algorithms for threat recognition and anomaly detection further boosts the performance of these innovative solutions, with initial deployments showing a 20% improvement in threat identification speed.
Propelling Factors for CBRNE Detectors Growth
The CBRNE Detectors market is propelled by a potent combination of factors. Escalating global security threats, including terrorism and the potential for state-sponsored attacks, are driving significant governmental investment in advanced threat detection capabilities. Technological advancements, particularly in miniaturization, sensor sensitivity, and data analytics, are creating more effective and user-friendly devices. Evolving regulatory landscapes, with increasingly stringent requirements for public safety and homeland security, are compelling organizations and governments to adopt sophisticated detection solutions. The growing awareness of CBRNE risks in civilian domains, such as transportation hubs and crowded public spaces, is expanding the market beyond traditional defense sectors. Furthermore, initiatives aimed at enhancing preparedness for natural disasters that may involve hazardous materials also contribute to market growth.
- Technological Advancements: Miniaturization, AI integration, and multi-threat detection capabilities.
- Economic Influences: Increased defense budgets and homeland security funding, estimated at over 2 billion annually.
- Regulatory Drivers: Evolving international standards and national security mandates.
Obstacles in the CBRNE Detectors Market
Despite robust growth, the CBRNE Detectors market faces several obstacles. The high cost of advanced detection systems can be a significant barrier for smaller agencies or developing nations, with some high-end systems costing upwards of 500,000. Stringent regulatory approval processes and the need for rigorous validation can delay product launches and market penetration, sometimes extending to 2-3 years. Supply chain disruptions, particularly for specialized components, can impact production timelines and cost-effectiveness. Intense competition among established players and emerging startups can lead to price pressures. Furthermore, the continuous need for operator training and maintenance of complex equipment adds to the overall cost of ownership.
- High Acquisition Cost: Leading to affordability issues for some end-users.
- Regulatory Hurdles: Complex and time-consuming approval processes.
- Supply Chain Vulnerabilities: Affecting availability and pricing of critical components.
Future Opportunities in CBRNE Detectors
The CBRNE Detectors market is poised for significant future opportunities. The expansion into emerging markets with growing security concerns presents a vast untapped potential, with regions like Southeast Asia and South America showing increasing demand. The development of next-generation sensors, utilizing nanotechnology and advanced biological detection techniques, will create new product categories and revenue streams, projected to be worth 10 billion by 2033. Increased integration of AI and IoT technologies will lead to smarter, more interconnected detection networks, enhancing real-time threat assessment and response. Opportunities also lie in providing comprehensive training and maintenance services to support the widespread adoption of these complex systems. The growing emphasis on public health preparedness against biological threats opens new avenues for specialized bio-detectors.
- Emerging Markets: Focus on developing economies with increasing security needs.
- Technological Innovation: Nanotechnology-based sensors and AI-driven analytics.
- Service Offerings: Training, maintenance, and data management solutions.
Major Players in the CBRNE Detectors Ecosystem
- Bruker
- FLIR Systems
- CNIM Group (Bertin Instruments)
- Detection Technologies Ltd.
- Kromek Group plc
Key Developments in CBRNE Detectors Industry
- 2023 Q4: Bruker launched its novel high-resolution Ion Mobility Spectrometry-Mass Spectrometry (IMS-MS) system, enhancing its threat detection capabilities for chemical warfare agents.
- 2024 Q1: FLIR Systems secured a significant contract worth 250 million for the supply of its integrated chemical detection systems to a key government client.
- 2024 Q2: CNIM Group (Bertin Instruments) announced a strategic partnership to enhance its portable CBRNE detector portfolio with advanced AI algorithms.
- 2024 Q3: Detection Technologies Ltd. introduced a new generation of compact, real-time biological threat detectors for air monitoring applications.
- 2024 Q4: Kromek Group plc reported a substantial increase in orders for its radiation detection technology, driven by heightened nuclear security concerns.
- 2025 Q1: Industry-wide discussions on interoperability standards for networked CBRNE detection systems gained significant traction.
Strategic CBRNE Detectors Market Forecast
The strategic CBRNE Detectors market forecast is characterized by robust growth, driven by the persistent need for enhanced national security and public safety. Continued investment in advanced technologies, coupled with expanding applications beyond defense to critical civilian infrastructure like Airports and Train Stations, will fuel market expansion. The emphasis on miniaturization, AI integration, and multi-threat detection capabilities will create significant opportunities for innovation and market penetration. Emerging economies will present substantial growth potential as their security concerns evolve. The industry is well-positioned to capitalize on these trends, with a projected market value exceeding 50 billion by 2033, driven by both technological advancements and an increasing global threat landscape.
CBRNE Detectors Segmentation
-
1. Application
- 1.1. Government
- 1.2. Airport
- 1.3. Train Station
- 1.4. Others
-
2. Types
- 2.1. Fixed
- 2.2. Handheld
CBRNE Detectors Segmentation By Geography
-
1. North America
- 1.1. United States
- 1.2. Canada
- 1.3. Mexico
-
2. South America
- 2.1. Brazil
- 2.2. Argentina
- 2.3. Rest of South America
-
3. Europe
- 3.1. United Kingdom
- 3.2. Germany
- 3.3. France
- 3.4. Italy
- 3.5. Spain
- 3.6. Russia
- 3.7. Benelux
- 3.8. Nordics
- 3.9. Rest of Europe
-
4. Middle East & Africa
- 4.1. Turkey
- 4.2. Israel
- 4.3. GCC
- 4.4. North Africa
- 4.5. South Africa
- 4.6. Rest of Middle East & Africa
-
5. Asia Pacific
- 5.1. China
- 5.2. India
- 5.3. Japan
- 5.4. South Korea
- 5.5. ASEAN
- 5.6. Oceania
- 5.7. Rest of Asia Pacific
CBRNE Detectors Regional Market Share
Geographic Coverage of CBRNE Detectors
CBRNE Detectors REPORT HIGHLIGHTS
| Aspects | Details |
|---|---|
| Study Period | 2020-2034 |
| Base Year | 2025 |
| Estimated Year | 2026 |
| Forecast Period | 2026-2034 |
| Historical Period | 2020-2025 |
| Growth Rate | CAGR of 5.9% from 2020-2034 |
| Segmentation |
|
Table of Contents
- 1. Introduction
- 1.1. Research Scope
- 1.2. Market Segmentation
- 1.3. Research Objective
- 1.4. Definitions and Assumptions
- 2. Executive Summary
- 2.1. Market Snapshot
- 3. Market Dynamics
- 3.1. Market Drivers
- 3.2. Market Restrains
- 3.3. Market Trends
- 3.4. Market Opportunities
- 4. Market Factor Analysis
- 4.1. Porters Five Forces
- 4.1.1. Bargaining Power of Suppliers
- 4.1.2. Bargaining Power of Buyers
- 4.1.3. Threat of New Entrants
- 4.1.4. Threat of Substitutes
- 4.1.5. Competitive Rivalry
- 4.2. PESTEL analysis
- 4.3. BCG Analysis
- 4.3.1. Stars (High Growth, High Market Share)
- 4.3.2. Cash Cows (Low Growth, High Market Share)
- 4.3.3. Question Mark (High Growth, Low Market Share)
- 4.3.4. Dogs (Low Growth, Low Market Share)
- 4.4. Ansoff Matrix Analysis
- 4.5. Supply Chain Analysis
- 4.6. Regulatory Landscape
- 4.7. Current Market Potential and Opportunity Assessment (TAM–SAM–SOM Framework)
- 4.8. DMV Analyst Note
- 4.1. Porters Five Forces
- 5. Market Analysis, Insights and Forecast 2021-2033
- 5.1. Market Analysis, Insights and Forecast - by Application
- 5.1.1. Government
- 5.1.2. Airport
- 5.1.3. Train Station
- 5.1.4. Others
- 5.2. Market Analysis, Insights and Forecast - by Types
- 5.2.1. Fixed
- 5.2.2. Handheld
- 5.3. Market Analysis, Insights and Forecast - by Region
- 5.3.1. North America
- 5.3.2. South America
- 5.3.3. Europe
- 5.3.4. Middle East & Africa
- 5.3.5. Asia Pacific
- 5.1. Market Analysis, Insights and Forecast - by Application
- 6. Global CBRNE Detectors Analysis, Insights and Forecast, 2021-2033
- 6.1. Market Analysis, Insights and Forecast - by Application
- 6.1.1. Government
- 6.1.2. Airport
- 6.1.3. Train Station
- 6.1.4. Others
- 6.2. Market Analysis, Insights and Forecast - by Types
- 6.2.1. Fixed
- 6.2.2. Handheld
- 6.1. Market Analysis, Insights and Forecast - by Application
- 7. North America CBRNE Detectors Analysis, Insights and Forecast, 2020-2032
- 7.1. Market Analysis, Insights and Forecast - by Application
- 7.1.1. Government
- 7.1.2. Airport
- 7.1.3. Train Station
- 7.1.4. Others
- 7.2. Market Analysis, Insights and Forecast - by Types
- 7.2.1. Fixed
- 7.2.2. Handheld
- 7.1. Market Analysis, Insights and Forecast - by Application
- 8. South America CBRNE Detectors Analysis, Insights and Forecast, 2020-2032
- 8.1. Market Analysis, Insights and Forecast - by Application
- 8.1.1. Government
- 8.1.2. Airport
- 8.1.3. Train Station
- 8.1.4. Others
- 8.2. Market Analysis, Insights and Forecast - by Types
- 8.2.1. Fixed
- 8.2.2. Handheld
- 8.1. Market Analysis, Insights and Forecast - by Application
- 9. Europe CBRNE Detectors Analysis, Insights and Forecast, 2020-2032
- 9.1. Market Analysis, Insights and Forecast - by Application
- 9.1.1. Government
- 9.1.2. Airport
- 9.1.3. Train Station
- 9.1.4. Others
- 9.2. Market Analysis, Insights and Forecast - by Types
- 9.2.1. Fixed
- 9.2.2. Handheld
- 9.1. Market Analysis, Insights and Forecast - by Application
- 10. Middle East & Africa CBRNE Detectors Analysis, Insights and Forecast, 2020-2032
- 10.1. Market Analysis, Insights and Forecast - by Application
- 10.1.1. Government
- 10.1.2. Airport
- 10.1.3. Train Station
- 10.1.4. Others
- 10.2. Market Analysis, Insights and Forecast - by Types
- 10.2.1. Fixed
- 10.2.2. Handheld
- 10.1. Market Analysis, Insights and Forecast - by Application
- 11. Asia Pacific CBRNE Detectors Analysis, Insights and Forecast, 2020-2032
- 11.1. Market Analysis, Insights and Forecast - by Application
- 11.1.1. Government
- 11.1.2. Airport
- 11.1.3. Train Station
- 11.1.4. Others
- 11.2. Market Analysis, Insights and Forecast - by Types
- 11.2.1. Fixed
- 11.2.2. Handheld
- 11.1. Market Analysis, Insights and Forecast - by Application
- 12. Competitive Analysis
- 12.1. Company Profiles
- 12.1.1 Bruker
- 12.1.1.1. Company Overview
- 12.1.1.2. Products
- 12.1.1.3. Company Financials
- 12.1.1.4. SWOT Analysis
- 12.1.2 FLIR Systems
- 12.1.2.1. Company Overview
- 12.1.2.2. Products
- 12.1.2.3. Company Financials
- 12.1.2.4. SWOT Analysis
- 12.1.3 CNIM Group (Bertin Instruments)
- 12.1.3.1. Company Overview
- 12.1.3.2. Products
- 12.1.3.3. Company Financials
- 12.1.3.4. SWOT Analysis
- 12.1.4 Detection Technologies Ltd.
- 12.1.4.1. Company Overview
- 12.1.4.2. Products
- 12.1.4.3. Company Financials
- 12.1.4.4. SWOT Analysis
- 12.1.5 Kromek Group plc
- 12.1.5.1. Company Overview
- 12.1.5.2. Products
- 12.1.5.3. Company Financials
- 12.1.5.4. SWOT Analysis
- 12.1.1 Bruker
- 12.2. Market Entropy
- 12.2.1 Company's Key Areas Served
- 12.2.2 Recent Developments
- 12.3. Company Market Share Analysis 2025
- 12.3.1 Top 5 Companies Market Share Analysis
- 12.3.2 Top 3 Companies Market Share Analysis
- 12.4. List of Potential Customers
- 13. Research Methodology
List of Figures
- Figure 1: Global CBRNE Detectors Revenue Breakdown (billion, %) by Region 2025 & 2033
- Figure 2: Global CBRNE Detectors Volume Breakdown (K, %) by Region 2025 & 2033
- Figure 3: North America CBRNE Detectors Revenue (billion), by Application 2025 & 2033
- Figure 4: North America CBRNE Detectors Volume (K), by Application 2025 & 2033
- Figure 5: North America CBRNE Detectors Revenue Share (%), by Application 2025 & 2033
- Figure 6: North America CBRNE Detectors Volume Share (%), by Application 2025 & 2033
- Figure 7: North America CBRNE Detectors Revenue (billion), by Types 2025 & 2033
- Figure 8: North America CBRNE Detectors Volume (K), by Types 2025 & 2033
- Figure 9: North America CBRNE Detectors Revenue Share (%), by Types 2025 & 2033
- Figure 10: North America CBRNE Detectors Volume Share (%), by Types 2025 & 2033
- Figure 11: North America CBRNE Detectors Revenue (billion), by Country 2025 & 2033
- Figure 12: North America CBRNE Detectors Volume (K), by Country 2025 & 2033
- Figure 13: North America CBRNE Detectors Revenue Share (%), by Country 2025 & 2033
- Figure 14: North America CBRNE Detectors Volume Share (%), by Country 2025 & 2033
- Figure 15: South America CBRNE Detectors Revenue (billion), by Application 2025 & 2033
- Figure 16: South America CBRNE Detectors Volume (K), by Application 2025 & 2033
- Figure 17: South America CBRNE Detectors Revenue Share (%), by Application 2025 & 2033
- Figure 18: South America CBRNE Detectors Volume Share (%), by Application 2025 & 2033
- Figure 19: South America CBRNE Detectors Revenue (billion), by Types 2025 & 2033
- Figure 20: South America CBRNE Detectors Volume (K), by Types 2025 & 2033
- Figure 21: South America CBRNE Detectors Revenue Share (%), by Types 2025 & 2033
- Figure 22: South America CBRNE Detectors Volume Share (%), by Types 2025 & 2033
- Figure 23: South America CBRNE Detectors Revenue (billion), by Country 2025 & 2033
- Figure 24: South America CBRNE Detectors Volume (K), by Country 2025 & 2033
- Figure 25: South America CBRNE Detectors Revenue Share (%), by Country 2025 & 2033
- Figure 26: South America CBRNE Detectors Volume Share (%), by Country 2025 & 2033
- Figure 27: Europe CBRNE Detectors Revenue (billion), by Application 2025 & 2033
- Figure 28: Europe CBRNE Detectors Volume (K), by Application 2025 & 2033
- Figure 29: Europe CBRNE Detectors Revenue Share (%), by Application 2025 & 2033
- Figure 30: Europe CBRNE Detectors Volume Share (%), by Application 2025 & 2033
- Figure 31: Europe CBRNE Detectors Revenue (billion), by Types 2025 & 2033
- Figure 32: Europe CBRNE Detectors Volume (K), by Types 2025 & 2033
- Figure 33: Europe CBRNE Detectors Revenue Share (%), by Types 2025 & 2033
- Figure 34: Europe CBRNE Detectors Volume Share (%), by Types 2025 & 2033
- Figure 35: Europe CBRNE Detectors Revenue (billion), by Country 2025 & 2033
- Figure 36: Europe CBRNE Detectors Volume (K), by Country 2025 & 2033
- Figure 37: Europe CBRNE Detectors Revenue Share (%), by Country 2025 & 2033
- Figure 38: Europe CBRNE Detectors Volume Share (%), by Country 2025 & 2033
- Figure 39: Middle East & Africa CBRNE Detectors Revenue (billion), by Application 2025 & 2033
- Figure 40: Middle East & Africa CBRNE Detectors Volume (K), by Application 2025 & 2033
- Figure 41: Middle East & Africa CBRNE Detectors Revenue Share (%), by Application 2025 & 2033
- Figure 42: Middle East & Africa CBRNE Detectors Volume Share (%), by Application 2025 & 2033
- Figure 43: Middle East & Africa CBRNE Detectors Revenue (billion), by Types 2025 & 2033
- Figure 44: Middle East & Africa CBRNE Detectors Volume (K), by Types 2025 & 2033
- Figure 45: Middle East & Africa CBRNE Detectors Revenue Share (%), by Types 2025 & 2033
- Figure 46: Middle East & Africa CBRNE Detectors Volume Share (%), by Types 2025 & 2033
- Figure 47: Middle East & Africa CBRNE Detectors Revenue (billion), by Country 2025 & 2033
- Figure 48: Middle East & Africa CBRNE Detectors Volume (K), by Country 2025 & 2033
- Figure 49: Middle East & Africa CBRNE Detectors Revenue Share (%), by Country 2025 & 2033
- Figure 50: Middle East & Africa CBRNE Detectors Volume Share (%), by Country 2025 & 2033
- Figure 51: Asia Pacific CBRNE Detectors Revenue (billion), by Application 2025 & 2033
- Figure 52: Asia Pacific CBRNE Detectors Volume (K), by Application 2025 & 2033
- Figure 53: Asia Pacific CBRNE Detectors Revenue Share (%), by Application 2025 & 2033
- Figure 54: Asia Pacific CBRNE Detectors Volume Share (%), by Application 2025 & 2033
- Figure 55: Asia Pacific CBRNE Detectors Revenue (billion), by Types 2025 & 2033
- Figure 56: Asia Pacific CBRNE Detectors Volume (K), by Types 2025 & 2033
- Figure 57: Asia Pacific CBRNE Detectors Revenue Share (%), by Types 2025 & 2033
- Figure 58: Asia Pacific CBRNE Detectors Volume Share (%), by Types 2025 & 2033
- Figure 59: Asia Pacific CBRNE Detectors Revenue (billion), by Country 2025 & 2033
- Figure 60: Asia Pacific CBRNE Detectors Volume (K), by Country 2025 & 2033
- Figure 61: Asia Pacific CBRNE Detectors Revenue Share (%), by Country 2025 & 2033
- Figure 62: Asia Pacific CBRNE Detectors Volume Share (%), by Country 2025 & 2033
List of Tables
- Table 1: Global CBRNE Detectors Revenue billion Forecast, by Application 2020 & 2033
- Table 2: Global CBRNE Detectors Volume K Forecast, by Application 2020 & 2033
- Table 3: Global CBRNE Detectors Revenue billion Forecast, by Types 2020 & 2033
- Table 4: Global CBRNE Detectors Volume K Forecast, by Types 2020 & 2033
- Table 5: Global CBRNE Detectors Revenue billion Forecast, by Region 2020 & 2033
- Table 6: Global CBRNE Detectors Volume K Forecast, by Region 2020 & 2033
- Table 7: Global CBRNE Detectors Revenue billion Forecast, by Application 2020 & 2033
- Table 8: Global CBRNE Detectors Volume K Forecast, by Application 2020 & 2033
- Table 9: Global CBRNE Detectors Revenue billion Forecast, by Types 2020 & 2033
- Table 10: Global CBRNE Detectors Volume K Forecast, by Types 2020 & 2033
- Table 11: Global CBRNE Detectors Revenue billion Forecast, by Country 2020 & 2033
- Table 12: Global CBRNE Detectors Volume K Forecast, by Country 2020 & 2033
- Table 13: United States CBRNE Detectors Revenue (billion) Forecast, by Application 2020 & 2033
- Table 14: United States CBRNE Detectors Volume (K) Forecast, by Application 2020 & 2033
- Table 15: Canada CBRNE Detectors Revenue (billion) Forecast, by Application 2020 & 2033
- Table 16: Canada CBRNE Detectors Volume (K) Forecast, by Application 2020 & 2033
- Table 17: Mexico CBRNE Detectors Revenue (billion) Forecast, by Application 2020 & 2033
- Table 18: Mexico CBRNE Detectors Volume (K) Forecast, by Application 2020 & 2033
- Table 19: Global CBRNE Detectors Revenue billion Forecast, by Application 2020 & 2033
- Table 20: Global CBRNE Detectors Volume K Forecast, by Application 2020 & 2033
- Table 21: Global CBRNE Detectors Revenue billion Forecast, by Types 2020 & 2033
- Table 22: Global CBRNE Detectors Volume K Forecast, by Types 2020 & 2033
- Table 23: Global CBRNE Detectors Revenue billion Forecast, by Country 2020 & 2033
- Table 24: Global CBRNE Detectors Volume K Forecast, by Country 2020 & 2033
- Table 25: Brazil CBRNE Detectors Revenue (billion) Forecast, by Application 2020 & 2033
- Table 26: Brazil CBRNE Detectors Volume (K) Forecast, by Application 2020 & 2033
- Table 27: Argentina CBRNE Detectors Revenue (billion) Forecast, by Application 2020 & 2033
- Table 28: Argentina CBRNE Detectors Volume (K) Forecast, by Application 2020 & 2033
- Table 29: Rest of South America CBRNE Detectors Revenue (billion) Forecast, by Application 2020 & 2033
- Table 30: Rest of South America CBRNE Detectors Volume (K) Forecast, by Application 2020 & 2033
- Table 31: Global CBRNE Detectors Revenue billion Forecast, by Application 2020 & 2033
- Table 32: Global CBRNE Detectors Volume K Forecast, by Application 2020 & 2033
- Table 33: Global CBRNE Detectors Revenue billion Forecast, by Types 2020 & 2033
- Table 34: Global CBRNE Detectors Volume K Forecast, by Types 2020 & 2033
- Table 35: Global CBRNE Detectors Revenue billion Forecast, by Country 2020 & 2033
- Table 36: Global CBRNE Detectors Volume K Forecast, by Country 2020 & 2033
- Table 37: United Kingdom CBRNE Detectors Revenue (billion) Forecast, by Application 2020 & 2033
- Table 38: United Kingdom CBRNE Detectors Volume (K) Forecast, by Application 2020 & 2033
- Table 39: Germany CBRNE Detectors Revenue (billion) Forecast, by Application 2020 & 2033
- Table 40: Germany CBRNE Detectors Volume (K) Forecast, by Application 2020 & 2033
- Table 41: France CBRNE Detectors Revenue (billion) Forecast, by Application 2020 & 2033
- Table 42: France CBRNE Detectors Volume (K) Forecast, by Application 2020 & 2033
- Table 43: Italy CBRNE Detectors Revenue (billion) Forecast, by Application 2020 & 2033
- Table 44: Italy CBRNE Detectors Volume (K) Forecast, by Application 2020 & 2033
- Table 45: Spain CBRNE Detectors Revenue (billion) Forecast, by Application 2020 & 2033
- Table 46: Spain CBRNE Detectors Volume (K) Forecast, by Application 2020 & 2033
- Table 47: Russia CBRNE Detectors Revenue (billion) Forecast, by Application 2020 & 2033
- Table 48: Russia CBRNE Detectors Volume (K) Forecast, by Application 2020 & 2033
- Table 49: Benelux CBRNE Detectors Revenue (billion) Forecast, by Application 2020 & 2033
- Table 50: Benelux CBRNE Detectors Volume (K) Forecast, by Application 2020 & 2033
- Table 51: Nordics CBRNE Detectors Revenue (billion) Forecast, by Application 2020 & 2033
- Table 52: Nordics CBRNE Detectors Volume (K) Forecast, by Application 2020 & 2033
- Table 53: Rest of Europe CBRNE Detectors Revenue (billion) Forecast, by Application 2020 & 2033
- Table 54: Rest of Europe CBRNE Detectors Volume (K) Forecast, by Application 2020 & 2033
- Table 55: Global CBRNE Detectors Revenue billion Forecast, by Application 2020 & 2033
- Table 56: Global CBRNE Detectors Volume K Forecast, by Application 2020 & 2033
- Table 57: Global CBRNE Detectors Revenue billion Forecast, by Types 2020 & 2033
- Table 58: Global CBRNE Detectors Volume K Forecast, by Types 2020 & 2033
- Table 59: Global CBRNE Detectors Revenue billion Forecast, by Country 2020 & 2033
- Table 60: Global CBRNE Detectors Volume K Forecast, by Country 2020 & 2033
- Table 61: Turkey CBRNE Detectors Revenue (billion) Forecast, by Application 2020 & 2033
- Table 62: Turkey CBRNE Detectors Volume (K) Forecast, by Application 2020 & 2033
- Table 63: Israel CBRNE Detectors Revenue (billion) Forecast, by Application 2020 & 2033
- Table 64: Israel CBRNE Detectors Volume (K) Forecast, by Application 2020 & 2033
- Table 65: GCC CBRNE Detectors Revenue (billion) Forecast, by Application 2020 & 2033
- Table 66: GCC CBRNE Detectors Volume (K) Forecast, by Application 2020 & 2033
- Table 67: North Africa CBRNE Detectors Revenue (billion) Forecast, by Application 2020 & 2033
- Table 68: North Africa CBRNE Detectors Volume (K) Forecast, by Application 2020 & 2033
- Table 69: South Africa CBRNE Detectors Revenue (billion) Forecast, by Application 2020 & 2033
- Table 70: South Africa CBRNE Detectors Volume (K) Forecast, by Application 2020 & 2033
- Table 71: Rest of Middle East & Africa CBRNE Detectors Revenue (billion) Forecast, by Application 2020 & 2033
- Table 72: Rest of Middle East & Africa CBRNE Detectors Volume (K) Forecast, by Application 2020 & 2033
- Table 73: Global CBRNE Detectors Revenue billion Forecast, by Application 2020 & 2033
- Table 74: Global CBRNE Detectors Volume K Forecast, by Application 2020 & 2033
- Table 75: Global CBRNE Detectors Revenue billion Forecast, by Types 2020 & 2033
- Table 76: Global CBRNE Detectors Volume K Forecast, by Types 2020 & 2033
- Table 77: Global CBRNE Detectors Revenue billion Forecast, by Country 2020 & 2033
- Table 78: Global CBRNE Detectors Volume K Forecast, by Country 2020 & 2033
- Table 79: China CBRNE Detectors Revenue (billion) Forecast, by Application 2020 & 2033
- Table 80: China CBRNE Detectors Volume (K) Forecast, by Application 2020 & 2033
- Table 81: India CBRNE Detectors Revenue (billion) Forecast, by Application 2020 & 2033
- Table 82: India CBRNE Detectors Volume (K) Forecast, by Application 2020 & 2033
- Table 83: Japan CBRNE Detectors Revenue (billion) Forecast, by Application 2020 & 2033
- Table 84: Japan CBRNE Detectors Volume (K) Forecast, by Application 2020 & 2033
- Table 85: South Korea CBRNE Detectors Revenue (billion) Forecast, by Application 2020 & 2033
- Table 86: South Korea CBRNE Detectors Volume (K) Forecast, by Application 2020 & 2033
- Table 87: ASEAN CBRNE Detectors Revenue (billion) Forecast, by Application 2020 & 2033
- Table 88: ASEAN CBRNE Detectors Volume (K) Forecast, by Application 2020 & 2033
- Table 89: Oceania CBRNE Detectors Revenue (billion) Forecast, by Application 2020 & 2033
- Table 90: Oceania CBRNE Detectors Volume (K) Forecast, by Application 2020 & 2033
- Table 91: Rest of Asia Pacific CBRNE Detectors Revenue (billion) Forecast, by Application 2020 & 2033
- Table 92: Rest of Asia Pacific CBRNE Detectors Volume (K) Forecast, by Application 2020 & 2033
Frequently Asked Questions
1. What is the projected Compound Annual Growth Rate (CAGR) of the CBRNE Detectors?
The projected CAGR is approximately 5.9%.
2. Which companies are prominent players in the CBRNE Detectors?
Key companies in the market include Bruker, FLIR Systems, CNIM Group (Bertin Instruments), Detection Technologies Ltd., Kromek Group plc.
3. What are the main segments of the CBRNE Detectors?
The market segments include Application, Types.
4. Can you provide details about the market size?
The market size is estimated to be USD 20.22 billion as of 2022.
5. What are some drivers contributing to market growth?
N/A
6. What are the notable trends driving market growth?
N/A
7. Are there any restraints impacting market growth?
N/A
8. Can you provide examples of recent developments in the market?
N/A
9. What pricing options are available for accessing the report?
Pricing options include single-user, multi-user, and enterprise licenses priced at USD 3350.00, USD 5025.00, and USD 6700.00 respectively.
10. Is the market size provided in terms of value or volume?
The market size is provided in terms of value, measured in billion and volume, measured in K.
11. Are there any specific market keywords associated with the report?
Yes, the market keyword associated with the report is "CBRNE Detectors," which aids in identifying and referencing the specific market segment covered.
12. How do I determine which pricing option suits my needs best?
The pricing options vary based on user requirements and access needs. Individual users may opt for single-user licenses, while businesses requiring broader access may choose multi-user or enterprise licenses for cost-effective access to the report.
13. Are there any additional resources or data provided in the CBRNE Detectors report?
While the report offers comprehensive insights, it's advisable to review the specific contents or supplementary materials provided to ascertain if additional resources or data are available.
14. How can I stay updated on further developments or reports in the CBRNE Detectors?
To stay informed about further developments, trends, and reports in the CBRNE Detectors, consider subscribing to industry newsletters, following relevant companies and organizations, or regularly checking reputable industry news sources and publications.
Methodology
Step 1 - Identification of Relevant Samples Size from Population Database


Step 2 - Approaches for Defining Global Market Size (Value, Volume* & Price*)

Note*: In applicable scenarios
Step 3 - Data Sources
Primary Research
- Web Analytics
- Survey Reports
- Research Institute
- Latest Research Reports
- Opinion Leaders
Secondary Research
- Annual Reports
- White Paper
- Latest Press Release
- Industry Association
- Paid Database
- Investor Presentations

Step 4 - Data Triangulation
Involves using different sources of information in order to increase the validity of a study
These sources are likely to be stakeholders in a program - participants, other researchers, program staff, other community members, and so on.
Then we put all data in single framework & apply various statistical tools to find out the dynamic on the market.
During the analysis stage, feedback from the stakeholder groups would be compared to determine areas of agreement as well as areas of divergence