

Key Insights
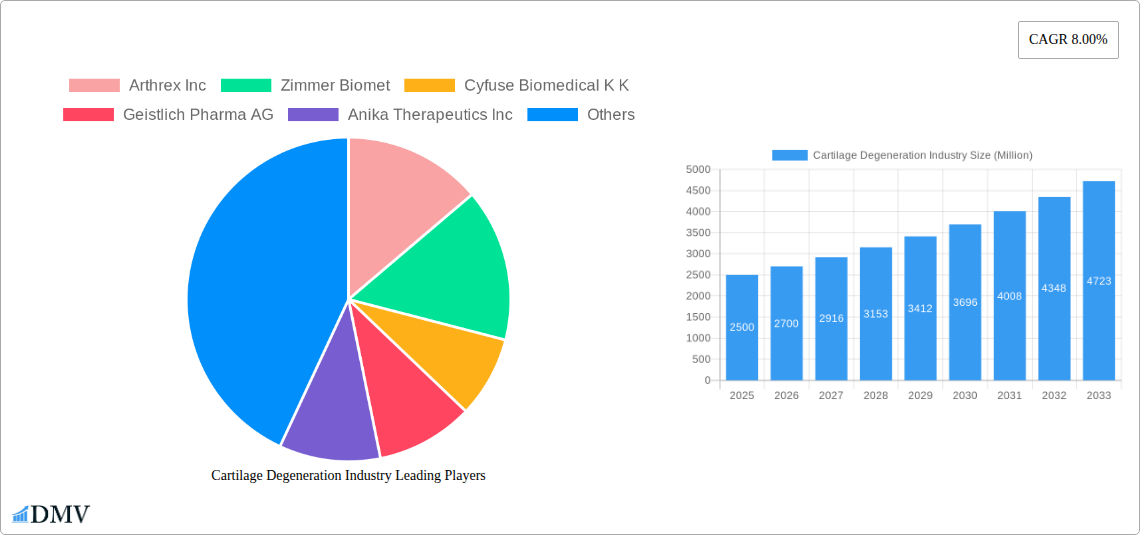
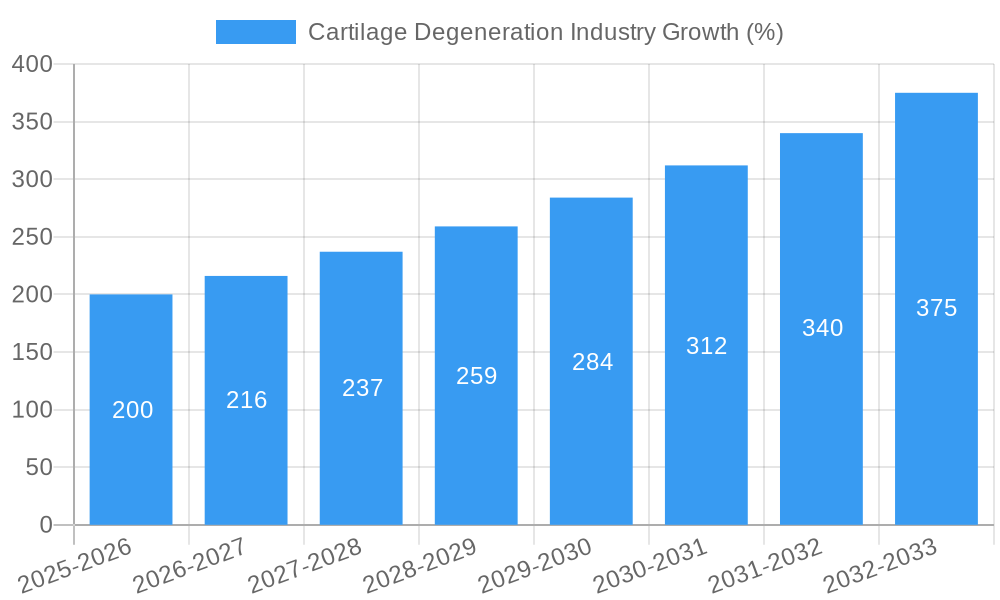
The global cartilage degeneration market, valued at approximately $2.5 billion in 2025, is projected to experience robust growth, exhibiting a compound annual growth rate (CAGR) of 8% from 2025 to 2033. This expansion is driven by several factors. The rising prevalence of osteoarthritis, a leading cause of cartilage degeneration, particularly among aging populations in developed nations, significantly fuels market demand. Technological advancements in cartilage repair techniques, including cell-based therapies and minimally invasive surgical procedures, offer improved treatment options and contribute to market growth. Furthermore, increasing awareness of cartilage degeneration and its debilitating effects, coupled with improved healthcare infrastructure and access in several regions, are bolstering market expansion. The market is segmented by cartilage type (fibrocartilage, hyaline cartilage, others), treatment modality (cell-based, non-cell-based), treatment type (palliative, intrinsic repair stimulus), and application site (knee, spine, ankle, hip, others). Each segment presents unique growth opportunities, with cell-based therapies and knee applications currently leading the market.
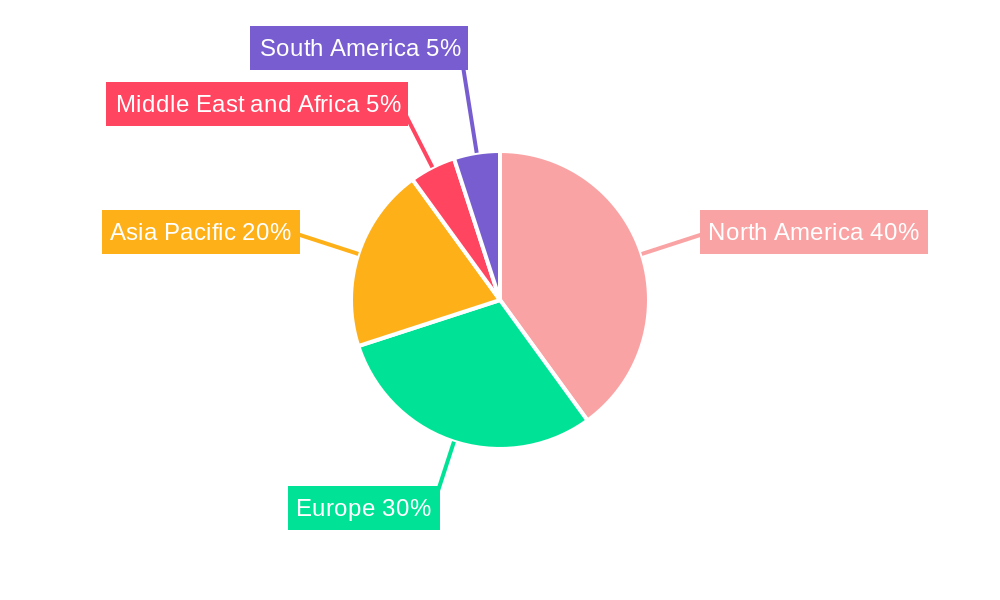
However, the market also faces certain restraints. High treatment costs associated with advanced therapies like cell-based regeneration limit accessibility for a significant portion of the global population. Furthermore, the lengthy recovery periods and potential complications associated with certain procedures can discourage some patients. Nevertheless, ongoing research and development efforts focused on improving treatment efficacy and reducing costs are expected to mitigate these limitations. The competitive landscape is characterized by a mix of established players like Arthrex Inc., Zimmer Biomet, and Johnson & Johnson, alongside emerging companies specializing in innovative therapies. Geographic growth is anticipated to be particularly strong in regions with large aging populations and increasing healthcare spending, such as North America and Europe, but also significant potential exists within the Asia-Pacific region driven by rising disposable incomes and increased healthcare awareness.
Cartilage Degeneration Industry Market Report: 2019-2033
This comprehensive report provides a detailed analysis of the Cartilage Degeneration industry, offering valuable insights for stakeholders seeking to understand market dynamics, growth opportunities, and competitive landscapes. The report covers the period from 2019 to 2033, with a focus on the 2025-2033 forecast period. The total market size is projected to reach xx Million by 2033.
Cartilage Degeneration Industry Market Composition & Trends
The Cartilage Degeneration market, valued at xx Million in 2025, exhibits a moderately concentrated structure with key players holding significant market share. Arthrex Inc., Zimmer Biomet, and Stryker Corporation are among the leading companies, collectively accounting for an estimated xx% market share in 2025. Innovation is driven by advancements in cell-based therapies, biomaterials, and minimally invasive surgical techniques. The regulatory landscape plays a crucial role, with agencies like the FDA and MHRA influencing product approvals and market entry. Substitute products, such as pain management medications and joint replacement surgeries, exert competitive pressure. End-users primarily comprise orthopedic surgeons, hospitals, and ambulatory surgical centers. M&A activity has been moderate, with deal values averaging approximately xx Million per transaction in the past five years. Key trends include a rising preference for minimally invasive procedures and growing adoption of cell-based therapies.
- Market Concentration: High, with top 3 players holding xx% market share in 2025.
- Innovation Catalysts: Advancements in cell-based therapies and biomaterials.
- Regulatory Landscape: Stringent approvals by FDA and MHRA.
- Substitute Products: Pain management medications, joint replacement.
- M&A Activity: Average deal value of xx Million in recent years.
Cartilage Degeneration Industry Industry Evolution
The Cartilage Degeneration industry has witnessed significant growth driven by increasing prevalence of osteoarthritis and other cartilage-related disorders. The market experienced a Compound Annual Growth Rate (CAGR) of xx% from 2019 to 2024, reaching xx Million in 2024. This growth trajectory is expected to continue, fueled by technological advancements, such as the development of more effective cartilage repair and regeneration therapies. The increasing adoption of minimally invasive surgical techniques is another key factor contributing to market expansion. Shifting consumer demands, focusing on improved outcomes and reduced recovery times, are further driving innovation and adoption of newer technologies. The market is projected to witness a CAGR of xx% between 2025 and 2033, with the market size estimated to reach xx Million by 2033. Specific growth rates vary across segments, with cell-based therapies showing the most significant potential. Adoption rates for new technologies are influenced by factors such as reimbursement policies and clinical trial outcomes.
Leading Regions, Countries, or Segments in Cartilage Degeneration Industry
North America currently holds the largest market share in the Cartilage Degeneration industry, driven by high prevalence of osteoarthritis, robust healthcare infrastructure, and increased investment in research and development. Within treatment modalities, the Cell-based segment is exhibiting faster growth compared to Non-Cell-based due to its potential for long-term cartilage regeneration. Similarly, Intrinsic Repair Stimulus treatment type is gaining traction due to its minimally invasive nature and potential for lower complication rates. Knee remains the largest application site, followed by Hip and Ankle.
- Key Drivers (North America): High osteoarthritis prevalence, advanced healthcare infrastructure, significant R&D investment.
- Key Drivers (Cell-based): Potential for long-term cartilage regeneration, improved outcomes.
- Key Drivers (Intrinsic Repair Stimulus): Minimally invasive nature, lower complication rates.
- Key Drivers (Knee Application Site): High prevalence of knee osteoarthritis, established treatment protocols.
Cartilage Degeneration Industry Product Innovations
Recent innovations have focused on improving the efficacy and safety of cartilage repair and regeneration therapies. This includes the development of novel biomaterials, cell delivery systems, and minimally invasive surgical techniques. Products incorporating advanced growth factors and tissue engineering strategies offer enhanced healing potential and reduced recovery times. Furthermore, the integration of imaging technologies helps improve surgical precision and patient outcomes. These advancements are not only improving treatment effectiveness but also addressing unmet medical needs, attracting significant investment and market expansion.
Propelling Factors for Cartilage Degeneration Industry Growth
Several factors are driving growth in the Cartilage Degeneration industry. Technological advancements, such as the development of improved biomaterials and cell-based therapies, are expanding treatment options and improving outcomes. The growing prevalence of osteoarthritis and other cartilage-related disorders is increasing the demand for effective treatments. Favorable regulatory environments, including expedited approvals for innovative therapies, are accelerating market entry for new products. Furthermore, increased healthcare spending and rising disposable incomes are making advanced treatments more accessible.
Obstacles in the Cartilage Degeneration Industry Market
Several factors pose challenges to the Cartilage Degeneration industry. Stringent regulatory pathways for new therapies can delay product launches and increase development costs. High treatment costs can limit accessibility for some patients. Supply chain disruptions can impact the availability of critical components for treatment. Intense competition among established players and emerging companies can pressure pricing and profit margins. These factors collectively influence market growth and adoption rates.
Future Opportunities in Cartilage Degeneration Industry
Future opportunities lie in the development of more effective and personalized cartilage repair and regeneration therapies. The expanding application of regenerative medicine holds significant promise. Exploring new markets, particularly in developing economies, offers substantial growth potential. Furthermore, technological advances, such as the use of artificial intelligence and big data analytics, can improve treatment outcomes and streamline patient care. These emerging trends suggest a bright future for the industry, presenting both challenges and opportunities.
Major Players in the Cartilage Degeneration Industry Ecosystem
- Arthrex Inc.
- Zimmer Biomet
- Cyfuse Biomedical K K
- Geistlich Pharma AG
- Anika Therapeutics Inc.
- Vericel Corporation
- Johnson & Johnson
- B Braun Melsungen AG
- Stryker Corporation
- Smith & Nephew plc
Key Developments in Cartilage Degeneration Industry Industry
- July 2022: Orthox received MHRA authorisation for a clinical trial of its FibroFix knee cartilage repair product platform.
- July 2021: Hyalex's cartilage system received breakthrough device status from the FDA.
Strategic Cartilage Degeneration Industry Market Forecast
The Cartilage Degeneration industry is poised for substantial growth over the next decade, driven by technological advancements, increasing prevalence of osteoarthritis, and rising healthcare expenditure. New treatment modalities, such as cell-based therapies and bioengineered scaffolds, will play a significant role in shaping market dynamics. Continued innovation and regulatory support will be crucial for unlocking the full market potential and improving patient outcomes. The market is expected to experience significant expansion, reaching xx Million by 2033, presenting substantial opportunities for companies operating in this dynamic space.
Cartilage Degeneration Industry Segmentation
-
1. Types of Cartilage
- 1.1. Fibrocartilage
- 1.2. Hyaline Cartilage
- 1.3. Others
-
2. Treatment Modality
- 2.1. Cell-based
- 2.2. Non-Cell-based
-
3. Treatment Type
- 3.1. Palliative
- 3.2. Intrinsic Repair Stimulus
-
4. Application Site
- 4.1. Knee
- 4.2. Spine
- 4.3. Ankle
- 4.4. Hip
- 4.5. Others
Cartilage Degeneration Industry Segmentation By Geography
-
1. North America
- 1.1. United States
- 1.2. Canada
- 1.3. Mexico
-
2. Europe
- 2.1. Germany
- 2.2. United Kingdom
- 2.3. France
- 2.4. Italy
- 2.5. Spain
- 2.6. Rest of Europe
-
3. Asia Pacific
- 3.1. China
- 3.2. Japan
- 3.3. India
- 3.4. Australia
- 3.5. South Korea
- 3.6. Rest of Asia Pacific
-
4. Middle East and Africa
- 4.1. GCC
- 4.2. South Africa
- 4.3. Rest of Middle East and Africa
-
5. South America
- 5.1. Brazil
- 5.2. Argentina
- 5.3. Rest of South America
Cartilage Degeneration Industry REPORT HIGHLIGHTS
| Aspects | Details |
|---|---|
| Study Period | 2019-2033 |
| Base Year | 2024 |
| Estimated Year | 2025 |
| Forecast Period | 2025-2033 |
| Historical Period | 2019-2024 |
| Growth Rate | CAGR of 8.00% from 2019-2033 |
| Segmentation |
|
Table of Contents
- 1. Introduction
- 1.1. Research Scope
- 1.2. Market Segmentation
- 1.3. Research Methodology
- 1.4. Definitions and Assumptions
- 2. Executive Summary
- 2.1. Introduction
- 3. Market Dynamics
- 3.1. Introduction
- 3.2. Market Drivers
- 3.2.1. Rising Prevalence of the Joints and Bones Disorders around the World and Increasing Geriatric Population; Technological Advancements in Cartilage Repair/Regeneration; Increasing Number of Injuries and Accidents
- 3.3. Market Restrains
- 3.3.1. High Costs of Cartilage Repair Procedures; Regulatory and Reimbursement Issues
- 3.4. Market Trends
- 3.4.1. Knee Application Segment is Expected to Hold a Major Share in the Cartilage Repair/Regeneration Market
- 4. Market Factor Analysis
- 4.1. Porters Five Forces
- 4.2. Supply/Value Chain
- 4.3. PESTEL analysis
- 4.4. Market Entropy
- 4.5. Patent/Trademark Analysis
- 5. Global Cartilage Degeneration Industry Analysis, Insights and Forecast, 2019-2031
- 5.1. Market Analysis, Insights and Forecast - by Types of Cartilage
- 5.1.1. Fibrocartilage
- 5.1.2. Hyaline Cartilage
- 5.1.3. Others
- 5.2. Market Analysis, Insights and Forecast - by Treatment Modality
- 5.2.1. Cell-based
- 5.2.2. Non-Cell-based
- 5.3. Market Analysis, Insights and Forecast - by Treatment Type
- 5.3.1. Palliative
- 5.3.2. Intrinsic Repair Stimulus
- 5.4. Market Analysis, Insights and Forecast - by Application Site
- 5.4.1. Knee
- 5.4.2. Spine
- 5.4.3. Ankle
- 5.4.4. Hip
- 5.4.5. Others
- 5.5. Market Analysis, Insights and Forecast - by Region
- 5.5.1. North America
- 5.5.2. Europe
- 5.5.3. Asia Pacific
- 5.5.4. Middle East and Africa
- 5.5.5. South America
- 5.1. Market Analysis, Insights and Forecast - by Types of Cartilage
- 6. North America Cartilage Degeneration Industry Analysis, Insights and Forecast, 2019-2031
- 6.1. Market Analysis, Insights and Forecast - by Types of Cartilage
- 6.1.1. Fibrocartilage
- 6.1.2. Hyaline Cartilage
- 6.1.3. Others
- 6.2. Market Analysis, Insights and Forecast - by Treatment Modality
- 6.2.1. Cell-based
- 6.2.2. Non-Cell-based
- 6.3. Market Analysis, Insights and Forecast - by Treatment Type
- 6.3.1. Palliative
- 6.3.2. Intrinsic Repair Stimulus
- 6.4. Market Analysis, Insights and Forecast - by Application Site
- 6.4.1. Knee
- 6.4.2. Spine
- 6.4.3. Ankle
- 6.4.4. Hip
- 6.4.5. Others
- 6.1. Market Analysis, Insights and Forecast - by Types of Cartilage
- 7. Europe Cartilage Degeneration Industry Analysis, Insights and Forecast, 2019-2031
- 7.1. Market Analysis, Insights and Forecast - by Types of Cartilage
- 7.1.1. Fibrocartilage
- 7.1.2. Hyaline Cartilage
- 7.1.3. Others
- 7.2. Market Analysis, Insights and Forecast - by Treatment Modality
- 7.2.1. Cell-based
- 7.2.2. Non-Cell-based
- 7.3. Market Analysis, Insights and Forecast - by Treatment Type
- 7.3.1. Palliative
- 7.3.2. Intrinsic Repair Stimulus
- 7.4. Market Analysis, Insights and Forecast - by Application Site
- 7.4.1. Knee
- 7.4.2. Spine
- 7.4.3. Ankle
- 7.4.4. Hip
- 7.4.5. Others
- 7.1. Market Analysis, Insights and Forecast - by Types of Cartilage
- 8. Asia Pacific Cartilage Degeneration Industry Analysis, Insights and Forecast, 2019-2031
- 8.1. Market Analysis, Insights and Forecast - by Types of Cartilage
- 8.1.1. Fibrocartilage
- 8.1.2. Hyaline Cartilage
- 8.1.3. Others
- 8.2. Market Analysis, Insights and Forecast - by Treatment Modality
- 8.2.1. Cell-based
- 8.2.2. Non-Cell-based
- 8.3. Market Analysis, Insights and Forecast - by Treatment Type
- 8.3.1. Palliative
- 8.3.2. Intrinsic Repair Stimulus
- 8.4. Market Analysis, Insights and Forecast - by Application Site
- 8.4.1. Knee
- 8.4.2. Spine
- 8.4.3. Ankle
- 8.4.4. Hip
- 8.4.5. Others
- 8.1. Market Analysis, Insights and Forecast - by Types of Cartilage
- 9. Middle East and Africa Cartilage Degeneration Industry Analysis, Insights and Forecast, 2019-2031
- 9.1. Market Analysis, Insights and Forecast - by Types of Cartilage
- 9.1.1. Fibrocartilage
- 9.1.2. Hyaline Cartilage
- 9.1.3. Others
- 9.2. Market Analysis, Insights and Forecast - by Treatment Modality
- 9.2.1. Cell-based
- 9.2.2. Non-Cell-based
- 9.3. Market Analysis, Insights and Forecast - by Treatment Type
- 9.3.1. Palliative
- 9.3.2. Intrinsic Repair Stimulus
- 9.4. Market Analysis, Insights and Forecast - by Application Site
- 9.4.1. Knee
- 9.4.2. Spine
- 9.4.3. Ankle
- 9.4.4. Hip
- 9.4.5. Others
- 9.1. Market Analysis, Insights and Forecast - by Types of Cartilage
- 10. South America Cartilage Degeneration Industry Analysis, Insights and Forecast, 2019-2031
- 10.1. Market Analysis, Insights and Forecast - by Types of Cartilage
- 10.1.1. Fibrocartilage
- 10.1.2. Hyaline Cartilage
- 10.1.3. Others
- 10.2. Market Analysis, Insights and Forecast - by Treatment Modality
- 10.2.1. Cell-based
- 10.2.2. Non-Cell-based
- 10.3. Market Analysis, Insights and Forecast - by Treatment Type
- 10.3.1. Palliative
- 10.3.2. Intrinsic Repair Stimulus
- 10.4. Market Analysis, Insights and Forecast - by Application Site
- 10.4.1. Knee
- 10.4.2. Spine
- 10.4.3. Ankle
- 10.4.4. Hip
- 10.4.5. Others
- 10.1. Market Analysis, Insights and Forecast - by Types of Cartilage
- 11. North America Cartilage Degeneration Industry Analysis, Insights and Forecast, 2019-2031
- 11.1. Market Analysis, Insights and Forecast - By Country/Sub-region
- 11.1.1. undefined
- 12. Europe Cartilage Degeneration Industry Analysis, Insights and Forecast, 2019-2031
- 12.1. Market Analysis, Insights and Forecast - By Country/Sub-region
- 12.1.1. undefined
- 13. Asia Pacific Cartilage Degeneration Industry Analysis, Insights and Forecast, 2019-2031
- 13.1. Market Analysis, Insights and Forecast - By Country/Sub-region
- 13.1.1. undefined
- 14. Middle East and Africa Cartilage Degeneration Industry Analysis, Insights and Forecast, 2019-2031
- 14.1. Market Analysis, Insights and Forecast - By Country/Sub-region
- 14.1.1. undefined
- 15. South America Cartilage Degeneration Industry Analysis, Insights and Forecast, 2019-2031
- 15.1. Market Analysis, Insights and Forecast - By Country/Sub-region
- 15.1.1. undefined
- 16. Competitive Analysis
- 16.1. Global Market Share Analysis 2024
- 16.2. Company Profiles
- 16.2.1 Arthrex Inc
- 16.2.1.1. Overview
- 16.2.1.2. Products
- 16.2.1.3. SWOT Analysis
- 16.2.1.4. Recent Developments
- 16.2.1.5. Financials (Based on Availability)
- 16.2.2 Zimmer Biomet
- 16.2.2.1. Overview
- 16.2.2.2. Products
- 16.2.2.3. SWOT Analysis
- 16.2.2.4. Recent Developments
- 16.2.2.5. Financials (Based on Availability)
- 16.2.3 Cyfuse Biomedical K K
- 16.2.3.1. Overview
- 16.2.3.2. Products
- 16.2.3.3. SWOT Analysis
- 16.2.3.4. Recent Developments
- 16.2.3.5. Financials (Based on Availability)
- 16.2.4 Geistlich Pharma AG
- 16.2.4.1. Overview
- 16.2.4.2. Products
- 16.2.4.3. SWOT Analysis
- 16.2.4.4. Recent Developments
- 16.2.4.5. Financials (Based on Availability)
- 16.2.5 Anika Therapeutics Inc
- 16.2.5.1. Overview
- 16.2.5.2. Products
- 16.2.5.3. SWOT Analysis
- 16.2.5.4. Recent Developments
- 16.2.5.5. Financials (Based on Availability)
- 16.2.6 Vericel Corporation
- 16.2.6.1. Overview
- 16.2.6.2. Products
- 16.2.6.3. SWOT Analysis
- 16.2.6.4. Recent Developments
- 16.2.6.5. Financials (Based on Availability)
- 16.2.7 Johnson & Johnson
- 16.2.7.1. Overview
- 16.2.7.2. Products
- 16.2.7.3. SWOT Analysis
- 16.2.7.4. Recent Developments
- 16.2.7.5. Financials (Based on Availability)
- 16.2.8 B Braun Melsungen AG
- 16.2.8.1. Overview
- 16.2.8.2. Products
- 16.2.8.3. SWOT Analysis
- 16.2.8.4. Recent Developments
- 16.2.8.5. Financials (Based on Availability)
- 16.2.9 Stryker Corporation
- 16.2.9.1. Overview
- 16.2.9.2. Products
- 16.2.9.3. SWOT Analysis
- 16.2.9.4. Recent Developments
- 16.2.9.5. Financials (Based on Availability)
- 16.2.10 Smith & Nephew plc
- 16.2.10.1. Overview
- 16.2.10.2. Products
- 16.2.10.3. SWOT Analysis
- 16.2.10.4. Recent Developments
- 16.2.10.5. Financials (Based on Availability)
- 16.2.1 Arthrex Inc
List of Figures
- Figure 1: Global Cartilage Degeneration Industry Revenue Breakdown (Million, %) by Region 2024 & 2032
- Figure 2: Global Cartilage Degeneration Industry Volume Breakdown (K Unit, %) by Region 2024 & 2032
- Figure 3: North America Cartilage Degeneration Industry Revenue (Million), by Country 2024 & 2032
- Figure 4: North America Cartilage Degeneration Industry Volume (K Unit), by Country 2024 & 2032
- Figure 5: North America Cartilage Degeneration Industry Revenue Share (%), by Country 2024 & 2032
- Figure 6: North America Cartilage Degeneration Industry Volume Share (%), by Country 2024 & 2032
- Figure 7: Europe Cartilage Degeneration Industry Revenue (Million), by Country 2024 & 2032
- Figure 8: Europe Cartilage Degeneration Industry Volume (K Unit), by Country 2024 & 2032
- Figure 9: Europe Cartilage Degeneration Industry Revenue Share (%), by Country 2024 & 2032
- Figure 10: Europe Cartilage Degeneration Industry Volume Share (%), by Country 2024 & 2032
- Figure 11: Asia Pacific Cartilage Degeneration Industry Revenue (Million), by Country 2024 & 2032
- Figure 12: Asia Pacific Cartilage Degeneration Industry Volume (K Unit), by Country 2024 & 2032
- Figure 13: Asia Pacific Cartilage Degeneration Industry Revenue Share (%), by Country 2024 & 2032
- Figure 14: Asia Pacific Cartilage Degeneration Industry Volume Share (%), by Country 2024 & 2032
- Figure 15: Middle East and Africa Cartilage Degeneration Industry Revenue (Million), by Country 2024 & 2032
- Figure 16: Middle East and Africa Cartilage Degeneration Industry Volume (K Unit), by Country 2024 & 2032
- Figure 17: Middle East and Africa Cartilage Degeneration Industry Revenue Share (%), by Country 2024 & 2032
- Figure 18: Middle East and Africa Cartilage Degeneration Industry Volume Share (%), by Country 2024 & 2032
- Figure 19: South America Cartilage Degeneration Industry Revenue (Million), by Country 2024 & 2032
- Figure 20: South America Cartilage Degeneration Industry Volume (K Unit), by Country 2024 & 2032
- Figure 21: South America Cartilage Degeneration Industry Revenue Share (%), by Country 2024 & 2032
- Figure 22: South America Cartilage Degeneration Industry Volume Share (%), by Country 2024 & 2032
- Figure 23: North America Cartilage Degeneration Industry Revenue (Million), by Types of Cartilage 2024 & 2032
- Figure 24: North America Cartilage Degeneration Industry Volume (K Unit), by Types of Cartilage 2024 & 2032
- Figure 25: North America Cartilage Degeneration Industry Revenue Share (%), by Types of Cartilage 2024 & 2032
- Figure 26: North America Cartilage Degeneration Industry Volume Share (%), by Types of Cartilage 2024 & 2032
- Figure 27: North America Cartilage Degeneration Industry Revenue (Million), by Treatment Modality 2024 & 2032
- Figure 28: North America Cartilage Degeneration Industry Volume (K Unit), by Treatment Modality 2024 & 2032
- Figure 29: North America Cartilage Degeneration Industry Revenue Share (%), by Treatment Modality 2024 & 2032
- Figure 30: North America Cartilage Degeneration Industry Volume Share (%), by Treatment Modality 2024 & 2032
- Figure 31: North America Cartilage Degeneration Industry Revenue (Million), by Treatment Type 2024 & 2032
- Figure 32: North America Cartilage Degeneration Industry Volume (K Unit), by Treatment Type 2024 & 2032
- Figure 33: North America Cartilage Degeneration Industry Revenue Share (%), by Treatment Type 2024 & 2032
- Figure 34: North America Cartilage Degeneration Industry Volume Share (%), by Treatment Type 2024 & 2032
- Figure 35: North America Cartilage Degeneration Industry Revenue (Million), by Application Site 2024 & 2032
- Figure 36: North America Cartilage Degeneration Industry Volume (K Unit), by Application Site 2024 & 2032
- Figure 37: North America Cartilage Degeneration Industry Revenue Share (%), by Application Site 2024 & 2032
- Figure 38: North America Cartilage Degeneration Industry Volume Share (%), by Application Site 2024 & 2032
- Figure 39: North America Cartilage Degeneration Industry Revenue (Million), by Country 2024 & 2032
- Figure 40: North America Cartilage Degeneration Industry Volume (K Unit), by Country 2024 & 2032
- Figure 41: North America Cartilage Degeneration Industry Revenue Share (%), by Country 2024 & 2032
- Figure 42: North America Cartilage Degeneration Industry Volume Share (%), by Country 2024 & 2032
- Figure 43: Europe Cartilage Degeneration Industry Revenue (Million), by Types of Cartilage 2024 & 2032
- Figure 44: Europe Cartilage Degeneration Industry Volume (K Unit), by Types of Cartilage 2024 & 2032
- Figure 45: Europe Cartilage Degeneration Industry Revenue Share (%), by Types of Cartilage 2024 & 2032
- Figure 46: Europe Cartilage Degeneration Industry Volume Share (%), by Types of Cartilage 2024 & 2032
- Figure 47: Europe Cartilage Degeneration Industry Revenue (Million), by Treatment Modality 2024 & 2032
- Figure 48: Europe Cartilage Degeneration Industry Volume (K Unit), by Treatment Modality 2024 & 2032
- Figure 49: Europe Cartilage Degeneration Industry Revenue Share (%), by Treatment Modality 2024 & 2032
- Figure 50: Europe Cartilage Degeneration Industry Volume Share (%), by Treatment Modality 2024 & 2032
- Figure 51: Europe Cartilage Degeneration Industry Revenue (Million), by Treatment Type 2024 & 2032
- Figure 52: Europe Cartilage Degeneration Industry Volume (K Unit), by Treatment Type 2024 & 2032
- Figure 53: Europe Cartilage Degeneration Industry Revenue Share (%), by Treatment Type 2024 & 2032
- Figure 54: Europe Cartilage Degeneration Industry Volume Share (%), by Treatment Type 2024 & 2032
- Figure 55: Europe Cartilage Degeneration Industry Revenue (Million), by Application Site 2024 & 2032
- Figure 56: Europe Cartilage Degeneration Industry Volume (K Unit), by Application Site 2024 & 2032
- Figure 57: Europe Cartilage Degeneration Industry Revenue Share (%), by Application Site 2024 & 2032
- Figure 58: Europe Cartilage Degeneration Industry Volume Share (%), by Application Site 2024 & 2032
- Figure 59: Europe Cartilage Degeneration Industry Revenue (Million), by Country 2024 & 2032
- Figure 60: Europe Cartilage Degeneration Industry Volume (K Unit), by Country 2024 & 2032
- Figure 61: Europe Cartilage Degeneration Industry Revenue Share (%), by Country 2024 & 2032
- Figure 62: Europe Cartilage Degeneration Industry Volume Share (%), by Country 2024 & 2032
- Figure 63: Asia Pacific Cartilage Degeneration Industry Revenue (Million), by Types of Cartilage 2024 & 2032
- Figure 64: Asia Pacific Cartilage Degeneration Industry Volume (K Unit), by Types of Cartilage 2024 & 2032
- Figure 65: Asia Pacific Cartilage Degeneration Industry Revenue Share (%), by Types of Cartilage 2024 & 2032
- Figure 66: Asia Pacific Cartilage Degeneration Industry Volume Share (%), by Types of Cartilage 2024 & 2032
- Figure 67: Asia Pacific Cartilage Degeneration Industry Revenue (Million), by Treatment Modality 2024 & 2032
- Figure 68: Asia Pacific Cartilage Degeneration Industry Volume (K Unit), by Treatment Modality 2024 & 2032
- Figure 69: Asia Pacific Cartilage Degeneration Industry Revenue Share (%), by Treatment Modality 2024 & 2032
- Figure 70: Asia Pacific Cartilage Degeneration Industry Volume Share (%), by Treatment Modality 2024 & 2032
- Figure 71: Asia Pacific Cartilage Degeneration Industry Revenue (Million), by Treatment Type 2024 & 2032
- Figure 72: Asia Pacific Cartilage Degeneration Industry Volume (K Unit), by Treatment Type 2024 & 2032
- Figure 73: Asia Pacific Cartilage Degeneration Industry Revenue Share (%), by Treatment Type 2024 & 2032
- Figure 74: Asia Pacific Cartilage Degeneration Industry Volume Share (%), by Treatment Type 2024 & 2032
- Figure 75: Asia Pacific Cartilage Degeneration Industry Revenue (Million), by Application Site 2024 & 2032
- Figure 76: Asia Pacific Cartilage Degeneration Industry Volume (K Unit), by Application Site 2024 & 2032
- Figure 77: Asia Pacific Cartilage Degeneration Industry Revenue Share (%), by Application Site 2024 & 2032
- Figure 78: Asia Pacific Cartilage Degeneration Industry Volume Share (%), by Application Site 2024 & 2032
- Figure 79: Asia Pacific Cartilage Degeneration Industry Revenue (Million), by Country 2024 & 2032
- Figure 80: Asia Pacific Cartilage Degeneration Industry Volume (K Unit), by Country 2024 & 2032
- Figure 81: Asia Pacific Cartilage Degeneration Industry Revenue Share (%), by Country 2024 & 2032
- Figure 82: Asia Pacific Cartilage Degeneration Industry Volume Share (%), by Country 2024 & 2032
- Figure 83: Middle East and Africa Cartilage Degeneration Industry Revenue (Million), by Types of Cartilage 2024 & 2032
- Figure 84: Middle East and Africa Cartilage Degeneration Industry Volume (K Unit), by Types of Cartilage 2024 & 2032
- Figure 85: Middle East and Africa Cartilage Degeneration Industry Revenue Share (%), by Types of Cartilage 2024 & 2032
- Figure 86: Middle East and Africa Cartilage Degeneration Industry Volume Share (%), by Types of Cartilage 2024 & 2032
- Figure 87: Middle East and Africa Cartilage Degeneration Industry Revenue (Million), by Treatment Modality 2024 & 2032
- Figure 88: Middle East and Africa Cartilage Degeneration Industry Volume (K Unit), by Treatment Modality 2024 & 2032
- Figure 89: Middle East and Africa Cartilage Degeneration Industry Revenue Share (%), by Treatment Modality 2024 & 2032
- Figure 90: Middle East and Africa Cartilage Degeneration Industry Volume Share (%), by Treatment Modality 2024 & 2032
- Figure 91: Middle East and Africa Cartilage Degeneration Industry Revenue (Million), by Treatment Type 2024 & 2032
- Figure 92: Middle East and Africa Cartilage Degeneration Industry Volume (K Unit), by Treatment Type 2024 & 2032
- Figure 93: Middle East and Africa Cartilage Degeneration Industry Revenue Share (%), by Treatment Type 2024 & 2032
- Figure 94: Middle East and Africa Cartilage Degeneration Industry Volume Share (%), by Treatment Type 2024 & 2032
- Figure 95: Middle East and Africa Cartilage Degeneration Industry Revenue (Million), by Application Site 2024 & 2032
- Figure 96: Middle East and Africa Cartilage Degeneration Industry Volume (K Unit), by Application Site 2024 & 2032
- Figure 97: Middle East and Africa Cartilage Degeneration Industry Revenue Share (%), by Application Site 2024 & 2032
- Figure 98: Middle East and Africa Cartilage Degeneration Industry Volume Share (%), by Application Site 2024 & 2032
- Figure 99: Middle East and Africa Cartilage Degeneration Industry Revenue (Million), by Country 2024 & 2032
- Figure 100: Middle East and Africa Cartilage Degeneration Industry Volume (K Unit), by Country 2024 & 2032
- Figure 101: Middle East and Africa Cartilage Degeneration Industry Revenue Share (%), by Country 2024 & 2032
- Figure 102: Middle East and Africa Cartilage Degeneration Industry Volume Share (%), by Country 2024 & 2032
- Figure 103: South America Cartilage Degeneration Industry Revenue (Million), by Types of Cartilage 2024 & 2032
- Figure 104: South America Cartilage Degeneration Industry Volume (K Unit), by Types of Cartilage 2024 & 2032
- Figure 105: South America Cartilage Degeneration Industry Revenue Share (%), by Types of Cartilage 2024 & 2032
- Figure 106: South America Cartilage Degeneration Industry Volume Share (%), by Types of Cartilage 2024 & 2032
- Figure 107: South America Cartilage Degeneration Industry Revenue (Million), by Treatment Modality 2024 & 2032
- Figure 108: South America Cartilage Degeneration Industry Volume (K Unit), by Treatment Modality 2024 & 2032
- Figure 109: South America Cartilage Degeneration Industry Revenue Share (%), by Treatment Modality 2024 & 2032
- Figure 110: South America Cartilage Degeneration Industry Volume Share (%), by Treatment Modality 2024 & 2032
- Figure 111: South America Cartilage Degeneration Industry Revenue (Million), by Treatment Type 2024 & 2032
- Figure 112: South America Cartilage Degeneration Industry Volume (K Unit), by Treatment Type 2024 & 2032
- Figure 113: South America Cartilage Degeneration Industry Revenue Share (%), by Treatment Type 2024 & 2032
- Figure 114: South America Cartilage Degeneration Industry Volume Share (%), by Treatment Type 2024 & 2032
- Figure 115: South America Cartilage Degeneration Industry Revenue (Million), by Application Site 2024 & 2032
- Figure 116: South America Cartilage Degeneration Industry Volume (K Unit), by Application Site 2024 & 2032
- Figure 117: South America Cartilage Degeneration Industry Revenue Share (%), by Application Site 2024 & 2032
- Figure 118: South America Cartilage Degeneration Industry Volume Share (%), by Application Site 2024 & 2032
- Figure 119: South America Cartilage Degeneration Industry Revenue (Million), by Country 2024 & 2032
- Figure 120: South America Cartilage Degeneration Industry Volume (K Unit), by Country 2024 & 2032
- Figure 121: South America Cartilage Degeneration Industry Revenue Share (%), by Country 2024 & 2032
- Figure 122: South America Cartilage Degeneration Industry Volume Share (%), by Country 2024 & 2032
List of Tables
- Table 1: Global Cartilage Degeneration Industry Revenue Million Forecast, by Region 2019 & 2032
- Table 2: Global Cartilage Degeneration Industry Volume K Unit Forecast, by Region 2019 & 2032
- Table 3: Global Cartilage Degeneration Industry Revenue Million Forecast, by Types of Cartilage 2019 & 2032
- Table 4: Global Cartilage Degeneration Industry Volume K Unit Forecast, by Types of Cartilage 2019 & 2032
- Table 5: Global Cartilage Degeneration Industry Revenue Million Forecast, by Treatment Modality 2019 & 2032
- Table 6: Global Cartilage Degeneration Industry Volume K Unit Forecast, by Treatment Modality 2019 & 2032
- Table 7: Global Cartilage Degeneration Industry Revenue Million Forecast, by Treatment Type 2019 & 2032
- Table 8: Global Cartilage Degeneration Industry Volume K Unit Forecast, by Treatment Type 2019 & 2032
- Table 9: Global Cartilage Degeneration Industry Revenue Million Forecast, by Application Site 2019 & 2032
- Table 10: Global Cartilage Degeneration Industry Volume K Unit Forecast, by Application Site 2019 & 2032
- Table 11: Global Cartilage Degeneration Industry Revenue Million Forecast, by Region 2019 & 2032
- Table 12: Global Cartilage Degeneration Industry Volume K Unit Forecast, by Region 2019 & 2032
- Table 13: Global Cartilage Degeneration Industry Revenue Million Forecast, by Country 2019 & 2032
- Table 14: Global Cartilage Degeneration Industry Volume K Unit Forecast, by Country 2019 & 2032
- Table 15: Global Cartilage Degeneration Industry Revenue Million Forecast, by Country 2019 & 2032
- Table 16: Global Cartilage Degeneration Industry Volume K Unit Forecast, by Country 2019 & 2032
- Table 17: Global Cartilage Degeneration Industry Revenue Million Forecast, by Country 2019 & 2032
- Table 18: Global Cartilage Degeneration Industry Volume K Unit Forecast, by Country 2019 & 2032
- Table 19: Global Cartilage Degeneration Industry Revenue Million Forecast, by Country 2019 & 2032
- Table 20: Global Cartilage Degeneration Industry Volume K Unit Forecast, by Country 2019 & 2032
- Table 21: Global Cartilage Degeneration Industry Revenue Million Forecast, by Country 2019 & 2032
- Table 22: Global Cartilage Degeneration Industry Volume K Unit Forecast, by Country 2019 & 2032
- Table 23: Global Cartilage Degeneration Industry Revenue Million Forecast, by Types of Cartilage 2019 & 2032
- Table 24: Global Cartilage Degeneration Industry Volume K Unit Forecast, by Types of Cartilage 2019 & 2032
- Table 25: Global Cartilage Degeneration Industry Revenue Million Forecast, by Treatment Modality 2019 & 2032
- Table 26: Global Cartilage Degeneration Industry Volume K Unit Forecast, by Treatment Modality 2019 & 2032
- Table 27: Global Cartilage Degeneration Industry Revenue Million Forecast, by Treatment Type 2019 & 2032
- Table 28: Global Cartilage Degeneration Industry Volume K Unit Forecast, by Treatment Type 2019 & 2032
- Table 29: Global Cartilage Degeneration Industry Revenue Million Forecast, by Application Site 2019 & 2032
- Table 30: Global Cartilage Degeneration Industry Volume K Unit Forecast, by Application Site 2019 & 2032
- Table 31: Global Cartilage Degeneration Industry Revenue Million Forecast, by Country 2019 & 2032
- Table 32: Global Cartilage Degeneration Industry Volume K Unit Forecast, by Country 2019 & 2032
- Table 33: United States Cartilage Degeneration Industry Revenue (Million) Forecast, by Application 2019 & 2032
- Table 34: United States Cartilage Degeneration Industry Volume (K Unit) Forecast, by Application 2019 & 2032
- Table 35: Canada Cartilage Degeneration Industry Revenue (Million) Forecast, by Application 2019 & 2032
- Table 36: Canada Cartilage Degeneration Industry Volume (K Unit) Forecast, by Application 2019 & 2032
- Table 37: Mexico Cartilage Degeneration Industry Revenue (Million) Forecast, by Application 2019 & 2032
- Table 38: Mexico Cartilage Degeneration Industry Volume (K Unit) Forecast, by Application 2019 & 2032
- Table 39: Global Cartilage Degeneration Industry Revenue Million Forecast, by Types of Cartilage 2019 & 2032
- Table 40: Global Cartilage Degeneration Industry Volume K Unit Forecast, by Types of Cartilage 2019 & 2032
- Table 41: Global Cartilage Degeneration Industry Revenue Million Forecast, by Treatment Modality 2019 & 2032
- Table 42: Global Cartilage Degeneration Industry Volume K Unit Forecast, by Treatment Modality 2019 & 2032
- Table 43: Global Cartilage Degeneration Industry Revenue Million Forecast, by Treatment Type 2019 & 2032
- Table 44: Global Cartilage Degeneration Industry Volume K Unit Forecast, by Treatment Type 2019 & 2032
- Table 45: Global Cartilage Degeneration Industry Revenue Million Forecast, by Application Site 2019 & 2032
- Table 46: Global Cartilage Degeneration Industry Volume K Unit Forecast, by Application Site 2019 & 2032
- Table 47: Global Cartilage Degeneration Industry Revenue Million Forecast, by Country 2019 & 2032
- Table 48: Global Cartilage Degeneration Industry Volume K Unit Forecast, by Country 2019 & 2032
- Table 49: Germany Cartilage Degeneration Industry Revenue (Million) Forecast, by Application 2019 & 2032
- Table 50: Germany Cartilage Degeneration Industry Volume (K Unit) Forecast, by Application 2019 & 2032
- Table 51: United Kingdom Cartilage Degeneration Industry Revenue (Million) Forecast, by Application 2019 & 2032
- Table 52: United Kingdom Cartilage Degeneration Industry Volume (K Unit) Forecast, by Application 2019 & 2032
- Table 53: France Cartilage Degeneration Industry Revenue (Million) Forecast, by Application 2019 & 2032
- Table 54: France Cartilage Degeneration Industry Volume (K Unit) Forecast, by Application 2019 & 2032
- Table 55: Italy Cartilage Degeneration Industry Revenue (Million) Forecast, by Application 2019 & 2032
- Table 56: Italy Cartilage Degeneration Industry Volume (K Unit) Forecast, by Application 2019 & 2032
- Table 57: Spain Cartilage Degeneration Industry Revenue (Million) Forecast, by Application 2019 & 2032
- Table 58: Spain Cartilage Degeneration Industry Volume (K Unit) Forecast, by Application 2019 & 2032
- Table 59: Rest of Europe Cartilage Degeneration Industry Revenue (Million) Forecast, by Application 2019 & 2032
- Table 60: Rest of Europe Cartilage Degeneration Industry Volume (K Unit) Forecast, by Application 2019 & 2032
- Table 61: Global Cartilage Degeneration Industry Revenue Million Forecast, by Types of Cartilage 2019 & 2032
- Table 62: Global Cartilage Degeneration Industry Volume K Unit Forecast, by Types of Cartilage 2019 & 2032
- Table 63: Global Cartilage Degeneration Industry Revenue Million Forecast, by Treatment Modality 2019 & 2032
- Table 64: Global Cartilage Degeneration Industry Volume K Unit Forecast, by Treatment Modality 2019 & 2032
- Table 65: Global Cartilage Degeneration Industry Revenue Million Forecast, by Treatment Type 2019 & 2032
- Table 66: Global Cartilage Degeneration Industry Volume K Unit Forecast, by Treatment Type 2019 & 2032
- Table 67: Global Cartilage Degeneration Industry Revenue Million Forecast, by Application Site 2019 & 2032
- Table 68: Global Cartilage Degeneration Industry Volume K Unit Forecast, by Application Site 2019 & 2032
- Table 69: Global Cartilage Degeneration Industry Revenue Million Forecast, by Country 2019 & 2032
- Table 70: Global Cartilage Degeneration Industry Volume K Unit Forecast, by Country 2019 & 2032
- Table 71: China Cartilage Degeneration Industry Revenue (Million) Forecast, by Application 2019 & 2032
- Table 72: China Cartilage Degeneration Industry Volume (K Unit) Forecast, by Application 2019 & 2032
- Table 73: Japan Cartilage Degeneration Industry Revenue (Million) Forecast, by Application 2019 & 2032
- Table 74: Japan Cartilage Degeneration Industry Volume (K Unit) Forecast, by Application 2019 & 2032
- Table 75: India Cartilage Degeneration Industry Revenue (Million) Forecast, by Application 2019 & 2032
- Table 76: India Cartilage Degeneration Industry Volume (K Unit) Forecast, by Application 2019 & 2032
- Table 77: Australia Cartilage Degeneration Industry Revenue (Million) Forecast, by Application 2019 & 2032
- Table 78: Australia Cartilage Degeneration Industry Volume (K Unit) Forecast, by Application 2019 & 2032
- Table 79: South Korea Cartilage Degeneration Industry Revenue (Million) Forecast, by Application 2019 & 2032
- Table 80: South Korea Cartilage Degeneration Industry Volume (K Unit) Forecast, by Application 2019 & 2032
- Table 81: Rest of Asia Pacific Cartilage Degeneration Industry Revenue (Million) Forecast, by Application 2019 & 2032
- Table 82: Rest of Asia Pacific Cartilage Degeneration Industry Volume (K Unit) Forecast, by Application 2019 & 2032
- Table 83: Global Cartilage Degeneration Industry Revenue Million Forecast, by Types of Cartilage 2019 & 2032
- Table 84: Global Cartilage Degeneration Industry Volume K Unit Forecast, by Types of Cartilage 2019 & 2032
- Table 85: Global Cartilage Degeneration Industry Revenue Million Forecast, by Treatment Modality 2019 & 2032
- Table 86: Global Cartilage Degeneration Industry Volume K Unit Forecast, by Treatment Modality 2019 & 2032
- Table 87: Global Cartilage Degeneration Industry Revenue Million Forecast, by Treatment Type 2019 & 2032
- Table 88: Global Cartilage Degeneration Industry Volume K Unit Forecast, by Treatment Type 2019 & 2032
- Table 89: Global Cartilage Degeneration Industry Revenue Million Forecast, by Application Site 2019 & 2032
- Table 90: Global Cartilage Degeneration Industry Volume K Unit Forecast, by Application Site 2019 & 2032
- Table 91: Global Cartilage Degeneration Industry Revenue Million Forecast, by Country 2019 & 2032
- Table 92: Global Cartilage Degeneration Industry Volume K Unit Forecast, by Country 2019 & 2032
- Table 93: GCC Cartilage Degeneration Industry Revenue (Million) Forecast, by Application 2019 & 2032
- Table 94: GCC Cartilage Degeneration Industry Volume (K Unit) Forecast, by Application 2019 & 2032
- Table 95: South Africa Cartilage Degeneration Industry Revenue (Million) Forecast, by Application 2019 & 2032
- Table 96: South Africa Cartilage Degeneration Industry Volume (K Unit) Forecast, by Application 2019 & 2032
- Table 97: Rest of Middle East and Africa Cartilage Degeneration Industry Revenue (Million) Forecast, by Application 2019 & 2032
- Table 98: Rest of Middle East and Africa Cartilage Degeneration Industry Volume (K Unit) Forecast, by Application 2019 & 2032
- Table 99: Global Cartilage Degeneration Industry Revenue Million Forecast, by Types of Cartilage 2019 & 2032
- Table 100: Global Cartilage Degeneration Industry Volume K Unit Forecast, by Types of Cartilage 2019 & 2032
- Table 101: Global Cartilage Degeneration Industry Revenue Million Forecast, by Treatment Modality 2019 & 2032
- Table 102: Global Cartilage Degeneration Industry Volume K Unit Forecast, by Treatment Modality 2019 & 2032
- Table 103: Global Cartilage Degeneration Industry Revenue Million Forecast, by Treatment Type 2019 & 2032
- Table 104: Global Cartilage Degeneration Industry Volume K Unit Forecast, by Treatment Type 2019 & 2032
- Table 105: Global Cartilage Degeneration Industry Revenue Million Forecast, by Application Site 2019 & 2032
- Table 106: Global Cartilage Degeneration Industry Volume K Unit Forecast, by Application Site 2019 & 2032
- Table 107: Global Cartilage Degeneration Industry Revenue Million Forecast, by Country 2019 & 2032
- Table 108: Global Cartilage Degeneration Industry Volume K Unit Forecast, by Country 2019 & 2032
- Table 109: Brazil Cartilage Degeneration Industry Revenue (Million) Forecast, by Application 2019 & 2032
- Table 110: Brazil Cartilage Degeneration Industry Volume (K Unit) Forecast, by Application 2019 & 2032
- Table 111: Argentina Cartilage Degeneration Industry Revenue (Million) Forecast, by Application 2019 & 2032
- Table 112: Argentina Cartilage Degeneration Industry Volume (K Unit) Forecast, by Application 2019 & 2032
- Table 113: Rest of South America Cartilage Degeneration Industry Revenue (Million) Forecast, by Application 2019 & 2032
- Table 114: Rest of South America Cartilage Degeneration Industry Volume (K Unit) Forecast, by Application 2019 & 2032
Frequently Asked Questions
1. What is the projected Compound Annual Growth Rate (CAGR) of the Cartilage Degeneration Industry?
The projected CAGR is approximately 8.00%.
2. Which companies are prominent players in the Cartilage Degeneration Industry?
Key companies in the market include Arthrex Inc, Zimmer Biomet, Cyfuse Biomedical K K, Geistlich Pharma AG, Anika Therapeutics Inc, Vericel Corporation, Johnson & Johnson, B Braun Melsungen AG, Stryker Corporation, Smith & Nephew plc.
3. What are the main segments of the Cartilage Degeneration Industry?
The market segments include Types of Cartilage, Treatment Modality, Treatment Type, Application Site.
4. Can you provide details about the market size?
The market size is estimated to be USD XX Million as of 2022.
5. What are some drivers contributing to market growth?
Rising Prevalence of the Joints and Bones Disorders around the World and Increasing Geriatric Population; Technological Advancements in Cartilage Repair/Regeneration; Increasing Number of Injuries and Accidents.
6. What are the notable trends driving market growth?
Knee Application Segment is Expected to Hold a Major Share in the Cartilage Repair/Regeneration Market.
7. Are there any restraints impacting market growth?
High Costs of Cartilage Repair Procedures; Regulatory and Reimbursement Issues.
8. Can you provide examples of recent developments in the market?
In July 2022, Orthox received Medicines and Healthcare products Regulatory Agency (MHRA) authorisation for a clinical trial of knee cartilage repair FibroFix product platform.
9. What pricing options are available for accessing the report?
Pricing options include single-user, multi-user, and enterprise licenses priced at USD 4750, USD 5250, and USD 8750 respectively.
10. Is the market size provided in terms of value or volume?
The market size is provided in terms of value, measured in Million and volume, measured in K Unit.
11. Are there any specific market keywords associated with the report?
Yes, the market keyword associated with the report is "Cartilage Degeneration Industry," which aids in identifying and referencing the specific market segment covered.
12. How do I determine which pricing option suits my needs best?
The pricing options vary based on user requirements and access needs. Individual users may opt for single-user licenses, while businesses requiring broader access may choose multi-user or enterprise licenses for cost-effective access to the report.
13. Are there any additional resources or data provided in the Cartilage Degeneration Industry report?
While the report offers comprehensive insights, it's advisable to review the specific contents or supplementary materials provided to ascertain if additional resources or data are available.
14. How can I stay updated on further developments or reports in the Cartilage Degeneration Industry?
To stay informed about further developments, trends, and reports in the Cartilage Degeneration Industry, consider subscribing to industry newsletters, following relevant companies and organizations, or regularly checking reputable industry news sources and publications.
Methodology
Step 1 - Identification of Relevant Samples Size from Population Database


Step 2 - Approaches for Defining Global Market Size (Value, Volume* & Price*)

Note*: In applicable scenarios
Step 3 - Data Sources
Primary Research
- Web Analytics
- Survey Reports
- Research Institute
- Latest Research Reports
- Opinion Leaders
Secondary Research
- Annual Reports
- White Paper
- Latest Press Release
- Industry Association
- Paid Database
- Investor Presentations

Step 4 - Data Triangulation
Involves using different sources of information in order to increase the validity of a study
These sources are likely to be stakeholders in a program - participants, other researchers, program staff, other community members, and so on.
Then we put all data in single framework & apply various statistical tools to find out the dynamic on the market.
During the analysis stage, feedback from the stakeholder groups would be compared to determine areas of agreement as well as areas of divergence
