

Key Insights
The global Bias Tees market is poised for robust expansion, projected to reach $1.5 billion in 2025 and demonstrating a strong compound annual growth rate (CAGR) of 8.6% throughout the forecast period of 2025-2033. This significant growth is underpinned by a confluence of critical drivers, including the escalating demand for advanced communication systems in both commercial and military sectors, the burgeoning space exploration initiatives, and the persistent need for efficient power delivery and signal biasing in high-frequency electronic applications. The market's trajectory is further fueled by advancements in semiconductor technology and the miniaturization of electronic components, enabling the development of more sophisticated and compact bias tee solutions. As industries increasingly rely on precise signal management and stable DC power injection for sensitive RF and microwave circuits, the imperative for high-performance bias tees continues to grow, creating a fertile ground for innovation and market penetration.
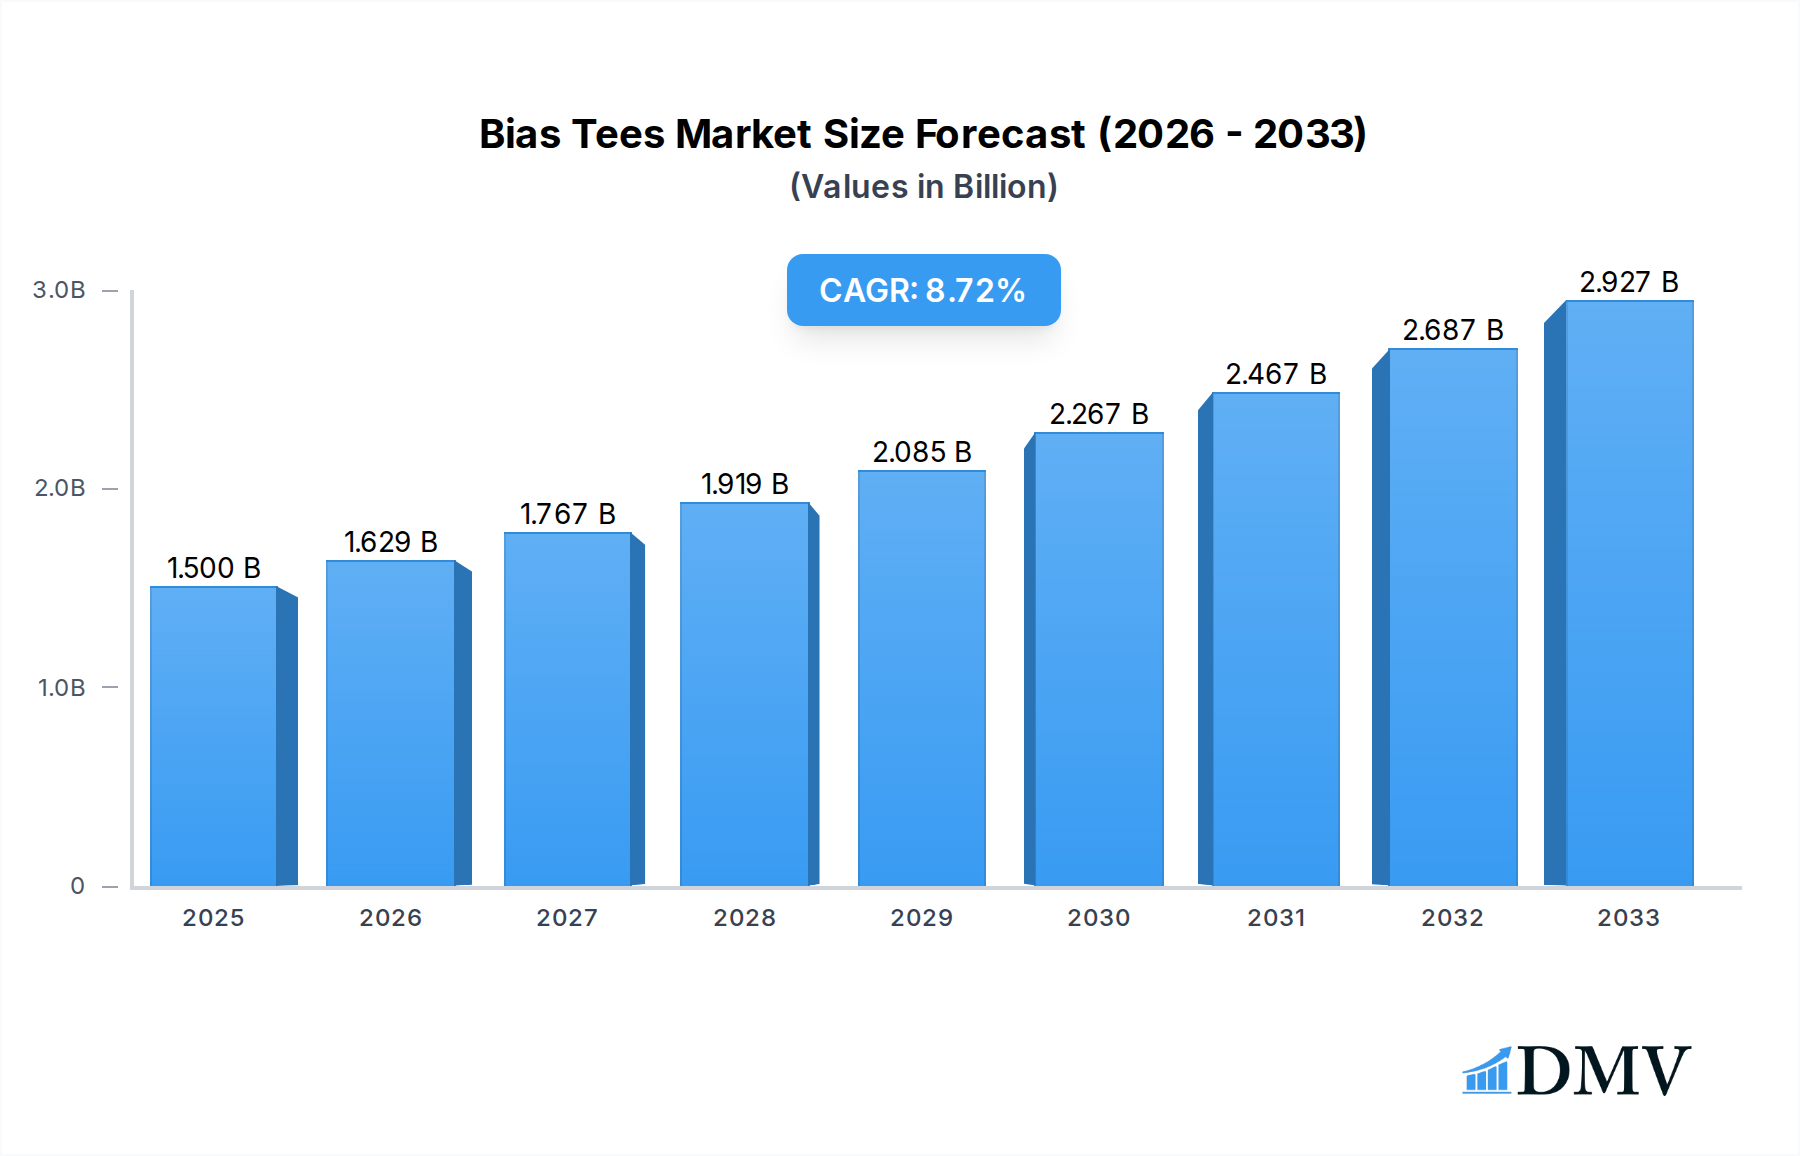
Bias Tees Market Size (In Billion)
The market is segmented by frequency ranges, with "DC to 3 GHz" likely representing a substantial share due to its widespread use in established communication and test equipment. However, the "DC to 6 GHz" and "5 to 10 GHz" segments are expected to witness faster growth, driven by the adoption of next-generation wireless technologies like 5G and beyond, as well as advancements in radar and satellite communication systems. Key restraints could include the high cost of specialized materials or manufacturing processes for very high-frequency applications and potential supply chain disruptions for critical components. Nonetheless, the overarching trend points towards increased investment in research and development to meet the evolving performance demands across various applications, from commercial telecommunications and broadcasting to critical military operations and ambitious space missions, suggesting a dynamic and promising future for the bias tee industry.

Bias Tees Company Market Share
Bias Tees Market: Comprehensive Analysis and Future Outlook (2019–2033)
This in-depth market research report offers a definitive analysis of the global Bias Tees market, encompassing historical trends, current dynamics, and future projections. Spanning the study period of 2019 to 2033, with a base and estimated year of 2025, this report provides unparalleled insights for stakeholders seeking to navigate this complex and evolving industry. The report meticulously examines market composition, industry evolution, regional dominance, product innovations, growth drivers, potential obstacles, emerging opportunities, key players, significant developments, and a strategic forecast. With a focus on high-ranking keywords such as "bias tee," "RF bias tee," "power divider," "RF components," "microwave circuits," and "satellite communications," this report is optimized for maximum search visibility and stakeholder engagement.
Bias Tees Market Composition & Trends
The global Bias Tees market exhibits a dynamic composition influenced by a blend of innovation, strategic acquisitions, and evolving regulatory landscapes. Market concentration remains a key aspect, with a few dominant players holding significant market share, estimated to be between 70-80% of the total market value. The innovation catalyst is primarily driven by the relentless pursuit of higher frequencies, increased power handling capabilities, and miniaturization in RF and microwave applications. Emerging technologies like 5G infrastructure, advanced satellite communication systems, and sophisticated electronic warfare platforms are continuously pushing the boundaries for bias tee performance and functionality. Regulatory environments, while generally supportive of technological advancement, introduce compliance requirements that manufacturers must adhere to, particularly in commercial and military segments. Substitute products, such as integrated solutions and alternative biasing methods, exist but are yet to significantly erode the core market share of discrete bias tees, especially in niche high-performance applications. End-user profiles are diverse, ranging from commercial telecommunications providers and consumer electronics manufacturers to defense contractors and space agencies. Mergers and acquisitions (M&A) activity within the industry is notable, driven by the desire for market consolidation, technology acquisition, and expanded product portfolios. Estimated M&A deal values are projected to exceed XXX billion over the forecast period, indicating a strong trend towards strategic consolidation.
- Market Share Distribution: Dominant players collectively hold an estimated 70-80% of the market value.
- Innovation Catalysts: Demand for higher frequencies, power, miniaturization, and integration in RF/microwave systems.
- Regulatory Landscape: Compliance for commercial, military, and aerospace applications is a critical factor.
- Substitute Products: Integrated solutions and alternative biasing methods are present but have limited impact on specialized bias tee demand.
- End-User Profiles: Commercial (telecom, consumer electronics), Military (defense, EW), Space (satellite communications, exploration).
- M&A Activities: Strategic consolidation to acquire technology and expand portfolios, with projected deal values exceeding XXX billion.
Bias Tees Industry Evolution
The bias tees industry has undergone significant evolution, driven by the escalating demands of the global telecommunications, defense, and aerospace sectors. Over the historical period of 2019–2024, the market witnessed a steady growth trajectory, fueled by the proliferation of wireless technologies and increasing investment in advanced RF systems. The base year of 2025 marks a crucial juncture, with projected market growth rates for bias tees expected to average between 5% and 8% annually during the forecast period of 2025–2033. This growth is intrinsically linked to the expansion of 5G networks, the continuous development of satellite constellations for global connectivity and Earth observation, and the persistent need for sophisticated electronic warfare capabilities in military applications. Technological advancements have been pivotal, with a discernible shift towards bias tees offering wider bandwidths, lower insertion loss, higher isolation, and improved linearity. Furthermore, the miniaturization of electronic components has spurred the development of smaller, more integrated bias tee solutions, catering to the stringent size, weight, and power (SWaP) constraints prevalent in many end-use applications. Consumer demand, particularly in the commercial segment, is increasingly influenced by the desire for enhanced data speeds, improved signal quality, and more reliable wireless communication, all of which rely heavily on the performance of underlying RF components like bias tees. Adoption metrics, such as the penetration rate of bias tees in new product designs and upgrades, are closely monitored indicators of industry health and future potential. For instance, the adoption of bias tees in phased array antennas for advanced radar systems has seen a substantial increase, contributing to market expansion. The industry's resilience and adaptability, even amidst global economic fluctuations, underscore the critical nature of bias tees in enabling modern electronic systems. The continuous research and development efforts by leading manufacturers are focused on pushing the performance envelope, thereby driving the industry's ongoing evolution and ensuring its relevance in an increasingly connected world.
Leading Regions, Countries, or Segments in Bias Tees
The global Bias Tees market showcases distinct regional dominance and segment leadership, driven by varied technological adoption rates, investment trends, and end-user concentrations. Among the Application segments, the Commercial sector consistently emerges as a leading driver, fueled by the insatiable demand for enhanced wireless communication infrastructure. The ongoing global rollout of 5G networks, the expansion of IoT devices, and the continuous upgrade cycles in consumer electronics are primary contributors to this segment's dominance. Investments in telecommunications infrastructure alone are projected to reach XXX billion globally by 2030, directly translating to a higher demand for RF components, including bias tees.
Within the Types segment, bias tees operating from DC to 6 GHz represent a substantial portion of the market. This frequency range is critical for a wide array of applications, including cellular base stations, Wi-Fi systems, and various industrial wireless communication modules. The versatility and broad applicability of DC to 6 GHz bias tees make them a cornerstone of the current market. However, the 5 to 10 GHz segment is exhibiting accelerated growth, driven by emerging applications in advanced radar systems, satellite communication ground stations, and specific defense electronics requiring higher frequency operation.
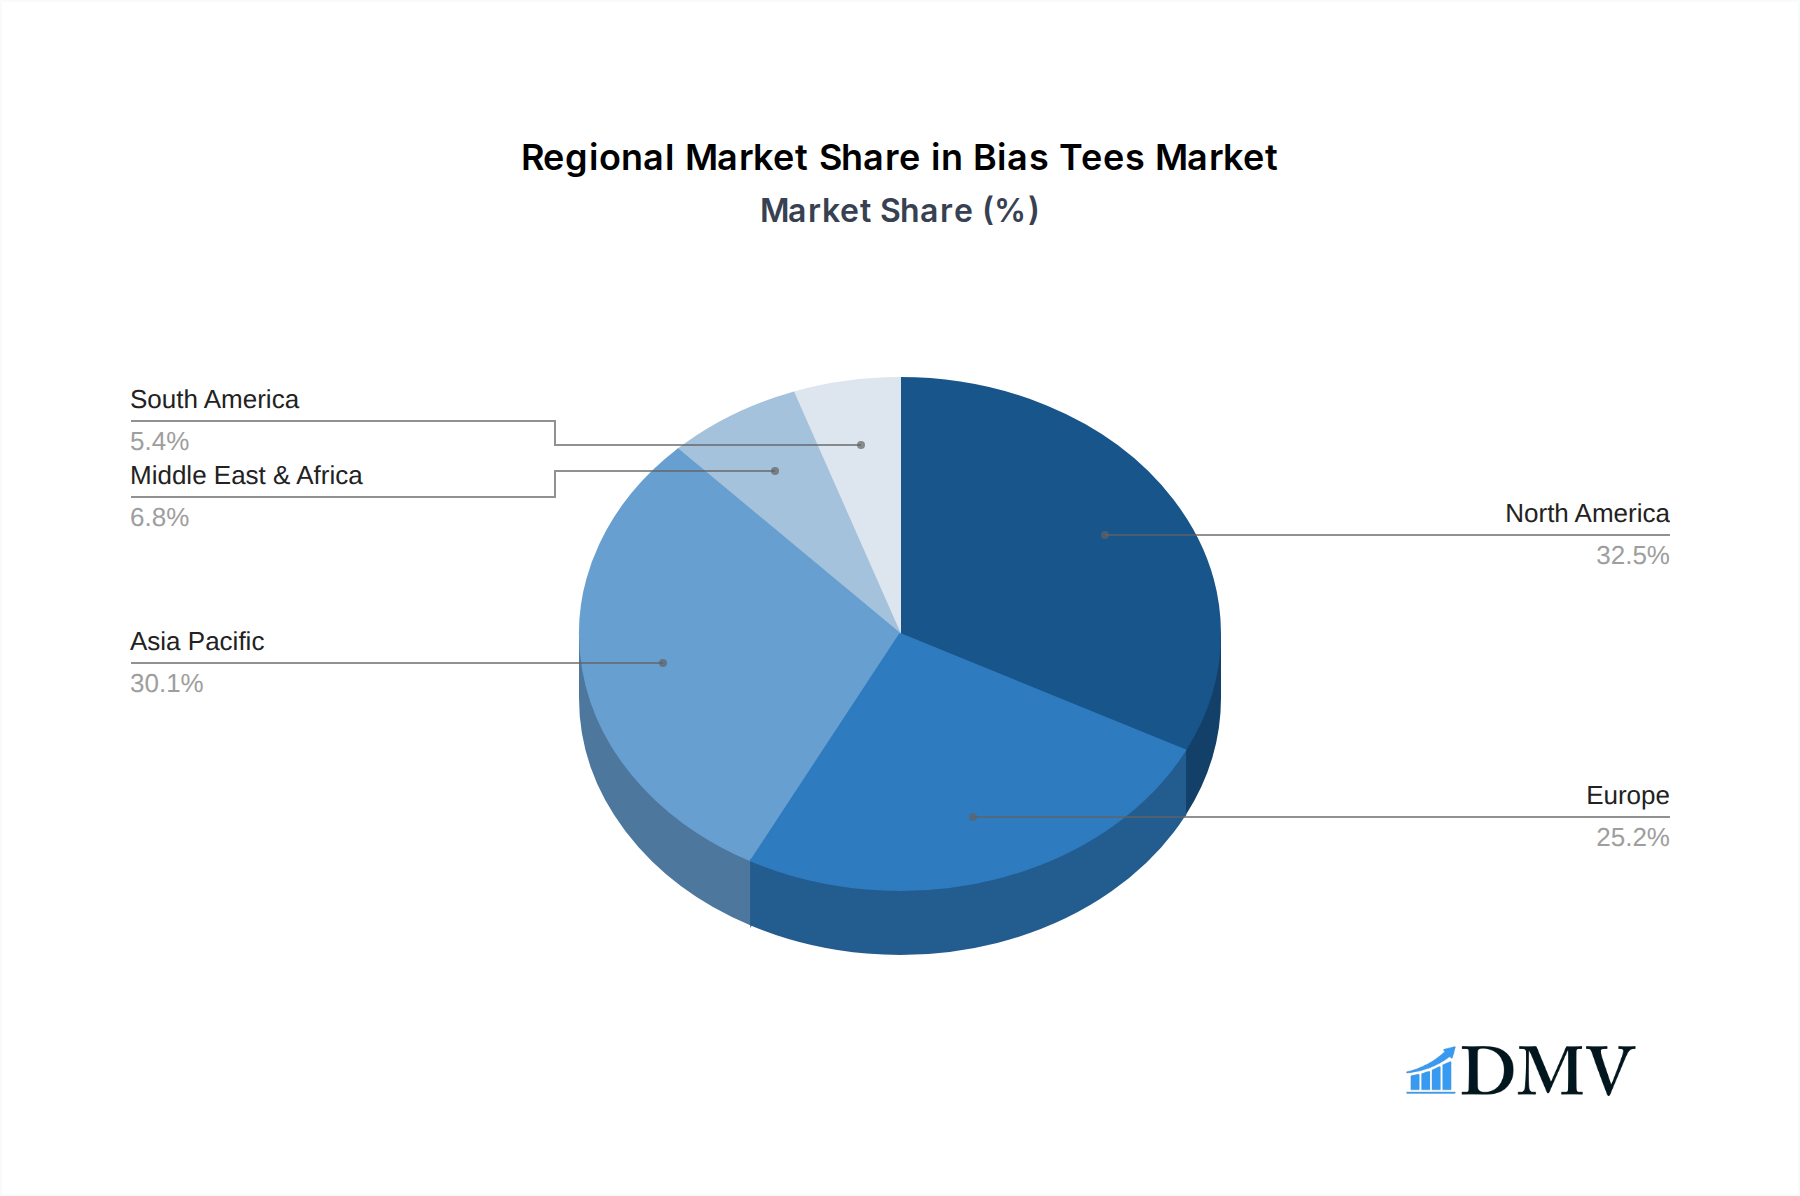
North America stands out as a leading region, largely due to its robust technological innovation ecosystem, significant investments in defense and aerospace, and rapid 5G deployment. Government initiatives supporting advanced communication research and development, coupled with a strong presence of leading RF component manufacturers and defense contractors, bolster its market position.
- Leading Application Segment: Commercial (driven by 5G, IoT, consumer electronics upgrades).
- Key Driver: Global telecommunications infrastructure investment exceeding XXX billion by 2030.
- Impact: Sustained demand for RF components, including bias tees.
- Dominant Type Segment: DC to 6 GHz (critical for cellular, Wi-Fi, industrial wireless).
- Key Driver: Broad applicability across diverse communication systems.
- Impact: Foundation of current market demand.
- Emerging Type Segment: 5 to 10 GHz (growing demand in radar, satellite, defense).
- Key Driver: Need for higher frequency operation in advanced applications.
- Impact: Significant growth potential and technological advancement focus.
- Leading Region: North America (strong innovation, defense/aerospace investment, 5G rollout).
- Key Driver: Government support for R&D, presence of key industry players.
- Impact: High adoption rates and technological leadership.
- Key Drivers in Dominance:
- Investment Trends: Substantial capital infusion into 5G infrastructure and satellite constellations.
- Regulatory Support: Favorable policies for technological advancement in critical sectors.
- End-User Concentration: High density of defense contractors and telecommunications companies.
Bias Tees Product Innovations
Bias tees are continuously being revolutionized with innovations focused on enhanced performance, miniaturization, and integration. Manufacturers are developing bias tees with exceptionally wide bandwidths, capable of supporting multi-octave frequency ranges crucial for broadband communication systems and electronic warfare. Innovations also center on achieving lower insertion loss and higher isolation, thereby improving signal integrity and system efficiency. The development of highly efficient power biasing techniques and integrated biasing solutions within single components addresses the critical SWaP constraints in modern electronic designs, particularly for defense and aerospace applications. These advancements are enabling next-generation radar systems, advanced satellite communication payloads, and more compact, powerful wireless devices. Performance metrics like improved linearity, reduced noise figure, and higher power handling capabilities are key selling propositions driving the adoption of these novel bias tee solutions.
Propelling Factors for Bias Tees Growth
The bias tees market is propelled by a confluence of technological advancements, economic drivers, and supportive regulatory frameworks. The relentless expansion of wireless communication technologies, including the ongoing global deployment of 5G networks and the growing demand for higher data rates, is a primary growth catalyst. The increasing sophistication and miniaturization requirements in defense and aerospace sectors, particularly for electronic warfare, radar, and satellite communication systems, are also significant drivers. Furthermore, substantial government investments in these critical sectors globally provide substantial impetus. The economic viability of new applications leveraging bias tees, such as the burgeoning market for autonomous vehicles and advanced IoT devices, further fuels demand.
- Technological Advancements: Development of 5G, IoT, advanced radar, and satellite communication.
- Economic Influences: Increased spending on telecommunications infrastructure and defense modernization.
- Regulatory Support: Government initiatives and funding for R&D in critical technology sectors.
- Emerging Applications: Growth in autonomous systems and connected devices requiring robust RF components.
Obstacles in the Bias Tees Market
Despite the robust growth, the bias tees market faces several obstacles that could temper its expansion. Supply chain disruptions, particularly those related to specialized raw materials and component sourcing, can lead to production delays and increased costs. Intense competition among a growing number of manufacturers, especially in price-sensitive segments, can exert downward pressure on profit margins. Rapid technological obsolescence necessitates continuous and significant R&D investment to remain competitive, posing a financial burden on smaller players. Furthermore, stringent quality control and certification requirements, especially for military and space applications, add to the cost and complexity of product development and market entry. The cost of advanced materials and manufacturing processes required for high-performance bias tees can also be a barrier to widespread adoption in some cost-sensitive commercial applications.
- Supply Chain Vulnerabilities: Risks associated with sourcing specialized materials and components.
- Competitive Pressures: Intense rivalry leading to price wars and margin erosion.
- Technological Obsolescence: The need for continuous R&D investment to stay ahead.
- Regulatory Hurdles: Stringent certification and quality standards for critical applications.
- High Production Costs: Expense of advanced materials and sophisticated manufacturing.
Future Opportunities in Bias Tees
The bias tees market is poised to capitalize on several emerging opportunities, driven by evolving technological landscapes and new market frontiers. The continued expansion of satellite communication, including the development of low Earth orbit (LEO) constellations, presents a significant opportunity for miniaturized and high-performance bias tees. The growing demand for advanced sensing technologies, such as LiDAR and radar for autonomous systems and industrial automation, will also drive innovation and market growth. Furthermore, the increasing adoption of higher frequency bands for wireless communication, including millimeter-wave (mmWave) for future 6G networks, opens avenues for specialized bias tee designs. The integration of bias tees into phased array antennas and advanced signal processing modules offers further opportunities for customized solutions and value-added products.
- Satellite Communication Expansion: Growth in LEO constellations and global connectivity initiatives.
- Advanced Sensing Technologies: Increased demand for bias tees in LiDAR, radar, and autonomous systems.
- Higher Frequency Adoption: Opportunities in mmWave and future 6G communication standards.
- Integrated Solutions: Development of bias tees for phased array antennas and advanced modules.
Major Players in the Bias Tees Ecosystem
The bias tees ecosystem is comprised of several key companies that are instrumental in driving innovation and market supply. These include:
- Analog Microwave Design
- API Technologies - Inmet
- AtlanTecRF
- Centric RF
- Clear Microwave, Inc.
- Crystek Corporation
- ETL Systems
- Fairview Microwave
- HYPERLABS Inc
- JFW Industries
- Jyebao
- L-3 Narda-ATM
- Marki Microwave
- Maury Microwave
- MC2-Technologies
- MECA
- Metropole Products Inc
- Mini Circuits
- MP Device
- Pasternack Enterprises Inc
Key Developments in Bias Tees Industry
- 2023: Launch of new broadband bias tees with extended frequency ranges by several manufacturers.
- 2023: Increased M&A activity, with XXX billion in deals announced focusing on technology acquisition and market consolidation.
- 2024: Introduction of highly integrated bias tee modules with enhanced SWaP for defense applications.
- 2024: Significant advancements in linearity and power handling capabilities for bias tees supporting 5G mmWave frequencies.
- 2025 (Projected): Emergence of bias tees with advanced filtering capabilities for improved signal selectivity.
- 2025 (Projected): Increased adoption of bias tees in next-generation satellite communication payloads.
- 2026 (Projected): Development of more cost-effective bias tee solutions for broader commercial IoT applications.
- 2027 (Projected): Innovations in bias tees catering to the emerging requirements of quantum computing systems.
- 2028-2030 (Projected): Significant market growth anticipated with the widespread deployment of 6G infrastructure.
- 2030-2033 (Projected): Continued focus on miniaturization and higher frequency integration driven by evolving communication standards.
Strategic Bias Tees Market Forecast
The strategic forecast for the bias tees market indicates a robust growth trajectory, driven by sustained technological innovation and expanding application frontiers. The ongoing global demand for enhanced wireless connectivity, particularly through 5G and future 6G networks, will continue to be a primary growth catalyst. The significant investments in defense modernization, space exploration, and satellite communication infrastructure worldwide will further underpin market expansion. Emerging opportunities in sectors like autonomous systems, advanced sensing, and industrial IoT present new avenues for bias tee adoption. While challenges such as supply chain volatility and intense competition persist, the inherent criticality of bias tees in enabling advanced electronic systems positions the market for continued, strong growth and strategic development over the forecast period. The market is expected to witness an increasing trend towards higher frequency operation, miniaturization, and integration, offering lucrative prospects for manufacturers adept at innovation and catering to the evolving needs of diverse end-user segments.
Bias Tees Segmentation
-
1. Application
- 1.1. Commercial
- 1.2. Military
- 1.3. Space
- 1.4. Others
-
2. Types
- 2.1. DC to 3 GHz
- 2.2. DC to 6 GHz
- 2.3. 5 to 10 GHz
Bias Tees Segmentation By Geography
-
1. North America
- 1.1. United States
- 1.2. Canada
- 1.3. Mexico
-
2. South America
- 2.1. Brazil
- 2.2. Argentina
- 2.3. Rest of South America
-
3. Europe
- 3.1. United Kingdom
- 3.2. Germany
- 3.3. France
- 3.4. Italy
- 3.5. Spain
- 3.6. Russia
- 3.7. Benelux
- 3.8. Nordics
- 3.9. Rest of Europe
-
4. Middle East & Africa
- 4.1. Turkey
- 4.2. Israel
- 4.3. GCC
- 4.4. North Africa
- 4.5. South Africa
- 4.6. Rest of Middle East & Africa
-
5. Asia Pacific
- 5.1. China
- 5.2. India
- 5.3. Japan
- 5.4. South Korea
- 5.5. ASEAN
- 5.6. Oceania
- 5.7. Rest of Asia Pacific
Bias Tees Regional Market Share
Geographic Coverage of Bias Tees
Bias Tees REPORT HIGHLIGHTS
| Aspects | Details |
|---|---|
| Study Period | 2020-2034 |
| Base Year | 2025 |
| Estimated Year | 2026 |
| Forecast Period | 2026-2034 |
| Historical Period | 2020-2025 |
| Growth Rate | CAGR of 8.6% from 2020-2034 |
| Segmentation |
|
Table of Contents
- 1. Introduction
- 1.1. Research Scope
- 1.2. Market Segmentation
- 1.3. Research Methodology
- 1.4. Definitions and Assumptions
- 2. Executive Summary
- 2.1. Introduction
- 3. Market Dynamics
- 3.1. Introduction
- 3.2. Market Drivers
- 3.3. Market Restrains
- 3.4. Market Trends
- 4. Market Factor Analysis
- 4.1. Porters Five Forces
- 4.2. Supply/Value Chain
- 4.3. PESTEL analysis
- 4.4. Market Entropy
- 4.5. Patent/Trademark Analysis
- 5. Global Bias Tees Analysis, Insights and Forecast, 2020-2032
- 5.1. Market Analysis, Insights and Forecast - by Application
- 5.1.1. Commercial
- 5.1.2. Military
- 5.1.3. Space
- 5.1.4. Others
- 5.2. Market Analysis, Insights and Forecast - by Types
- 5.2.1. DC to 3 GHz
- 5.2.2. DC to 6 GHz
- 5.2.3. 5 to 10 GHz
- 5.3. Market Analysis, Insights and Forecast - by Region
- 5.3.1. North America
- 5.3.2. South America
- 5.3.3. Europe
- 5.3.4. Middle East & Africa
- 5.3.5. Asia Pacific
- 5.1. Market Analysis, Insights and Forecast - by Application
- 6. North America Bias Tees Analysis, Insights and Forecast, 2020-2032
- 6.1. Market Analysis, Insights and Forecast - by Application
- 6.1.1. Commercial
- 6.1.2. Military
- 6.1.3. Space
- 6.1.4. Others
- 6.2. Market Analysis, Insights and Forecast - by Types
- 6.2.1. DC to 3 GHz
- 6.2.2. DC to 6 GHz
- 6.2.3. 5 to 10 GHz
- 6.1. Market Analysis, Insights and Forecast - by Application
- 7. South America Bias Tees Analysis, Insights and Forecast, 2020-2032
- 7.1. Market Analysis, Insights and Forecast - by Application
- 7.1.1. Commercial
- 7.1.2. Military
- 7.1.3. Space
- 7.1.4. Others
- 7.2. Market Analysis, Insights and Forecast - by Types
- 7.2.1. DC to 3 GHz
- 7.2.2. DC to 6 GHz
- 7.2.3. 5 to 10 GHz
- 7.1. Market Analysis, Insights and Forecast - by Application
- 8. Europe Bias Tees Analysis, Insights and Forecast, 2020-2032
- 8.1. Market Analysis, Insights and Forecast - by Application
- 8.1.1. Commercial
- 8.1.2. Military
- 8.1.3. Space
- 8.1.4. Others
- 8.2. Market Analysis, Insights and Forecast - by Types
- 8.2.1. DC to 3 GHz
- 8.2.2. DC to 6 GHz
- 8.2.3. 5 to 10 GHz
- 8.1. Market Analysis, Insights and Forecast - by Application
- 9. Middle East & Africa Bias Tees Analysis, Insights and Forecast, 2020-2032
- 9.1. Market Analysis, Insights and Forecast - by Application
- 9.1.1. Commercial
- 9.1.2. Military
- 9.1.3. Space
- 9.1.4. Others
- 9.2. Market Analysis, Insights and Forecast - by Types
- 9.2.1. DC to 3 GHz
- 9.2.2. DC to 6 GHz
- 9.2.3. 5 to 10 GHz
- 9.1. Market Analysis, Insights and Forecast - by Application
- 10. Asia Pacific Bias Tees Analysis, Insights and Forecast, 2020-2032
- 10.1. Market Analysis, Insights and Forecast - by Application
- 10.1.1. Commercial
- 10.1.2. Military
- 10.1.3. Space
- 10.1.4. Others
- 10.2. Market Analysis, Insights and Forecast - by Types
- 10.2.1. DC to 3 GHz
- 10.2.2. DC to 6 GHz
- 10.2.3. 5 to 10 GHz
- 10.1. Market Analysis, Insights and Forecast - by Application
- 11. Competitive Analysis
- 11.1. Global Market Share Analysis 2025
- 11.2. Company Profiles
- 11.2.1 Analog Microwave Design
- 11.2.1.1. Overview
- 11.2.1.2. Products
- 11.2.1.3. SWOT Analysis
- 11.2.1.4. Recent Developments
- 11.2.1.5. Financials (Based on Availability)
- 11.2.2 API Technologies - Inmet
- 11.2.2.1. Overview
- 11.2.2.2. Products
- 11.2.2.3. SWOT Analysis
- 11.2.2.4. Recent Developments
- 11.2.2.5. Financials (Based on Availability)
- 11.2.3 AtlanTecRF
- 11.2.3.1. Overview
- 11.2.3.2. Products
- 11.2.3.3. SWOT Analysis
- 11.2.3.4. Recent Developments
- 11.2.3.5. Financials (Based on Availability)
- 11.2.4 Centric RF
- 11.2.4.1. Overview
- 11.2.4.2. Products
- 11.2.4.3. SWOT Analysis
- 11.2.4.4. Recent Developments
- 11.2.4.5. Financials (Based on Availability)
- 11.2.5 Clear Microwave
- 11.2.5.1. Overview
- 11.2.5.2. Products
- 11.2.5.3. SWOT Analysis
- 11.2.5.4. Recent Developments
- 11.2.5.5. Financials (Based on Availability)
- 11.2.6 Inc
- 11.2.6.1. Overview
- 11.2.6.2. Products
- 11.2.6.3. SWOT Analysis
- 11.2.6.4. Recent Developments
- 11.2.6.5. Financials (Based on Availability)
- 11.2.7 Crystek Corporation
- 11.2.7.1. Overview
- 11.2.7.2. Products
- 11.2.7.3. SWOT Analysis
- 11.2.7.4. Recent Developments
- 11.2.7.5. Financials (Based on Availability)
- 11.2.8 ETL Systems
- 11.2.8.1. Overview
- 11.2.8.2. Products
- 11.2.8.3. SWOT Analysis
- 11.2.8.4. Recent Developments
- 11.2.8.5. Financials (Based on Availability)
- 11.2.9 Fairview Microwave
- 11.2.9.1. Overview
- 11.2.9.2. Products
- 11.2.9.3. SWOT Analysis
- 11.2.9.4. Recent Developments
- 11.2.9.5. Financials (Based on Availability)
- 11.2.10 HYPERLABS Inc
- 11.2.10.1. Overview
- 11.2.10.2. Products
- 11.2.10.3. SWOT Analysis
- 11.2.10.4. Recent Developments
- 11.2.10.5. Financials (Based on Availability)
- 11.2.11 JFW Industries
- 11.2.11.1. Overview
- 11.2.11.2. Products
- 11.2.11.3. SWOT Analysis
- 11.2.11.4. Recent Developments
- 11.2.11.5. Financials (Based on Availability)
- 11.2.12 Jyebao
- 11.2.12.1. Overview
- 11.2.12.2. Products
- 11.2.12.3. SWOT Analysis
- 11.2.12.4. Recent Developments
- 11.2.12.5. Financials (Based on Availability)
- 11.2.13 L-3 Narda-ATM
- 11.2.13.1. Overview
- 11.2.13.2. Products
- 11.2.13.3. SWOT Analysis
- 11.2.13.4. Recent Developments
- 11.2.13.5. Financials (Based on Availability)
- 11.2.14 Marki Microwave
- 11.2.14.1. Overview
- 11.2.14.2. Products
- 11.2.14.3. SWOT Analysis
- 11.2.14.4. Recent Developments
- 11.2.14.5. Financials (Based on Availability)
- 11.2.15 Maury Microwave
- 11.2.15.1. Overview
- 11.2.15.2. Products
- 11.2.15.3. SWOT Analysis
- 11.2.15.4. Recent Developments
- 11.2.15.5. Financials (Based on Availability)
- 11.2.16 MC2-Technologies
- 11.2.16.1. Overview
- 11.2.16.2. Products
- 11.2.16.3. SWOT Analysis
- 11.2.16.4. Recent Developments
- 11.2.16.5. Financials (Based on Availability)
- 11.2.17 MECA
- 11.2.17.1. Overview
- 11.2.17.2. Products
- 11.2.17.3. SWOT Analysis
- 11.2.17.4. Recent Developments
- 11.2.17.5. Financials (Based on Availability)
- 11.2.18 Metropole Products Inc
- 11.2.18.1. Overview
- 11.2.18.2. Products
- 11.2.18.3. SWOT Analysis
- 11.2.18.4. Recent Developments
- 11.2.18.5. Financials (Based on Availability)
- 11.2.19 Mini Circuits
- 11.2.19.1. Overview
- 11.2.19.2. Products
- 11.2.19.3. SWOT Analysis
- 11.2.19.4. Recent Developments
- 11.2.19.5. Financials (Based on Availability)
- 11.2.20 MP Device
- 11.2.20.1. Overview
- 11.2.20.2. Products
- 11.2.20.3. SWOT Analysis
- 11.2.20.4. Recent Developments
- 11.2.20.5. Financials (Based on Availability)
- 11.2.21 Pasternack Enterprises Inc
- 11.2.21.1. Overview
- 11.2.21.2. Products
- 11.2.21.3. SWOT Analysis
- 11.2.21.4. Recent Developments
- 11.2.21.5. Financials (Based on Availability)
- 11.2.1 Analog Microwave Design
List of Figures
- Figure 1: Global Bias Tees Revenue Breakdown (undefined, %) by Region 2025 & 2033
- Figure 2: North America Bias Tees Revenue (undefined), by Application 2025 & 2033
- Figure 3: North America Bias Tees Revenue Share (%), by Application 2025 & 2033
- Figure 4: North America Bias Tees Revenue (undefined), by Types 2025 & 2033
- Figure 5: North America Bias Tees Revenue Share (%), by Types 2025 & 2033
- Figure 6: North America Bias Tees Revenue (undefined), by Country 2025 & 2033
- Figure 7: North America Bias Tees Revenue Share (%), by Country 2025 & 2033
- Figure 8: South America Bias Tees Revenue (undefined), by Application 2025 & 2033
- Figure 9: South America Bias Tees Revenue Share (%), by Application 2025 & 2033
- Figure 10: South America Bias Tees Revenue (undefined), by Types 2025 & 2033
- Figure 11: South America Bias Tees Revenue Share (%), by Types 2025 & 2033
- Figure 12: South America Bias Tees Revenue (undefined), by Country 2025 & 2033
- Figure 13: South America Bias Tees Revenue Share (%), by Country 2025 & 2033
- Figure 14: Europe Bias Tees Revenue (undefined), by Application 2025 & 2033
- Figure 15: Europe Bias Tees Revenue Share (%), by Application 2025 & 2033
- Figure 16: Europe Bias Tees Revenue (undefined), by Types 2025 & 2033
- Figure 17: Europe Bias Tees Revenue Share (%), by Types 2025 & 2033
- Figure 18: Europe Bias Tees Revenue (undefined), by Country 2025 & 2033
- Figure 19: Europe Bias Tees Revenue Share (%), by Country 2025 & 2033
- Figure 20: Middle East & Africa Bias Tees Revenue (undefined), by Application 2025 & 2033
- Figure 21: Middle East & Africa Bias Tees Revenue Share (%), by Application 2025 & 2033
- Figure 22: Middle East & Africa Bias Tees Revenue (undefined), by Types 2025 & 2033
- Figure 23: Middle East & Africa Bias Tees Revenue Share (%), by Types 2025 & 2033
- Figure 24: Middle East & Africa Bias Tees Revenue (undefined), by Country 2025 & 2033
- Figure 25: Middle East & Africa Bias Tees Revenue Share (%), by Country 2025 & 2033
- Figure 26: Asia Pacific Bias Tees Revenue (undefined), by Application 2025 & 2033
- Figure 27: Asia Pacific Bias Tees Revenue Share (%), by Application 2025 & 2033
- Figure 28: Asia Pacific Bias Tees Revenue (undefined), by Types 2025 & 2033
- Figure 29: Asia Pacific Bias Tees Revenue Share (%), by Types 2025 & 2033
- Figure 30: Asia Pacific Bias Tees Revenue (undefined), by Country 2025 & 2033
- Figure 31: Asia Pacific Bias Tees Revenue Share (%), by Country 2025 & 2033
List of Tables
- Table 1: Global Bias Tees Revenue undefined Forecast, by Application 2020 & 2033
- Table 2: Global Bias Tees Revenue undefined Forecast, by Types 2020 & 2033
- Table 3: Global Bias Tees Revenue undefined Forecast, by Region 2020 & 2033
- Table 4: Global Bias Tees Revenue undefined Forecast, by Application 2020 & 2033
- Table 5: Global Bias Tees Revenue undefined Forecast, by Types 2020 & 2033
- Table 6: Global Bias Tees Revenue undefined Forecast, by Country 2020 & 2033
- Table 7: United States Bias Tees Revenue (undefined) Forecast, by Application 2020 & 2033
- Table 8: Canada Bias Tees Revenue (undefined) Forecast, by Application 2020 & 2033
- Table 9: Mexico Bias Tees Revenue (undefined) Forecast, by Application 2020 & 2033
- Table 10: Global Bias Tees Revenue undefined Forecast, by Application 2020 & 2033
- Table 11: Global Bias Tees Revenue undefined Forecast, by Types 2020 & 2033
- Table 12: Global Bias Tees Revenue undefined Forecast, by Country 2020 & 2033
- Table 13: Brazil Bias Tees Revenue (undefined) Forecast, by Application 2020 & 2033
- Table 14: Argentina Bias Tees Revenue (undefined) Forecast, by Application 2020 & 2033
- Table 15: Rest of South America Bias Tees Revenue (undefined) Forecast, by Application 2020 & 2033
- Table 16: Global Bias Tees Revenue undefined Forecast, by Application 2020 & 2033
- Table 17: Global Bias Tees Revenue undefined Forecast, by Types 2020 & 2033
- Table 18: Global Bias Tees Revenue undefined Forecast, by Country 2020 & 2033
- Table 19: United Kingdom Bias Tees Revenue (undefined) Forecast, by Application 2020 & 2033
- Table 20: Germany Bias Tees Revenue (undefined) Forecast, by Application 2020 & 2033
- Table 21: France Bias Tees Revenue (undefined) Forecast, by Application 2020 & 2033
- Table 22: Italy Bias Tees Revenue (undefined) Forecast, by Application 2020 & 2033
- Table 23: Spain Bias Tees Revenue (undefined) Forecast, by Application 2020 & 2033
- Table 24: Russia Bias Tees Revenue (undefined) Forecast, by Application 2020 & 2033
- Table 25: Benelux Bias Tees Revenue (undefined) Forecast, by Application 2020 & 2033
- Table 26: Nordics Bias Tees Revenue (undefined) Forecast, by Application 2020 & 2033
- Table 27: Rest of Europe Bias Tees Revenue (undefined) Forecast, by Application 2020 & 2033
- Table 28: Global Bias Tees Revenue undefined Forecast, by Application 2020 & 2033
- Table 29: Global Bias Tees Revenue undefined Forecast, by Types 2020 & 2033
- Table 30: Global Bias Tees Revenue undefined Forecast, by Country 2020 & 2033
- Table 31: Turkey Bias Tees Revenue (undefined) Forecast, by Application 2020 & 2033
- Table 32: Israel Bias Tees Revenue (undefined) Forecast, by Application 2020 & 2033
- Table 33: GCC Bias Tees Revenue (undefined) Forecast, by Application 2020 & 2033
- Table 34: North Africa Bias Tees Revenue (undefined) Forecast, by Application 2020 & 2033
- Table 35: South Africa Bias Tees Revenue (undefined) Forecast, by Application 2020 & 2033
- Table 36: Rest of Middle East & Africa Bias Tees Revenue (undefined) Forecast, by Application 2020 & 2033
- Table 37: Global Bias Tees Revenue undefined Forecast, by Application 2020 & 2033
- Table 38: Global Bias Tees Revenue undefined Forecast, by Types 2020 & 2033
- Table 39: Global Bias Tees Revenue undefined Forecast, by Country 2020 & 2033
- Table 40: China Bias Tees Revenue (undefined) Forecast, by Application 2020 & 2033
- Table 41: India Bias Tees Revenue (undefined) Forecast, by Application 2020 & 2033
- Table 42: Japan Bias Tees Revenue (undefined) Forecast, by Application 2020 & 2033
- Table 43: South Korea Bias Tees Revenue (undefined) Forecast, by Application 2020 & 2033
- Table 44: ASEAN Bias Tees Revenue (undefined) Forecast, by Application 2020 & 2033
- Table 45: Oceania Bias Tees Revenue (undefined) Forecast, by Application 2020 & 2033
- Table 46: Rest of Asia Pacific Bias Tees Revenue (undefined) Forecast, by Application 2020 & 2033
Frequently Asked Questions
1. What is the projected Compound Annual Growth Rate (CAGR) of the Bias Tees?
The projected CAGR is approximately 8.6%.
2. Which companies are prominent players in the Bias Tees?
Key companies in the market include Analog Microwave Design, API Technologies - Inmet, AtlanTecRF, Centric RF, Clear Microwave, Inc, Crystek Corporation, ETL Systems, Fairview Microwave, HYPERLABS Inc, JFW Industries, Jyebao, L-3 Narda-ATM, Marki Microwave, Maury Microwave, MC2-Technologies, MECA, Metropole Products Inc, Mini Circuits, MP Device, Pasternack Enterprises Inc.
3. What are the main segments of the Bias Tees?
The market segments include Application, Types.
4. Can you provide details about the market size?
The market size is estimated to be USD XXX N/A as of 2022.
5. What are some drivers contributing to market growth?
N/A
6. What are the notable trends driving market growth?
N/A
7. Are there any restraints impacting market growth?
N/A
8. Can you provide examples of recent developments in the market?
N/A
9. What pricing options are available for accessing the report?
Pricing options include single-user, multi-user, and enterprise licenses priced at USD 2900.00, USD 4350.00, and USD 5800.00 respectively.
10. Is the market size provided in terms of value or volume?
The market size is provided in terms of value, measured in N/A.
11. Are there any specific market keywords associated with the report?
Yes, the market keyword associated with the report is "Bias Tees," which aids in identifying and referencing the specific market segment covered.
12. How do I determine which pricing option suits my needs best?
The pricing options vary based on user requirements and access needs. Individual users may opt for single-user licenses, while businesses requiring broader access may choose multi-user or enterprise licenses for cost-effective access to the report.
13. Are there any additional resources or data provided in the Bias Tees report?
While the report offers comprehensive insights, it's advisable to review the specific contents or supplementary materials provided to ascertain if additional resources or data are available.
14. How can I stay updated on further developments or reports in the Bias Tees?
To stay informed about further developments, trends, and reports in the Bias Tees, consider subscribing to industry newsletters, following relevant companies and organizations, or regularly checking reputable industry news sources and publications.
Methodology
Step 1 - Identification of Relevant Samples Size from Population Database


Step 2 - Approaches for Defining Global Market Size (Value, Volume* & Price*)

Note*: In applicable scenarios
Step 3 - Data Sources
Primary Research
- Web Analytics
- Survey Reports
- Research Institute
- Latest Research Reports
- Opinion Leaders
Secondary Research
- Annual Reports
- White Paper
- Latest Press Release
- Industry Association
- Paid Database
- Investor Presentations

Step 4 - Data Triangulation
Involves using different sources of information in order to increase the validity of a study
These sources are likely to be stakeholders in a program - participants, other researchers, program staff, other community members, and so on.
Then we put all data in single framework & apply various statistical tools to find out the dynamic on the market.
During the analysis stage, feedback from the stakeholder groups would be compared to determine areas of agreement as well as areas of divergence