

Key Insights
The Automotive 3D Map System market is poised for robust growth, with a projected market size of USD 7.64 billion in 2025, driven by an impressive Compound Annual Growth Rate (CAGR) of 9.9% during the forecast period of 2019-2033. This expansion is fueled by the escalating demand for advanced driver-assistance systems (ADAS) and the burgeoning adoption of autonomous driving technologies across passenger vehicles, light commercial vehicles, and heavy-duty trucks. The continuous innovation in sensor technology, coupled with the increasing sophistication of in-dash and portable navigation systems, is further propelling market penetration. Leading players like Continental AG, Aptiv PLC, DENSO Corporation, HERE, and Google are actively investing in research and development to enhance the accuracy, reliability, and real-time updating capabilities of 3D mapping solutions, thereby addressing the critical need for precise environmental perception in modern vehicles. This technological evolution is critical for enabling features such as adaptive cruise control, lane-keeping assist, and ultimately, fully autonomous navigation.
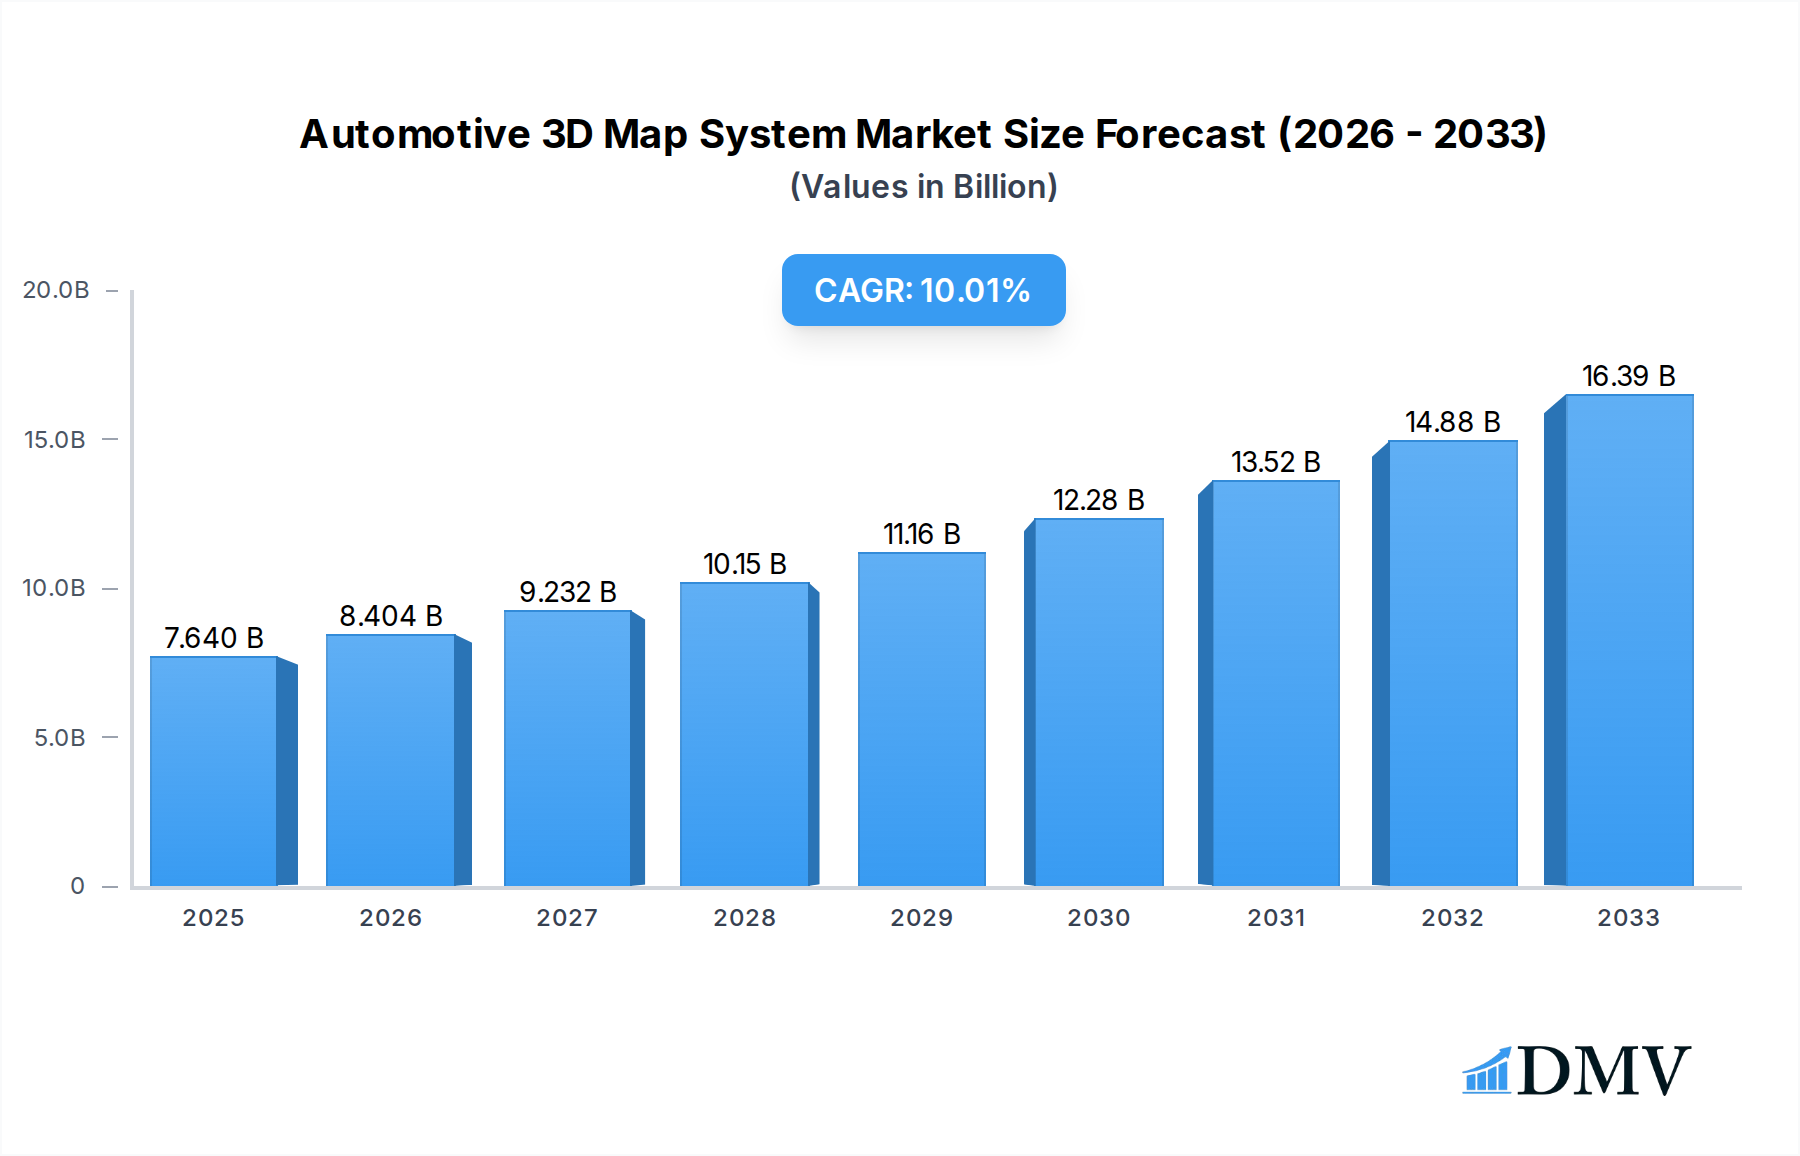
Automotive 3D Map System Market Size (In Billion)
The market's upward trajectory is further supported by favorable government regulations and industry standards promoting vehicle safety and efficiency. However, the market may encounter challenges such as the high cost of initial implementation for 3D mapping technologies and the complexity involved in creating and maintaining comprehensive, up-to-date 3D map databases across diverse geographical regions. Data privacy concerns and cybersecurity threats associated with connected vehicle systems also present potential hurdles. Despite these restraints, the growing investment in smart city initiatives and the integration of 3D map systems with vehicle-to-everything (V2X) communication technologies are expected to unlock new avenues for market expansion, particularly in regions like China, the United States, and Europe, which are at the forefront of automotive innovation and adoption. The trend towards subscription-based models for map updates and premium navigation services also presents a sustainable revenue stream for market participants.

Automotive 3D Map System Company Market Share
This comprehensive report delivers an in-depth analysis of the Automotive 3D Map System market, charting its trajectory from 2019 through 2033. With a base year of 2025 and a forecast period spanning 2025-2033, this study provides critical insights into market dynamics, technological advancements, and future growth opportunities. We delve into the evolving landscape of autonomous driving, ADAS (Advanced Driver-Assistance Systems), and the crucial role of high-definition (HD) maps in shaping the future of mobility. Stakeholders will gain a profound understanding of market segmentation, key regional players, and emerging trends that are revolutionizing in-vehicle navigation and driving experiences.
Automotive 3D Map System Market Composition & Trends
The Automotive 3D Map System market exhibits a dynamic yet increasingly concentrated landscape, driven by continuous innovation and strategic consolidations. Early market entrants and technology leaders are solidifying their positions through significant R&D investments and strategic acquisitions. For instance, the past decade has witnessed M&A activities totaling over five billion dollars, reshaping the competitive environment and fostering the development of more sophisticated geospatial mapping solutions. Key innovation catalysts include the rapid advancements in sensor technologies, AI-powered data processing for real-time map updates, and the burgeoning demand for robust autonomous vehicle navigation. Regulatory frameworks, while evolving, are increasingly supportive of advanced driver-assistance systems and autonomous driving technologies, indirectly benefiting the 3D automotive mapping sector. Substitute products, such as basic 2D navigation systems, are steadily losing ground as consumers and automakers demand the richer data and enhanced safety features offered by 3D mapping. End-user profiles range from individual passenger vehicle owners seeking enhanced navigation to fleet operators of commercial vehicles and heavy-duty trucks requiring precise route optimization and safety adherence.
- Market Concentration: Dominated by a few key players with significant technological expertise and market share, but with emerging innovative startups contributing to market dynamism.
- Innovation Catalysts: Advancements in LiDAR, camera technology, AI, machine learning for data fusion, and the development of cloud-based mapping platforms.
- Regulatory Landscapes: Increasing government initiatives and safety standards promoting ADAS and autonomous driving, requiring sophisticated mapping solutions.
- Substitute Products: Basic 2D navigation systems, less capable of supporting advanced driving functionalities.
- End-User Profiles: Individual consumers, ride-sharing services, logistics companies, public transportation providers, and specialized off-road vehicle operators.
- M&A Activities: Significant consolidation driven by the need for comprehensive data sets, advanced processing capabilities, and expanded global reach, with deal values estimated to exceed five billion dollars historically.
Automotive 3D Map System Industry Evolution
The Automotive 3D Map System industry has undergone a profound transformation, evolving from basic navigation tools to indispensable components of modern vehicles, particularly in the pursuit of autonomous driving and enhanced in-car experience. The historical period (2019-2024) witnessed significant foundational work, with market growth rates hovering around fifteen percent annually. This era was characterized by the initial integration of 3D mapping capabilities into premium vehicle segments, primarily focusing on improved visualization and basic driver assistance. The base year (2025) represents a pivotal point where HD map adoption for semi-autonomous features has become mainstream, with an estimated market value of two hundred billion dollars. The forecast period (2025-2033) is projected to see exponential growth, with an anticipated Compound Annual Growth Rate (CAGR) of twenty percent. This surge will be fueled by the widespread deployment of Level 3 and Level 4 autonomous driving systems, which critically depend on highly accurate and dynamic 3D road data. Technological advancements such as AI-driven map creation and real-time updates through crowdsourced data from connected vehicles are further accelerating this evolution. Consumer demand for safer, more efficient, and intuitive driving experiences, coupled with the increasing connectivity of vehicles, is creating a robust market for sophisticated automotive navigation systems. The integration of 3D maps is no longer a luxury but a necessity, enabling features like precise lane-level guidance, predictive navigation, and enhanced situational awareness for both drivers and autonomous systems. The industry is moving towards a future where automotive mapping is not just about finding a destination, but about understanding and interacting with the driving environment in a comprehensive and intelligent manner.
Leading Regions, Countries, or Segments in Automotive 3D Map System
The Automotive 3D Map System market is currently experiencing dominant growth and adoption within Passenger Vehicles, driven by their sheer volume and the increasing integration of advanced driver-assistance systems (ADAS). This segment is projected to account for over sixty percent of the total market share by 2025, with an estimated market value of one hundred and twenty billion dollars. The demand for sophisticated in-dash navigation systems that offer enhanced user interfaces, real-time traffic data, and integration with vehicle infotainment systems is a primary driver. Furthermore, the increasing consumer expectation for seamless and intuitive navigation experiences, coupled with the growing adoption of semi-autonomous features, directly translates to a higher demand for the precision and depth offered by 3D maps.
- Dominant Segment: Passenger Vehicles, showcasing robust adoption rates and driving market expansion.
- Key Drivers in Passenger Vehicles:
- Increasing ADAS Penetration: The widespread integration of features like adaptive cruise control, lane keeping assist, and automated parking requires highly accurate 3D map data for optimal performance.
- Consumer Demand for Enhanced Infotainment: Advanced 3D maps contribute to a more engaging and user-friendly in-car experience, aligning with consumer preferences for sophisticated technology.
- Growth of Electric Vehicles (EVs): EVs often incorporate advanced navigation features for battery management, charging station identification, and optimized routing, further boosting 3D map adoption.
- Technological Advancements in In-dash Navigation: Continuous improvements in display technology, processing power, and user interface design make 3D navigation systems more appealing and functional.
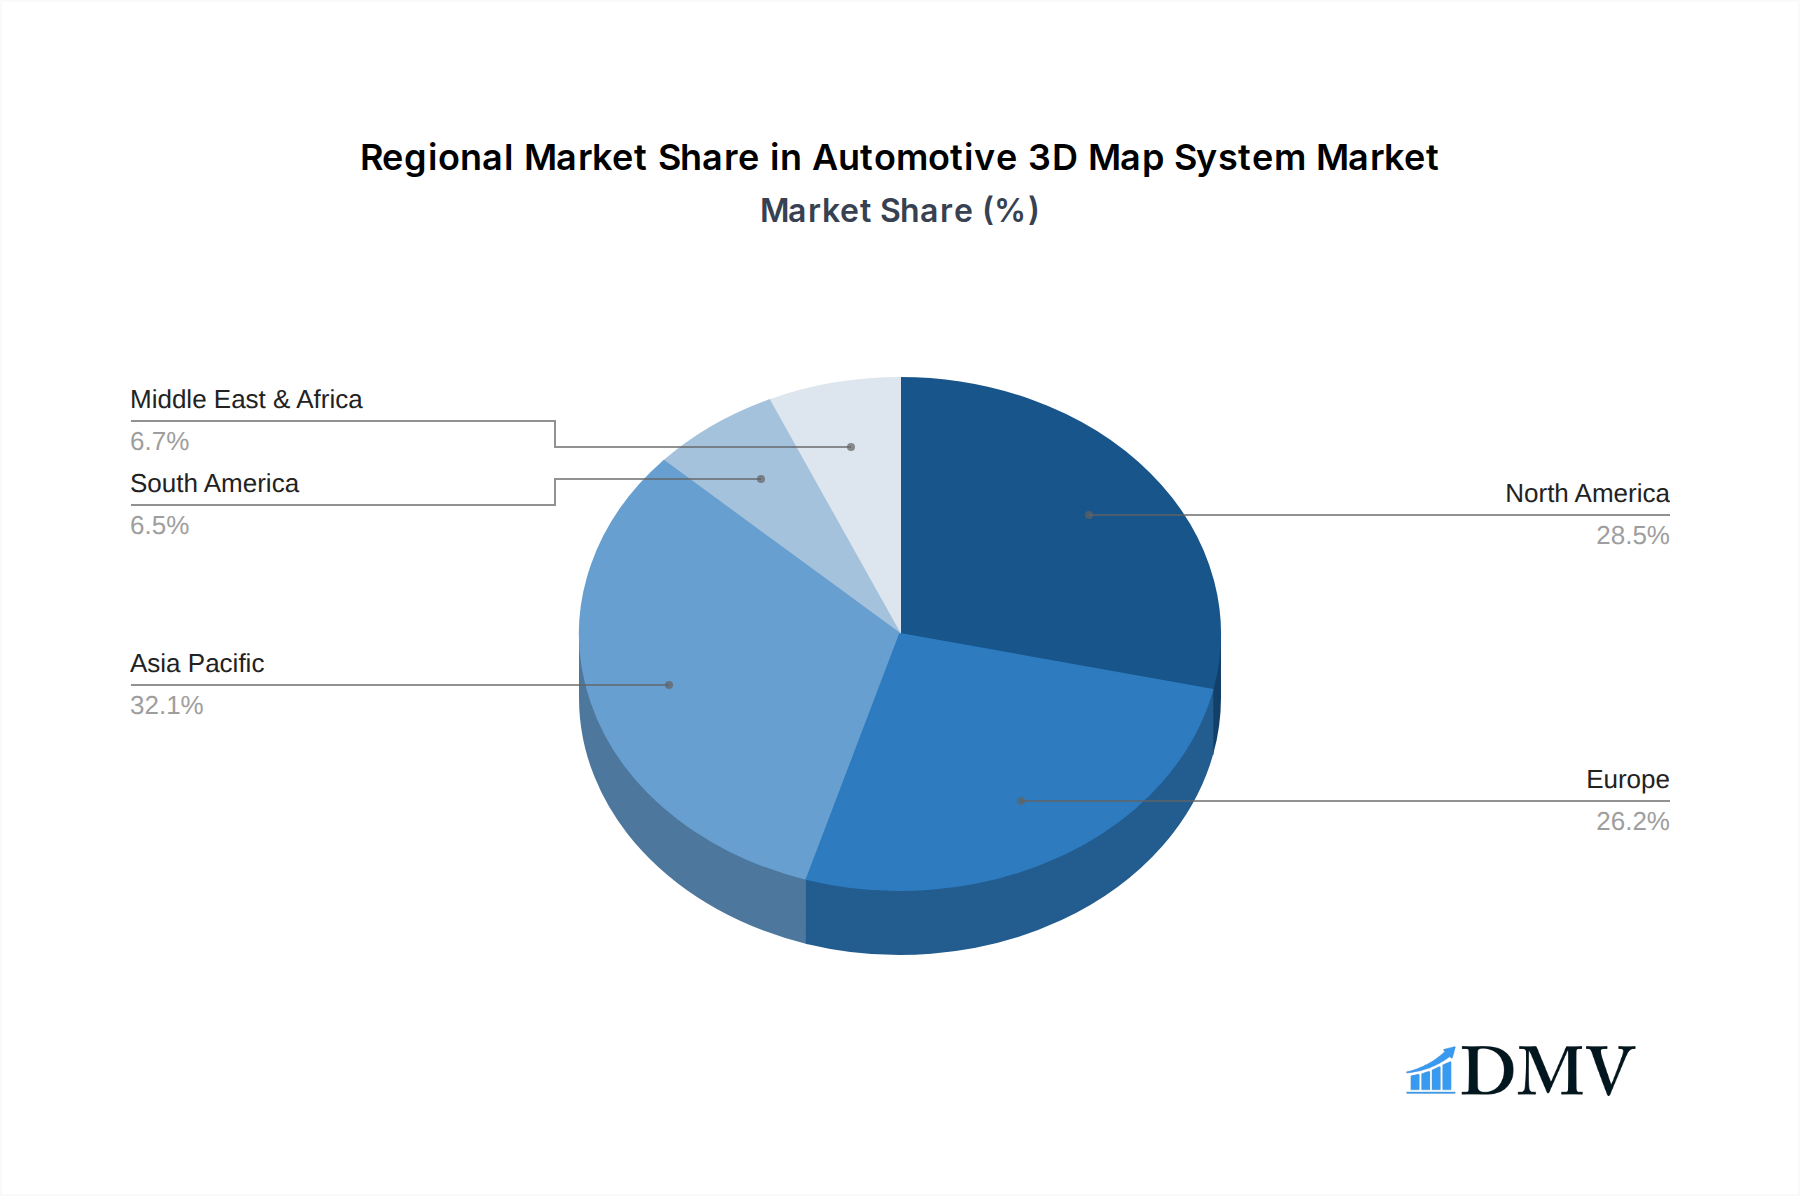
- Regional Dominance: North America and Europe are currently leading the adoption of advanced 3D mapping technologies in passenger vehicles, attributed to higher disposable incomes, greater consumer awareness of ADAS benefits, and stricter safety regulations. Asia-Pacific is rapidly catching up, driven by the immense growth in the automotive sector and the increasing demand for connected car features.
- Secondary Segments: While Passenger Vehicles lead, Light Commercial Vehicles are showing significant growth potential due to increasing demands for fleet management, route optimization, and driver safety. Heavy Duty Trucks and Buses and Coaches also represent a substantial, albeit niche, market where safety and efficiency are paramount. Off-road vehicles, while a smaller segment, are beginning to see applications for specialized 3D mapping that includes terrain and environmental data.
Automotive 3D Map System Product Innovations
Product innovations in the Automotive 3D Map System market are focused on enhancing accuracy, dynamism, and integration capabilities. Companies are developing sophisticated real-time map updates leveraging AI and machine learning to fuse data from various sources, including vehicle sensors and cloud platforms. This enables the creation of highly detailed dynamic maps that reflect current road conditions, traffic flow, and even temporary changes like construction zones. Advanced features include lane-level precision navigation, predictive routing based on historical data and real-time events, and enhanced visualization for augmented reality (AR) heads-up displays (HUDs). The performance metrics being pushed include centimeter-level accuracy, ultra-low latency for map updates, and seamless integration with vehicle control systems for advanced ADAS and autonomous driving functions.
Propelling Factors for Automotive 3D Map System Growth
The growth of the Automotive 3D Map System market is propelled by several key factors. The relentless pursuit of autonomous driving technologies necessitates highly precise and reliable HD maps. Advancements in sensor fusion and AI are enabling more accurate and dynamic map creation. Furthermore, the increasing connectivity of vehicles, leading to V2X (Vehicle-to-Everything) communication, facilitates real-time data exchange for continuous map refinement. Government initiatives promoting road safety and the development of smart city infrastructure also provide a fertile ground for the widespread adoption of sophisticated mapping solutions. The growing consumer demand for enhanced in-car navigation and integrated infotainment systems further fuels market expansion.
Obstacles in the Automotive 3D Map System Market
Despite its robust growth, the Automotive 3D Map System market faces several obstacles. The high cost of developing and maintaining accurate HD map data remains a significant barrier, especially for comprehensive global coverage. Data privacy and security concerns associated with collecting and processing vast amounts of location-based data need careful consideration and robust regulatory frameworks. Supply chain disruptions, particularly concerning specialized hardware components required for mapping and data processing, can impact production timelines. Intense competition among established players and emerging startups also necessitates continuous innovation and strategic pricing to maintain market share. The development of standardization for map data formats and APIs across different automotive manufacturers and mapping providers is also an ongoing challenge.
Future Opportunities in Automotive 3D Map System
Emerging opportunities in the Automotive 3D Map System market are vast and transformative. The expansion of autonomous driving to higher levels (L4/L5) will create an insatiable demand for even more granular and dynamic geospatial mapping. The integration of 3D maps with augmented reality interfaces for navigation and driver information presents a significant consumer engagement opportunity. The growth of ride-sharing and logistics services, which rely heavily on efficient routing and real-time tracking, will continue to drive adoption. Furthermore, the development of "digital twins" of urban environments for smart city planning and traffic management presents new avenues for automotive mapping data utilization. The exploration of new markets in developing regions as vehicle penetration increases also offers substantial growth potential.
Major Players in the Automotive 3D Map System Ecosystem
- Axestrack
- Civil Maps
- BAE Systems Plc
- Continental AG
- Aptiv PLC
- DENSO Corporation
- Dynamic Map Planning Co.,Ltd
- Elektrobit
- Mitsubishi Electric Corporation
- NVIDIA Corporation
- HERE
- HARMAN International
- TomTom International B.V.
- Robert Bosch GmbH
- V Tech GPS
- Nippon Seiki Co.,Ltd.
- Pioneer Corporation
- Collins Aerospace
Key Developments in Automotive 3D Map System Industry
- 2023/06: HERE Technologies announced its partnership with BMW Group to enhance HD map data for autonomous driving.
- 2023/09: NVIDIA Corporation unveiled its DRIVE Terra platform, enabling advanced 3D mapping and simulation for autonomous vehicles.
- 2023/11: Continental AG showcased its new generation of high-precision map data solutions for enhanced ADAS.
- 2024/01: Aptiv PLC demonstrated its progress in developing real-time, crowdsourced 3D mapping capabilities.
- 2024/03: Google Maps introduced enhanced 3D building and terrain data for improved navigation.
- 2024/05: Civil Maps secured significant funding to accelerate the development of its AI-powered 3D mapping platform.
- 2024/07: DENSO Corporation announced collaborations to integrate advanced mapping with in-vehicle sensors.
- 2024/09: TomTom International B.V. launched its new developer portal for accessing and utilizing their HD map data.
- 2024/11: Elektrobit announced its integration of advanced 3D mapping into its automotive software solutions.
Strategic Automotive 3D Map System Market Forecast
The strategic outlook for the Automotive 3D Map System market is exceptionally positive, driven by the accelerating pace of innovation in autonomous driving and connected vehicle technologies. The market is poised for substantial growth, fueled by the critical need for precise, real-time HD maps that underpin safety and performance in advanced driver-assistance systems and fully autonomous vehicles. Increased investment in R&D, coupled with strategic collaborations among technology providers, automakers, and mapping specialists, will continue to push the boundaries of what’s possible in in-vehicle navigation and spatial understanding. The expanding scope of applications, from enhanced driver experiences to sophisticated fleet management and urban mobility solutions, ensures a robust and sustained expansion trajectory for the global 3D automotive mapping sector over the forecast period.
Automotive 3D Map System Segmentation
-
1. Type
- 1.1. In-dash Navigation
- 1.2. Portable Navigation
-
2. Application
- 2.1. Passenger Vehicles
- 2.2. Light Commercial Vehicles
- 2.3. Heavy Duty Trucks
- 2.4. Buses and Coaches
- 2.5. Off-road Vehicles
Automotive 3D Map System Segmentation By Geography
-
1. North America
- 1.1. United States
- 1.2. Canada
- 1.3. Mexico
-
2. South America
- 2.1. Brazil
- 2.2. Argentina
- 2.3. Rest of South America
-
3. Europe
- 3.1. United Kingdom
- 3.2. Germany
- 3.3. France
- 3.4. Italy
- 3.5. Spain
- 3.6. Russia
- 3.7. Benelux
- 3.8. Nordics
- 3.9. Rest of Europe
-
4. Middle East & Africa
- 4.1. Turkey
- 4.2. Israel
- 4.3. GCC
- 4.4. North Africa
- 4.5. South Africa
- 4.6. Rest of Middle East & Africa
-
5. Asia Pacific
- 5.1. China
- 5.2. India
- 5.3. Japan
- 5.4. South Korea
- 5.5. ASEAN
- 5.6. Oceania
- 5.7. Rest of Asia Pacific
Automotive 3D Map System Regional Market Share
Geographic Coverage of Automotive 3D Map System
Automotive 3D Map System REPORT HIGHLIGHTS
| Aspects | Details |
|---|---|
| Study Period | 2020-2034 |
| Base Year | 2025 |
| Estimated Year | 2026 |
| Forecast Period | 2026-2034 |
| Historical Period | 2020-2025 |
| Growth Rate | CAGR of 9.9% from 2020-2034 |
| Segmentation |
|
Table of Contents
- 1. Introduction
- 1.1. Research Scope
- 1.2. Market Segmentation
- 1.3. Research Objective
- 1.4. Definitions and Assumptions
- 2. Executive Summary
- 2.1. Market Snapshot
- 3. Market Dynamics
- 3.1. Market Drivers
- 3.2. Market Restrains
- 3.3. Market Trends
- 3.4. Market Opportunities
- 4. Market Factor Analysis
- 4.1. Porters Five Forces
- 4.1.1. Bargaining Power of Suppliers
- 4.1.2. Bargaining Power of Buyers
- 4.1.3. Threat of New Entrants
- 4.1.4. Threat of Substitutes
- 4.1.5. Competitive Rivalry
- 4.2. PESTEL analysis
- 4.3. BCG Analysis
- 4.3.1. Stars (High Growth, High Market Share)
- 4.3.2. Cash Cows (Low Growth, High Market Share)
- 4.3.3. Question Mark (High Growth, Low Market Share)
- 4.3.4. Dogs (Low Growth, Low Market Share)
- 4.4. Ansoff Matrix Analysis
- 4.5. Supply Chain Analysis
- 4.6. Regulatory Landscape
- 4.7. Current Market Potential and Opportunity Assessment (TAM–SAM–SOM Framework)
- 4.8. DMV Analyst Note
- 4.1. Porters Five Forces
- 5. Market Analysis, Insights and Forecast 2021-2033
- 5.1. Market Analysis, Insights and Forecast - by Type
- 5.1.1. In-dash Navigation
- 5.1.2. Portable Navigation
- 5.2. Market Analysis, Insights and Forecast - by Application
- 5.2.1. Passenger Vehicles
- 5.2.2. Light Commercial Vehicles
- 5.2.3. Heavy Duty Trucks
- 5.2.4. Buses and Coaches
- 5.2.5. Off-road Vehicles
- 5.3. Market Analysis, Insights and Forecast - by Region
- 5.3.1. North America
- 5.3.2. South America
- 5.3.3. Europe
- 5.3.4. Middle East & Africa
- 5.3.5. Asia Pacific
- 5.1. Market Analysis, Insights and Forecast - by Type
- 6. Global Automotive 3D Map System Analysis, Insights and Forecast, 2021-2033
- 6.1. Market Analysis, Insights and Forecast - by Type
- 6.1.1. In-dash Navigation
- 6.1.2. Portable Navigation
- 6.2. Market Analysis, Insights and Forecast - by Application
- 6.2.1. Passenger Vehicles
- 6.2.2. Light Commercial Vehicles
- 6.2.3. Heavy Duty Trucks
- 6.2.4. Buses and Coaches
- 6.2.5. Off-road Vehicles
- 6.1. Market Analysis, Insights and Forecast - by Type
- 7. North America Automotive 3D Map System Analysis, Insights and Forecast, 2020-2032
- 7.1. Market Analysis, Insights and Forecast - by Type
- 7.1.1. In-dash Navigation
- 7.1.2. Portable Navigation
- 7.2. Market Analysis, Insights and Forecast - by Application
- 7.2.1. Passenger Vehicles
- 7.2.2. Light Commercial Vehicles
- 7.2.3. Heavy Duty Trucks
- 7.2.4. Buses and Coaches
- 7.2.5. Off-road Vehicles
- 7.1. Market Analysis, Insights and Forecast - by Type
- 8. South America Automotive 3D Map System Analysis, Insights and Forecast, 2020-2032
- 8.1. Market Analysis, Insights and Forecast - by Type
- 8.1.1. In-dash Navigation
- 8.1.2. Portable Navigation
- 8.2. Market Analysis, Insights and Forecast - by Application
- 8.2.1. Passenger Vehicles
- 8.2.2. Light Commercial Vehicles
- 8.2.3. Heavy Duty Trucks
- 8.2.4. Buses and Coaches
- 8.2.5. Off-road Vehicles
- 8.1. Market Analysis, Insights and Forecast - by Type
- 9. Europe Automotive 3D Map System Analysis, Insights and Forecast, 2020-2032
- 9.1. Market Analysis, Insights and Forecast - by Type
- 9.1.1. In-dash Navigation
- 9.1.2. Portable Navigation
- 9.2. Market Analysis, Insights and Forecast - by Application
- 9.2.1. Passenger Vehicles
- 9.2.2. Light Commercial Vehicles
- 9.2.3. Heavy Duty Trucks
- 9.2.4. Buses and Coaches
- 9.2.5. Off-road Vehicles
- 9.1. Market Analysis, Insights and Forecast - by Type
- 10. Middle East & Africa Automotive 3D Map System Analysis, Insights and Forecast, 2020-2032
- 10.1. Market Analysis, Insights and Forecast - by Type
- 10.1.1. In-dash Navigation
- 10.1.2. Portable Navigation
- 10.2. Market Analysis, Insights and Forecast - by Application
- 10.2.1. Passenger Vehicles
- 10.2.2. Light Commercial Vehicles
- 10.2.3. Heavy Duty Trucks
- 10.2.4. Buses and Coaches
- 10.2.5. Off-road Vehicles
- 10.1. Market Analysis, Insights and Forecast - by Type
- 11. Asia Pacific Automotive 3D Map System Analysis, Insights and Forecast, 2020-2032
- 11.1. Market Analysis, Insights and Forecast - by Type
- 11.1.1. In-dash Navigation
- 11.1.2. Portable Navigation
- 11.2. Market Analysis, Insights and Forecast - by Application
- 11.2.1. Passenger Vehicles
- 11.2.2. Light Commercial Vehicles
- 11.2.3. Heavy Duty Trucks
- 11.2.4. Buses and Coaches
- 11.2.5. Off-road Vehicles
- 11.1. Market Analysis, Insights and Forecast - by Type
- 12. Competitive Analysis
- 12.1. Company Profiles
- 12.1.1 Axestrack
- 12.1.1.1. Company Overview
- 12.1.1.2. Products
- 12.1.1.3. Company Financials
- 12.1.1.4. SWOT Analysis
- 12.1.2 Civil Maps
- 12.1.2.1. Company Overview
- 12.1.2.2. Products
- 12.1.2.3. Company Financials
- 12.1.2.4. SWOT Analysis
- 12.1.3 BAE Systems Plc
- 12.1.3.1. Company Overview
- 12.1.3.2. Products
- 12.1.3.3. Company Financials
- 12.1.3.4. SWOT Analysis
- 12.1.4 Continental AG
- 12.1.4.1. Company Overview
- 12.1.4.2. Products
- 12.1.4.3. Company Financials
- 12.1.4.4. SWOT Analysis
- 12.1.5 Aptiv PLC
- 12.1.5.1. Company Overview
- 12.1.5.2. Products
- 12.1.5.3. Company Financials
- 12.1.5.4. SWOT Analysis
- 12.1.6 DENSO Corporation
- 12.1.6.1. Company Overview
- 12.1.6.2. Products
- 12.1.6.3. Company Financials
- 12.1.6.4. SWOT Analysis
- 12.1.7 Dynamic Map Planning Co.
- 12.1.7.1. Company Overview
- 12.1.7.2. Products
- 12.1.7.3. Company Financials
- 12.1.7.4. SWOT Analysis
- 12.1.8 Ltd
- 12.1.8.1. Company Overview
- 12.1.8.2. Products
- 12.1.8.3. Company Financials
- 12.1.8.4. SWOT Analysis
- 12.1.9 Elektrobit
- 12.1.9.1. Company Overview
- 12.1.9.2. Products
- 12.1.9.3. Company Financials
- 12.1.9.4. SWOT Analysis
- 12.1.10 Google
- 12.1.10.1. Company Overview
- 12.1.10.2. Products
- 12.1.10.3. Company Financials
- 12.1.10.4. SWOT Analysis
- 12.1.11 Mitsubishi Electric Corporation
- 12.1.11.1. Company Overview
- 12.1.11.2. Products
- 12.1.11.3. Company Financials
- 12.1.11.4. SWOT Analysis
- 12.1.12 NVIDIA Corporation
- 12.1.12.1. Company Overview
- 12.1.12.2. Products
- 12.1.12.3. Company Financials
- 12.1.12.4. SWOT Analysis
- 12.1.13 HERE
- 12.1.13.1. Company Overview
- 12.1.13.2. Products
- 12.1.13.3. Company Financials
- 12.1.13.4. SWOT Analysis
- 12.1.14 HARMAN International
- 12.1.14.1. Company Overview
- 12.1.14.2. Products
- 12.1.14.3. Company Financials
- 12.1.14.4. SWOT Analysis
- 12.1.15 TomTom International B.V.
- 12.1.15.1. Company Overview
- 12.1.15.2. Products
- 12.1.15.3. Company Financials
- 12.1.15.4. SWOT Analysis
- 12.1.16 Robert Bosch GmbH
- 12.1.16.1. Company Overview
- 12.1.16.2. Products
- 12.1.16.3. Company Financials
- 12.1.16.4. SWOT Analysis
- 12.1.17 V Tech GPS
- 12.1.17.1. Company Overview
- 12.1.17.2. Products
- 12.1.17.3. Company Financials
- 12.1.17.4. SWOT Analysis
- 12.1.18 Nippon Seiki Co.
- 12.1.18.1. Company Overview
- 12.1.18.2. Products
- 12.1.18.3. Company Financials
- 12.1.18.4. SWOT Analysis
- 12.1.19 Ltd.
- 12.1.19.1. Company Overview
- 12.1.19.2. Products
- 12.1.19.3. Company Financials
- 12.1.19.4. SWOT Analysis
- 12.1.20 Pioneer Corporation
- 12.1.20.1. Company Overview
- 12.1.20.2. Products
- 12.1.20.3. Company Financials
- 12.1.20.4. SWOT Analysis
- 12.1.21 Collins Aerospace
- 12.1.21.1. Company Overview
- 12.1.21.2. Products
- 12.1.21.3. Company Financials
- 12.1.21.4. SWOT Analysis
- 12.1.1 Axestrack
- 12.2. Market Entropy
- 12.2.1 Company's Key Areas Served
- 12.2.2 Recent Developments
- 12.3. Company Market Share Analysis 2025
- 12.3.1 Top 5 Companies Market Share Analysis
- 12.3.2 Top 3 Companies Market Share Analysis
- 12.4. List of Potential Customers
- 13. Research Methodology
List of Figures
- Figure 1: Global Automotive 3D Map System Revenue Breakdown (undefined, %) by Region 2025 & 2033
- Figure 2: North America Automotive 3D Map System Revenue (undefined), by Type 2025 & 2033
- Figure 3: North America Automotive 3D Map System Revenue Share (%), by Type 2025 & 2033
- Figure 4: North America Automotive 3D Map System Revenue (undefined), by Application 2025 & 2033
- Figure 5: North America Automotive 3D Map System Revenue Share (%), by Application 2025 & 2033
- Figure 6: North America Automotive 3D Map System Revenue (undefined), by Country 2025 & 2033
- Figure 7: North America Automotive 3D Map System Revenue Share (%), by Country 2025 & 2033
- Figure 8: South America Automotive 3D Map System Revenue (undefined), by Type 2025 & 2033
- Figure 9: South America Automotive 3D Map System Revenue Share (%), by Type 2025 & 2033
- Figure 10: South America Automotive 3D Map System Revenue (undefined), by Application 2025 & 2033
- Figure 11: South America Automotive 3D Map System Revenue Share (%), by Application 2025 & 2033
- Figure 12: South America Automotive 3D Map System Revenue (undefined), by Country 2025 & 2033
- Figure 13: South America Automotive 3D Map System Revenue Share (%), by Country 2025 & 2033
- Figure 14: Europe Automotive 3D Map System Revenue (undefined), by Type 2025 & 2033
- Figure 15: Europe Automotive 3D Map System Revenue Share (%), by Type 2025 & 2033
- Figure 16: Europe Automotive 3D Map System Revenue (undefined), by Application 2025 & 2033
- Figure 17: Europe Automotive 3D Map System Revenue Share (%), by Application 2025 & 2033
- Figure 18: Europe Automotive 3D Map System Revenue (undefined), by Country 2025 & 2033
- Figure 19: Europe Automotive 3D Map System Revenue Share (%), by Country 2025 & 2033
- Figure 20: Middle East & Africa Automotive 3D Map System Revenue (undefined), by Type 2025 & 2033
- Figure 21: Middle East & Africa Automotive 3D Map System Revenue Share (%), by Type 2025 & 2033
- Figure 22: Middle East & Africa Automotive 3D Map System Revenue (undefined), by Application 2025 & 2033
- Figure 23: Middle East & Africa Automotive 3D Map System Revenue Share (%), by Application 2025 & 2033
- Figure 24: Middle East & Africa Automotive 3D Map System Revenue (undefined), by Country 2025 & 2033
- Figure 25: Middle East & Africa Automotive 3D Map System Revenue Share (%), by Country 2025 & 2033
- Figure 26: Asia Pacific Automotive 3D Map System Revenue (undefined), by Type 2025 & 2033
- Figure 27: Asia Pacific Automotive 3D Map System Revenue Share (%), by Type 2025 & 2033
- Figure 28: Asia Pacific Automotive 3D Map System Revenue (undefined), by Application 2025 & 2033
- Figure 29: Asia Pacific Automotive 3D Map System Revenue Share (%), by Application 2025 & 2033
- Figure 30: Asia Pacific Automotive 3D Map System Revenue (undefined), by Country 2025 & 2033
- Figure 31: Asia Pacific Automotive 3D Map System Revenue Share (%), by Country 2025 & 2033
List of Tables
- Table 1: Global Automotive 3D Map System Revenue undefined Forecast, by Type 2020 & 2033
- Table 2: Global Automotive 3D Map System Revenue undefined Forecast, by Application 2020 & 2033
- Table 3: Global Automotive 3D Map System Revenue undefined Forecast, by Region 2020 & 2033
- Table 4: Global Automotive 3D Map System Revenue undefined Forecast, by Type 2020 & 2033
- Table 5: Global Automotive 3D Map System Revenue undefined Forecast, by Application 2020 & 2033
- Table 6: Global Automotive 3D Map System Revenue undefined Forecast, by Country 2020 & 2033
- Table 7: United States Automotive 3D Map System Revenue (undefined) Forecast, by Application 2020 & 2033
- Table 8: Canada Automotive 3D Map System Revenue (undefined) Forecast, by Application 2020 & 2033
- Table 9: Mexico Automotive 3D Map System Revenue (undefined) Forecast, by Application 2020 & 2033
- Table 10: Global Automotive 3D Map System Revenue undefined Forecast, by Type 2020 & 2033
- Table 11: Global Automotive 3D Map System Revenue undefined Forecast, by Application 2020 & 2033
- Table 12: Global Automotive 3D Map System Revenue undefined Forecast, by Country 2020 & 2033
- Table 13: Brazil Automotive 3D Map System Revenue (undefined) Forecast, by Application 2020 & 2033
- Table 14: Argentina Automotive 3D Map System Revenue (undefined) Forecast, by Application 2020 & 2033
- Table 15: Rest of South America Automotive 3D Map System Revenue (undefined) Forecast, by Application 2020 & 2033
- Table 16: Global Automotive 3D Map System Revenue undefined Forecast, by Type 2020 & 2033
- Table 17: Global Automotive 3D Map System Revenue undefined Forecast, by Application 2020 & 2033
- Table 18: Global Automotive 3D Map System Revenue undefined Forecast, by Country 2020 & 2033
- Table 19: United Kingdom Automotive 3D Map System Revenue (undefined) Forecast, by Application 2020 & 2033
- Table 20: Germany Automotive 3D Map System Revenue (undefined) Forecast, by Application 2020 & 2033
- Table 21: France Automotive 3D Map System Revenue (undefined) Forecast, by Application 2020 & 2033
- Table 22: Italy Automotive 3D Map System Revenue (undefined) Forecast, by Application 2020 & 2033
- Table 23: Spain Automotive 3D Map System Revenue (undefined) Forecast, by Application 2020 & 2033
- Table 24: Russia Automotive 3D Map System Revenue (undefined) Forecast, by Application 2020 & 2033
- Table 25: Benelux Automotive 3D Map System Revenue (undefined) Forecast, by Application 2020 & 2033
- Table 26: Nordics Automotive 3D Map System Revenue (undefined) Forecast, by Application 2020 & 2033
- Table 27: Rest of Europe Automotive 3D Map System Revenue (undefined) Forecast, by Application 2020 & 2033
- Table 28: Global Automotive 3D Map System Revenue undefined Forecast, by Type 2020 & 2033
- Table 29: Global Automotive 3D Map System Revenue undefined Forecast, by Application 2020 & 2033
- Table 30: Global Automotive 3D Map System Revenue undefined Forecast, by Country 2020 & 2033
- Table 31: Turkey Automotive 3D Map System Revenue (undefined) Forecast, by Application 2020 & 2033
- Table 32: Israel Automotive 3D Map System Revenue (undefined) Forecast, by Application 2020 & 2033
- Table 33: GCC Automotive 3D Map System Revenue (undefined) Forecast, by Application 2020 & 2033
- Table 34: North Africa Automotive 3D Map System Revenue (undefined) Forecast, by Application 2020 & 2033
- Table 35: South Africa Automotive 3D Map System Revenue (undefined) Forecast, by Application 2020 & 2033
- Table 36: Rest of Middle East & Africa Automotive 3D Map System Revenue (undefined) Forecast, by Application 2020 & 2033
- Table 37: Global Automotive 3D Map System Revenue undefined Forecast, by Type 2020 & 2033
- Table 38: Global Automotive 3D Map System Revenue undefined Forecast, by Application 2020 & 2033
- Table 39: Global Automotive 3D Map System Revenue undefined Forecast, by Country 2020 & 2033
- Table 40: China Automotive 3D Map System Revenue (undefined) Forecast, by Application 2020 & 2033
- Table 41: India Automotive 3D Map System Revenue (undefined) Forecast, by Application 2020 & 2033
- Table 42: Japan Automotive 3D Map System Revenue (undefined) Forecast, by Application 2020 & 2033
- Table 43: South Korea Automotive 3D Map System Revenue (undefined) Forecast, by Application 2020 & 2033
- Table 44: ASEAN Automotive 3D Map System Revenue (undefined) Forecast, by Application 2020 & 2033
- Table 45: Oceania Automotive 3D Map System Revenue (undefined) Forecast, by Application 2020 & 2033
- Table 46: Rest of Asia Pacific Automotive 3D Map System Revenue (undefined) Forecast, by Application 2020 & 2033
Frequently Asked Questions
1. What is the projected Compound Annual Growth Rate (CAGR) of the Automotive 3D Map System?
The projected CAGR is approximately 9.9%.
2. Which companies are prominent players in the Automotive 3D Map System?
Key companies in the market include Axestrack, Civil Maps, BAE Systems Plc, Continental AG, Aptiv PLC, DENSO Corporation, Dynamic Map Planning Co., Ltd, Elektrobit, Google, Mitsubishi Electric Corporation, NVIDIA Corporation, HERE, HARMAN International, TomTom International B.V., Robert Bosch GmbH, V Tech GPS, Nippon Seiki Co., Ltd., Pioneer Corporation, Collins Aerospace.
3. What are the main segments of the Automotive 3D Map System?
The market segments include Type, Application.
4. Can you provide details about the market size?
The market size is estimated to be USD XXX N/A as of 2022.
5. What are some drivers contributing to market growth?
N/A
6. What are the notable trends driving market growth?
N/A
7. Are there any restraints impacting market growth?
N/A
8. Can you provide examples of recent developments in the market?
N/A
9. What pricing options are available for accessing the report?
Pricing options include single-user, multi-user, and enterprise licenses priced at USD 4900.00, USD 7350.00, and USD 9800.00 respectively.
10. Is the market size provided in terms of value or volume?
The market size is provided in terms of value, measured in N/A.
11. Are there any specific market keywords associated with the report?
Yes, the market keyword associated with the report is "Automotive 3D Map System," which aids in identifying and referencing the specific market segment covered.
12. How do I determine which pricing option suits my needs best?
The pricing options vary based on user requirements and access needs. Individual users may opt for single-user licenses, while businesses requiring broader access may choose multi-user or enterprise licenses for cost-effective access to the report.
13. Are there any additional resources or data provided in the Automotive 3D Map System report?
While the report offers comprehensive insights, it's advisable to review the specific contents or supplementary materials provided to ascertain if additional resources or data are available.
14. How can I stay updated on further developments or reports in the Automotive 3D Map System?
To stay informed about further developments, trends, and reports in the Automotive 3D Map System, consider subscribing to industry newsletters, following relevant companies and organizations, or regularly checking reputable industry news sources and publications.
Methodology
Step 1 - Identification of Relevant Samples Size from Population Database


Step 2 - Approaches for Defining Global Market Size (Value, Volume* & Price*)

Note*: In applicable scenarios
Step 3 - Data Sources
Primary Research
- Web Analytics
- Survey Reports
- Research Institute
- Latest Research Reports
- Opinion Leaders
Secondary Research
- Annual Reports
- White Paper
- Latest Press Release
- Industry Association
- Paid Database
- Investor Presentations

Step 4 - Data Triangulation
Involves using different sources of information in order to increase the validity of a study
These sources are likely to be stakeholders in a program - participants, other researchers, program staff, other community members, and so on.
Then we put all data in single framework & apply various statistical tools to find out the dynamic on the market.
During the analysis stage, feedback from the stakeholder groups would be compared to determine areas of agreement as well as areas of divergence