

Key Insights
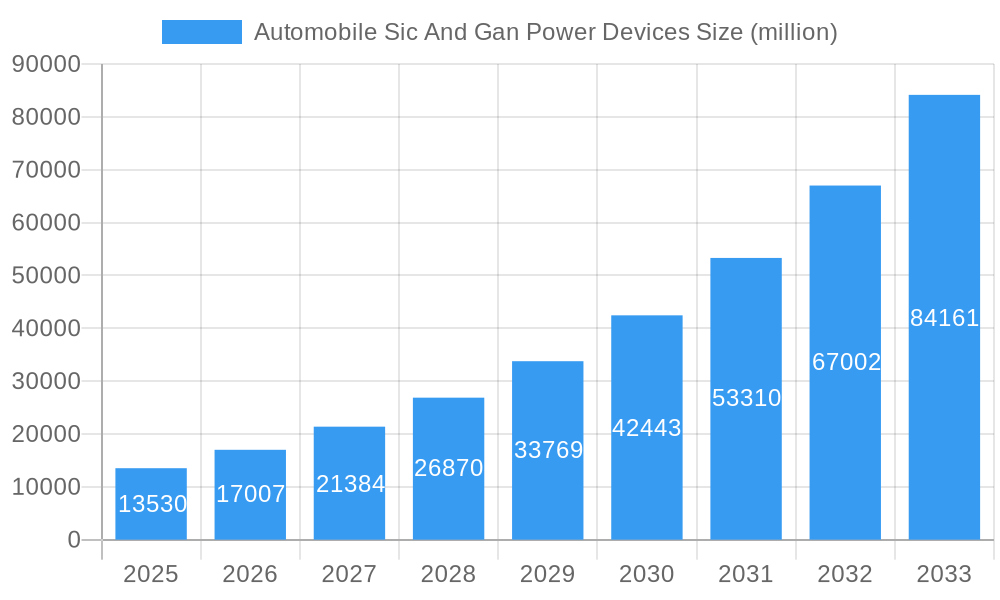
The automobile Silicon Carbide (SiC) and Gallium Nitride (GaN) power devices market is poised for explosive growth, driven by the accelerating electrification of vehicles. With a current market size estimated at $13530 million in 2025, the industry is projected to expand at an impressive Compound Annual Growth Rate (CAGR) of 25.6% over the forecast period of 2025-2033. This remarkable expansion is primarily fueled by the inherent advantages of SiC and GaN devices, such as higher efficiency, superior thermal performance, and smaller form factors, which are critical for electric vehicle (EV) components. The increasing demand for longer EV driving ranges, faster charging capabilities, and more compact and lightweight power electronics is directly translating into a surge in adoption of these advanced semiconductor technologies. Key applications like main inverters, EV on-board chargers, and DC/DC converters are experiencing significant innovation and demand, pushing the boundaries of what's possible in automotive power management.
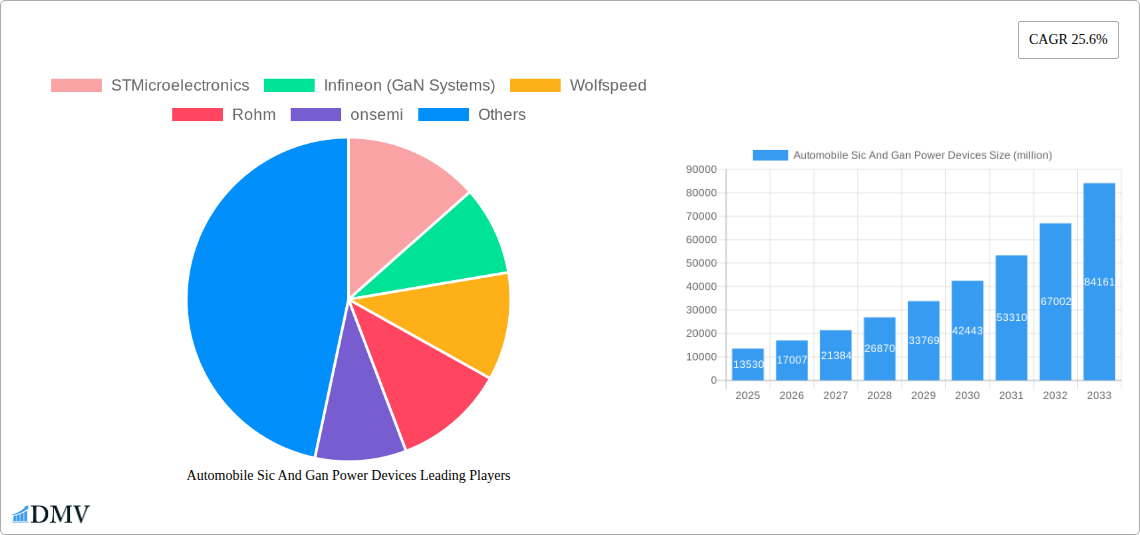
Automobile Sic And Gan Power Devices Market Size (In Billion)
The market dynamics are further shaped by a robust ecosystem of leading semiconductor manufacturers and automotive component suppliers, including giants like STMicroelectronics, Infineon (GaN Systems), Wolfspeed, and Rohm, alongside emerging players. These companies are heavily investing in research and development to enhance device performance and reduce manufacturing costs, thereby accelerating market penetration. Emerging trends indicate a shift towards higher voltage SiC and GaN devices to support advanced EV architectures and faster charging infrastructure. While the growth trajectory is overwhelmingly positive, potential restraints might include the initial higher cost of SiC and GaN components compared to traditional silicon-based devices, as well as the need for continued advancements in manufacturing processes to meet the scale and cost targets of mass-market automotive production. However, the clear benefits in terms of energy savings and performance are expected to outweigh these challenges, solidifying the dominance of SiC and GaN in the future of automotive power electronics.
Automobile Sic And Gan Power Devices Company Market Share
This comprehensive report delves into the dynamic Automobile SiC and GaN Power Devices Market, a critical sector propelling the electric vehicle (EV) revolution. With a detailed study period spanning from 2019 to 2033, encompassing a base year of 2025 and a forecast period of 2025–2033, this analysis provides unparalleled insights into market composition, industry evolution, regional dominance, product innovations, growth drivers, obstacles, future opportunities, and the key players shaping this transformative landscape. Discover market-driving trends, technological advancements, and strategic forecasts essential for stakeholders seeking to capitalize on the burgeoning demand for high-performance SiC power devices and GaN power devices in automotive applications.
Automobile SiC and GaN Power Devices Market Composition & Trends
The Automobile SiC and GaN Power Devices Market exhibits a moderate to high concentration, with leading players like STMicroelectronics, Infineon (GaN Systems), and Wolfspeed commanding significant market share. Innovation remains a primary catalyst, driven by the relentless pursuit of higher efficiency, reduced energy loss, and enhanced thermal management in electric powertrains. Regulatory landscapes, particularly stringent emissions standards and government incentives for EV adoption, are further accelerating market penetration. Substitute products, primarily traditional silicon-based power devices, are progressively being displaced due to the superior performance characteristics of SiC power devices and GaN power devices. End-user profiles are dominated by major Original Equipment Manufacturers (OEMs) in the automotive sector, who are increasingly integrating these advanced technologies into their EV main inverters, EV on-board chargers, and DC/DC converters. Merger and acquisition (M&A) activities are expected to continue as companies seek to secure intellectual property, expand manufacturing capabilities, and gain a competitive edge. M&A deal values are projected to reach several million in the coming years, reflecting the strategic importance of this segment.
- Market Share Distribution: Leading players hold an estimated 60% market share, with smaller and emerging companies filling the remaining segments.
- Innovation Catalysts: Focus on reducing switching losses, improving power density, and enhancing reliability under extreme automotive conditions.
- Regulatory Landscape: Government mandates for fleet electrification and stricter emissions regulations are primary drivers.
- Substitute Products: Declining market share for traditional silicon IGBTs and MOSFETs.
- End-User Profiles: Primarily EV manufacturers, Tier-1 automotive suppliers, and research and development divisions.
- M&A Activities: Strategic acquisitions to gain access to advanced materials, manufacturing processes, and established supply chains.
Automobile SiC and GaN Power Devices Industry Evolution
The evolution of the Automobile SiC and GaN Power Devices Market has been marked by a dramatic upward trajectory, driven by the transformative potential of wide-bandgap semiconductor technologies in electric vehicles. Over the historical period (2019–2024), we witnessed significant initial investments and the gradual adoption of SiC power devices, primarily in high-end EVs, to improve range, charging speed, and overall system efficiency. The base year of 2025 represents a pivotal moment, with SiC power devices becoming increasingly mainstream, while GaN power devices are gaining traction, particularly in applications demanding extremely high switching frequencies and compact designs. The forecast period (2025–2033) is poised for exponential growth, with market expansion estimated at a Compound Annual Growth Rate (CAGR) of over 25%. This remarkable growth is fueled by advancements in manufacturing yields, decreasing component costs, and a growing understanding of the long-term benefits of these technologies, including reduced warranty claims and improved vehicle performance.
Technological advancements have been at the forefront of this evolution. The development of higher voltage-rated SiC MOSFETs and Schottky diodes has enabled more efficient power conversion in main inverters and DC/DC converters. Similarly, the progression of GaN HEMTs and integrated power stages has opened new possibilities for compact and lightweight EV on-board chargers. Consumer demand for longer driving ranges, faster charging capabilities, and more sustainable transportation solutions directly translates into a greater need for the superior power density and efficiency offered by SiC and GaN. The industry is moving from niche applications to widespread integration across all EV segments, from luxury sedans to commercial vehicles. The increasing reliability and robustness of these devices, overcoming earlier concerns about long-term performance in harsh automotive environments, have been crucial in solidifying their market position.
- Market Growth Trajectories: Projected CAGR exceeding 25% from 2025 to 2033.
- Technological Advancements: Continuous improvements in wafer quality, device architecture, and packaging for SiC and GaN.
- Shifting Consumer Demands: Growing consumer preference for EVs with extended range, rapid charging, and enhanced performance.
- Adoption Metrics: Expected increase in SiC content per EV from an average of several hundred dollars in 2025 to over one thousand dollars by 2033.
- Industry Investments: Significant capital expenditure in R&D and manufacturing capacity by major players is a key indicator of future growth.
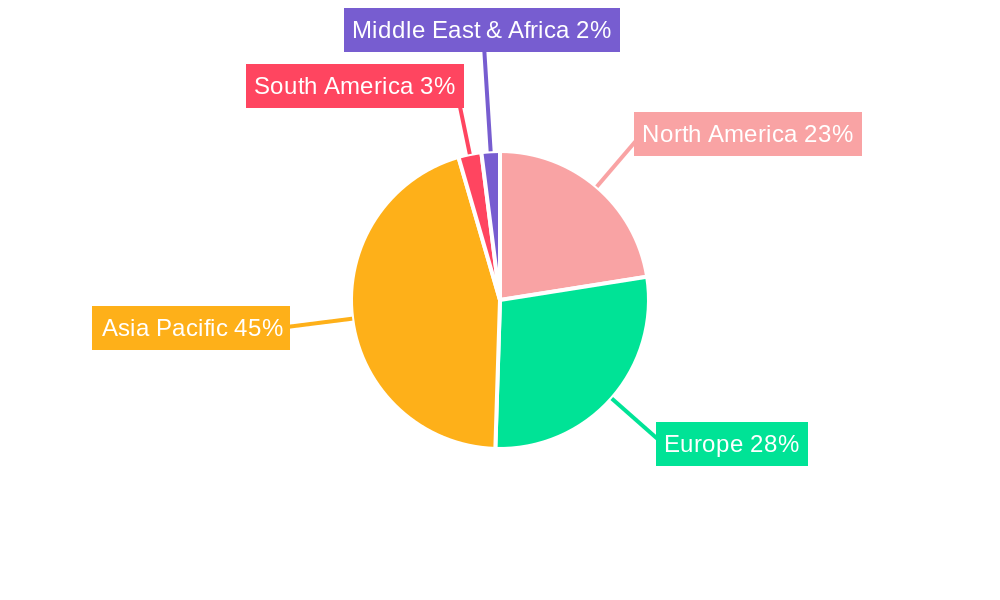
Leading Regions, Countries, or Segments in Automobile SiC and GaN Power Devices
The Automobile SiC and GaN Power Devices Market is experiencing significant regional dominance, with Asia-Pacific, particularly China, emerging as a powerhouse. This leadership is attributed to a confluence of factors, including robust government support for EV manufacturing, substantial investments in domestic semiconductor production, and the sheer scale of its automotive market. China’s ambitious electrification goals and its role as a global hub for EV production directly translate into immense demand for SiC power devices and GaN power devices. The region is a leading consumer and increasingly a significant producer of these advanced components, fostering a competitive ecosystem that drives innovation and cost reduction.
Within the application segments, the Main Inverter application stands out as the largest and fastest-growing. This is driven by the critical role of the inverter in managing power flow between the battery, motor, and other vehicle systems. The demand for higher efficiency and power density in main inverters directly fuels the adoption of SiC and GaN technologies. EV On-Board Chargers represent another significant and rapidly expanding segment, as the need for faster and more efficient charging solutions becomes paramount for consumer acceptance of electric vehicles. DC/DC Converters, essential for managing voltage levels within the EV, also contribute substantially to market growth, benefiting from the efficiency gains offered by wide-bandgap semiconductors. The "Others" category, encompassing applications like traction motors, auxiliary power units, and battery management systems, showcases the pervasive influence of SiC and GaN across the entire EV architecture.
Key Drivers of Dominance in Asia-Pacific (particularly China):
- Government Incentives & Policy Support: Aggressive targets for EV adoption and substantial subsidies for manufacturers and consumers.
- Large and Growing EV Market: China is the world's largest market for electric vehicles, creating unparalleled demand.
- Domestic Semiconductor Industry Growth: Significant investments in SiC and GaN wafer manufacturing and device fabrication.
- Competitive Pricing: Localized production and intense competition are driving down component costs.
- Supply Chain Integration: Development of end-to-end supply chains for SiC and GaN devices within the region.
Dominant Segments:
- Application:
- Main Inverter: Highest market share due to critical power conversion needs in EVs.
- EV On-Board Chargers: Rapid growth driven by the demand for faster charging solutions.
- DC/DC Converter: Essential for voltage regulation and system efficiency.
- Others: Emerging applications in various EV subsystems.
- Type:
- SiC Power Devices: Currently dominant due to established maturity and wider adoption in higher voltage applications.
- GaN Power Devices: Experiencing rapid growth, particularly in applications requiring very high switching frequencies and smaller form factors.
Automobile SiC and GaN Power Devices Product Innovations
Product innovations in Automobile SiC and GaN Power Devices are revolutionizing electric vehicle performance. Manufacturers are introducing higher voltage and current rated SiC MOSFETs and diodes, enabling more efficient power conversion in main inverters and DC/DC converters, leading to extended EV range. GaN HEMTs are enabling smaller, lighter, and more efficient on-board chargers and DC-DC converters by operating at significantly higher frequencies than traditional silicon devices. Innovations in packaging technologies are also critical, focusing on improved thermal management, reduced parasitic inductances, and enhanced reliability for demanding automotive environments. For instance, advancements in trench MOSFET designs for SiC and the development of integrated power modules for GaN are pushing the boundaries of power density and system integration, offering unique selling propositions through enhanced efficiency, reduced component count, and improved overall system cost-effectiveness.
Propelling Factors for Automobile SiC and GaN Power Devices Growth
Several key factors are propelling the growth of the Automobile SiC and GaN Power Devices Market. The unwavering global push towards decarbonization and stringent government regulations on vehicle emissions are the primary catalysts. The increasing consumer demand for longer driving ranges, faster charging times, and more efficient electric vehicles directly translates into a higher adoption rate for SiC power devices and GaN power devices, which offer superior efficiency and power density compared to traditional silicon. Furthermore, continuous technological advancements, leading to improved manufacturing yields, reduced production costs, and enhanced reliability of wide-bandgap semiconductors, are making these components more accessible and attractive to automotive OEMs. The growing availability of a comprehensive supply chain and ecosystem, encompassing material suppliers, device manufacturers, and system integrators, is also a significant growth enabler.
Obstacles in the Automobile SiC and GaN Power Devices Market
Despite the robust growth, the Automobile SiC and GaN Power Devices Market faces certain obstacles. The relatively higher cost of SiC and GaN wafers and fabrication processes compared to silicon continues to be a barrier, although this gap is narrowing. Supply chain vulnerabilities, including the availability of raw materials like silicon carbide and the limited number of high-volume manufacturing facilities for both SiC and GaN, can lead to production bottlenecks and price fluctuations. Stringent automotive qualification and reliability testing standards require significant time and investment for new wide-bandgap components. Intense competitive pressures among established players and emerging manufacturers also necessitate continuous innovation and cost optimization. The projected impact of these obstacles could lead to a 5-10% slower adoption rate in cost-sensitive segments if not adequately addressed.
Future Opportunities in Automobile SiC and GaN Power Devices
The future opportunities within the Automobile SiC and GaN Power Devices Market are vast and promising. The increasing penetration of electric vehicles across all automotive segments, including commercial vehicles and heavy-duty trucks, presents a significant expansion opportunity. The development of next-generation battery chemistries and higher voltage architectures (e.g., 800V and beyond) will further necessitate the use of high-performance SiC and GaN devices for optimal efficiency and power handling. Emerging applications such as electric aircraft propulsion systems and advanced driver-assistance systems (ADAS) requiring high-power, compact solutions also represent new avenues for growth. Furthermore, the integration of advanced functionalities, such as bidirectional charging capabilities and sophisticated thermal management systems leveraging GaN's high-frequency switching, will unlock new product categories and revenue streams.
Major Players in the Automobile SiC and GaN Power Devices Ecosystem
- STMicroelectronics
- Infineon (GaN Systems)
- Wolfspeed
- Rohm
- onsemi
- NXP
- Innoscience
- BYD Semiconductor
- Microchip (Microsemi)
- Mitsubishi Electric (Vincotech)
- Semikron Danfoss
- Fuji Electric
- Toshiba
- Bosch
- San'an Optoelectronics
- Littelfuse (IXYS)
- CETC 55
- WeEn Semiconductors
- BASiC Semiconductor
- SemiQ
- Diodes Incorporated
- SanRex
- Alpha & Omega Semiconductor
- United Nova Technology
- KEC Corporation
- PANJIT Group
- Nexperia
- Vishay Intertechnology
- Zhuzhou CRRC Times Electric
- China Resources Microelectronics Limited
- StarPower
- Yangzhou Yangjie Electronic Technology
- Guangdong AccoPower Semiconductor
- Changzhou Galaxy Century Microelectronics
- Hangzhou Silan Microelectronics
- Cissoid
- SK powertech
- InventChip Technology
- Hebei Sinopack Electronic Technology
- Oriental Semiconductor
- Jilin Sino-Microelectronics
- PN Junction Semiconductor (Hangzhou)
Key Developments in Automobile SiC and GaN Power Devices Industry
- 2023: STMicroelectronics announces significant expansion of its SiC wafer fabrication facility in Catania, Italy, to meet growing automotive demand.
- 2023: Infineon Technologies acquires GaN Systems, a leading player in GaN power semiconductors, to bolster its GaN portfolio for automotive and industrial applications.
- 2023: Wolfspeed opens its new SiC manufacturing facility in North Carolina, significantly increasing its production capacity for automotive-grade SiC power devices.
- 2024: Rohm Semiconductor launches a new generation of SiC MOSFETs with improved performance and lower on-resistance, targeting high-performance EV applications.
- 2024: Onsemi introduces innovative GaN power stage solutions for EV on-board chargers, enabling higher power density and efficiency.
- 2024: NXP Semiconductors expands its portfolio of automotive-grade SiC and GaN solutions, focusing on integrated power modules for main inverters.
- 2024: BYD Semiconductor announces strategic partnerships to accelerate the development and adoption of SiC power devices for its electric vehicle production.
- 2025 (Projected): Anticipated significant increase in the adoption of 800V SiC-based main inverters across premium EV models.
- 2026 (Projected): Increased market presence of GaN-based integrated power solutions for faster and more compact EV on-board chargers.
Strategic Automobile SiC and GaN Power Devices Market Forecast
The strategic forecast for the Automobile SiC and GaN Power Devices Market remains exceptionally strong, driven by the accelerating global transition to electric mobility. The continued push for enhanced vehicle efficiency, extended driving ranges, and faster charging capabilities will ensure sustained demand for high-performance SiC and GaN solutions. Technological advancements leading to further cost reductions and performance improvements will broaden their applicability across more vehicle segments. Strategic investments in manufacturing capacity and the development of robust supply chains will be crucial for market leaders to capitalize on the projected market expansion, estimated to reach tens of million in value by the end of the forecast period. Emerging trends like vehicle-to-grid (V2G) technology and the integration of advanced power electronics will further solidify the indispensable role of these wide-bandgap semiconductors in shaping the future of transportation.
Automobile Sic And Gan Power Devices Segmentation
-
1. Application
- 1.1. Main Inverter
- 1.2. EV On-Board Chargers
- 1.3. DC/DC Converter
- 1.4. Others
-
2. Type
- 2.1. SiC Power Devices
- 2.2. GaN Power Devices
Automobile Sic And Gan Power Devices Segmentation By Geography
-
1. North America
- 1.1. United States
- 1.2. Canada
- 1.3. Mexico
-
2. South America
- 2.1. Brazil
- 2.2. Argentina
- 2.3. Rest of South America
-
3. Europe
- 3.1. United Kingdom
- 3.2. Germany
- 3.3. France
- 3.4. Italy
- 3.5. Spain
- 3.6. Russia
- 3.7. Benelux
- 3.8. Nordics
- 3.9. Rest of Europe
-
4. Middle East & Africa
- 4.1. Turkey
- 4.2. Israel
- 4.3. GCC
- 4.4. North Africa
- 4.5. South Africa
- 4.6. Rest of Middle East & Africa
-
5. Asia Pacific
- 5.1. China
- 5.2. India
- 5.3. Japan
- 5.4. South Korea
- 5.5. ASEAN
- 5.6. Oceania
- 5.7. Rest of Asia Pacific
Automobile Sic And Gan Power Devices Regional Market Share
Geographic Coverage of Automobile Sic And Gan Power Devices
Automobile Sic And Gan Power Devices REPORT HIGHLIGHTS
| Aspects | Details |
|---|---|
| Study Period | 2020-2034 |
| Base Year | 2025 |
| Estimated Year | 2026 |
| Forecast Period | 2026-2034 |
| Historical Period | 2020-2025 |
| Growth Rate | CAGR of 25.6% from 2020-2034 |
| Segmentation |
|
Table of Contents
- 1. Introduction
- 1.1. Research Scope
- 1.2. Market Segmentation
- 1.3. Research Objective
- 1.4. Definitions and Assumptions
- 2. Executive Summary
- 2.1. Market Snapshot
- 3. Market Dynamics
- 3.1. Market Drivers
- 3.2. Market Restrains
- 3.3. Market Trends
- 3.4. Market Opportunities
- 4. Market Factor Analysis
- 4.1. Porters Five Forces
- 4.1.1. Bargaining Power of Suppliers
- 4.1.2. Bargaining Power of Buyers
- 4.1.3. Threat of New Entrants
- 4.1.4. Threat of Substitutes
- 4.1.5. Competitive Rivalry
- 4.2. PESTEL analysis
- 4.3. BCG Analysis
- 4.3.1. Stars (High Growth, High Market Share)
- 4.3.2. Cash Cows (Low Growth, High Market Share)
- 4.3.3. Question Mark (High Growth, Low Market Share)
- 4.3.4. Dogs (Low Growth, Low Market Share)
- 4.4. Ansoff Matrix Analysis
- 4.5. Supply Chain Analysis
- 4.6. Regulatory Landscape
- 4.7. Current Market Potential and Opportunity Assessment (TAM–SAM–SOM Framework)
- 4.8. DMV Analyst Note
- 4.1. Porters Five Forces
- 5. Market Analysis, Insights and Forecast 2021-2033
- 5.1. Market Analysis, Insights and Forecast - by Application
- 5.1.1. Main Inverter
- 5.1.2. EV On-Board Chargers
- 5.1.3. DC/DC Converter
- 5.1.4. Others
- 5.2. Market Analysis, Insights and Forecast - by Type
- 5.2.1. SiC Power Devices
- 5.2.2. GaN Power Devices
- 5.3. Market Analysis, Insights and Forecast - by Region
- 5.3.1. North America
- 5.3.2. South America
- 5.3.3. Europe
- 5.3.4. Middle East & Africa
- 5.3.5. Asia Pacific
- 5.1. Market Analysis, Insights and Forecast - by Application
- 6. Global Automobile Sic And Gan Power Devices Analysis, Insights and Forecast, 2021-2033
- 6.1. Market Analysis, Insights and Forecast - by Application
- 6.1.1. Main Inverter
- 6.1.2. EV On-Board Chargers
- 6.1.3. DC/DC Converter
- 6.1.4. Others
- 6.2. Market Analysis, Insights and Forecast - by Type
- 6.2.1. SiC Power Devices
- 6.2.2. GaN Power Devices
- 6.1. Market Analysis, Insights and Forecast - by Application
- 7. North America Automobile Sic And Gan Power Devices Analysis, Insights and Forecast, 2020-2032
- 7.1. Market Analysis, Insights and Forecast - by Application
- 7.1.1. Main Inverter
- 7.1.2. EV On-Board Chargers
- 7.1.3. DC/DC Converter
- 7.1.4. Others
- 7.2. Market Analysis, Insights and Forecast - by Type
- 7.2.1. SiC Power Devices
- 7.2.2. GaN Power Devices
- 7.1. Market Analysis, Insights and Forecast - by Application
- 8. South America Automobile Sic And Gan Power Devices Analysis, Insights and Forecast, 2020-2032
- 8.1. Market Analysis, Insights and Forecast - by Application
- 8.1.1. Main Inverter
- 8.1.2. EV On-Board Chargers
- 8.1.3. DC/DC Converter
- 8.1.4. Others
- 8.2. Market Analysis, Insights and Forecast - by Type
- 8.2.1. SiC Power Devices
- 8.2.2. GaN Power Devices
- 8.1. Market Analysis, Insights and Forecast - by Application
- 9. Europe Automobile Sic And Gan Power Devices Analysis, Insights and Forecast, 2020-2032
- 9.1. Market Analysis, Insights and Forecast - by Application
- 9.1.1. Main Inverter
- 9.1.2. EV On-Board Chargers
- 9.1.3. DC/DC Converter
- 9.1.4. Others
- 9.2. Market Analysis, Insights and Forecast - by Type
- 9.2.1. SiC Power Devices
- 9.2.2. GaN Power Devices
- 9.1. Market Analysis, Insights and Forecast - by Application
- 10. Middle East & Africa Automobile Sic And Gan Power Devices Analysis, Insights and Forecast, 2020-2032
- 10.1. Market Analysis, Insights and Forecast - by Application
- 10.1.1. Main Inverter
- 10.1.2. EV On-Board Chargers
- 10.1.3. DC/DC Converter
- 10.1.4. Others
- 10.2. Market Analysis, Insights and Forecast - by Type
- 10.2.1. SiC Power Devices
- 10.2.2. GaN Power Devices
- 10.1. Market Analysis, Insights and Forecast - by Application
- 11. Asia Pacific Automobile Sic And Gan Power Devices Analysis, Insights and Forecast, 2020-2032
- 11.1. Market Analysis, Insights and Forecast - by Application
- 11.1.1. Main Inverter
- 11.1.2. EV On-Board Chargers
- 11.1.3. DC/DC Converter
- 11.1.4. Others
- 11.2. Market Analysis, Insights and Forecast - by Type
- 11.2.1. SiC Power Devices
- 11.2.2. GaN Power Devices
- 11.1. Market Analysis, Insights and Forecast - by Application
- 12. Competitive Analysis
- 12.1. Company Profiles
- 12.1.1 STMicroelectronics
- 12.1.1.1. Company Overview
- 12.1.1.2. Products
- 12.1.1.3. Company Financials
- 12.1.1.4. SWOT Analysis
- 12.1.2 Infineon (GaN Systems)
- 12.1.2.1. Company Overview
- 12.1.2.2. Products
- 12.1.2.3. Company Financials
- 12.1.2.4. SWOT Analysis
- 12.1.3 Wolfspeed
- 12.1.3.1. Company Overview
- 12.1.3.2. Products
- 12.1.3.3. Company Financials
- 12.1.3.4. SWOT Analysis
- 12.1.4 Rohm
- 12.1.4.1. Company Overview
- 12.1.4.2. Products
- 12.1.4.3. Company Financials
- 12.1.4.4. SWOT Analysis
- 12.1.5 onsemi
- 12.1.5.1. Company Overview
- 12.1.5.2. Products
- 12.1.5.3. Company Financials
- 12.1.5.4. SWOT Analysis
- 12.1.6 NXP
- 12.1.6.1. Company Overview
- 12.1.6.2. Products
- 12.1.6.3. Company Financials
- 12.1.6.4. SWOT Analysis
- 12.1.7 Innoscience
- 12.1.7.1. Company Overview
- 12.1.7.2. Products
- 12.1.7.3. Company Financials
- 12.1.7.4. SWOT Analysis
- 12.1.8 BYD Semiconductor
- 12.1.8.1. Company Overview
- 12.1.8.2. Products
- 12.1.8.3. Company Financials
- 12.1.8.4. SWOT Analysis
- 12.1.9 Microchip (Microsemi)
- 12.1.9.1. Company Overview
- 12.1.9.2. Products
- 12.1.9.3. Company Financials
- 12.1.9.4. SWOT Analysis
- 12.1.10 Mitsubishi Electric (Vincotech)
- 12.1.10.1. Company Overview
- 12.1.10.2. Products
- 12.1.10.3. Company Financials
- 12.1.10.4. SWOT Analysis
- 12.1.11 Semikron Danfoss
- 12.1.11.1. Company Overview
- 12.1.11.2. Products
- 12.1.11.3. Company Financials
- 12.1.11.4. SWOT Analysis
- 12.1.12 Fuji Electric
- 12.1.12.1. Company Overview
- 12.1.12.2. Products
- 12.1.12.3. Company Financials
- 12.1.12.4. SWOT Analysis
- 12.1.13 Toshiba
- 12.1.13.1. Company Overview
- 12.1.13.2. Products
- 12.1.13.3. Company Financials
- 12.1.13.4. SWOT Analysis
- 12.1.14 Bosch
- 12.1.14.1. Company Overview
- 12.1.14.2. Products
- 12.1.14.3. Company Financials
- 12.1.14.4. SWOT Analysis
- 12.1.15 San'an Optoelectronics
- 12.1.15.1. Company Overview
- 12.1.15.2. Products
- 12.1.15.3. Company Financials
- 12.1.15.4. SWOT Analysis
- 12.1.16 Littelfuse (IXYS)
- 12.1.16.1. Company Overview
- 12.1.16.2. Products
- 12.1.16.3. Company Financials
- 12.1.16.4. SWOT Analysis
- 12.1.17 CETC 55
- 12.1.17.1. Company Overview
- 12.1.17.2. Products
- 12.1.17.3. Company Financials
- 12.1.17.4. SWOT Analysis
- 12.1.18 WeEn Semiconductors
- 12.1.18.1. Company Overview
- 12.1.18.2. Products
- 12.1.18.3. Company Financials
- 12.1.18.4. SWOT Analysis
- 12.1.19 BASiC Semiconductor
- 12.1.19.1. Company Overview
- 12.1.19.2. Products
- 12.1.19.3. Company Financials
- 12.1.19.4. SWOT Analysis
- 12.1.20 SemiQ
- 12.1.20.1. Company Overview
- 12.1.20.2. Products
- 12.1.20.3. Company Financials
- 12.1.20.4. SWOT Analysis
- 12.1.21 Diodes Incorporated
- 12.1.21.1. Company Overview
- 12.1.21.2. Products
- 12.1.21.3. Company Financials
- 12.1.21.4. SWOT Analysis
- 12.1.22 SanRex
- 12.1.22.1. Company Overview
- 12.1.22.2. Products
- 12.1.22.3. Company Financials
- 12.1.22.4. SWOT Analysis
- 12.1.23 Alpha & Omega Semiconductor
- 12.1.23.1. Company Overview
- 12.1.23.2. Products
- 12.1.23.3. Company Financials
- 12.1.23.4. SWOT Analysis
- 12.1.24 United Nova Technology
- 12.1.24.1. Company Overview
- 12.1.24.2. Products
- 12.1.24.3. Company Financials
- 12.1.24.4. SWOT Analysis
- 12.1.25 KEC Corporation
- 12.1.25.1. Company Overview
- 12.1.25.2. Products
- 12.1.25.3. Company Financials
- 12.1.25.4. SWOT Analysis
- 12.1.26 PANJIT Group
- 12.1.26.1. Company Overview
- 12.1.26.2. Products
- 12.1.26.3. Company Financials
- 12.1.26.4. SWOT Analysis
- 12.1.27 Nexperia
- 12.1.27.1. Company Overview
- 12.1.27.2. Products
- 12.1.27.3. Company Financials
- 12.1.27.4. SWOT Analysis
- 12.1.28 Vishay Intertechnology
- 12.1.28.1. Company Overview
- 12.1.28.2. Products
- 12.1.28.3. Company Financials
- 12.1.28.4. SWOT Analysis
- 12.1.29 Zhuzhou CRRC Times Electric
- 12.1.29.1. Company Overview
- 12.1.29.2. Products
- 12.1.29.3. Company Financials
- 12.1.29.4. SWOT Analysis
- 12.1.30 China Resources Microelectronics Limited
- 12.1.30.1. Company Overview
- 12.1.30.2. Products
- 12.1.30.3. Company Financials
- 12.1.30.4. SWOT Analysis
- 12.1.31 StarPower
- 12.1.31.1. Company Overview
- 12.1.31.2. Products
- 12.1.31.3. Company Financials
- 12.1.31.4. SWOT Analysis
- 12.1.32 Yangzhou Yangjie Electronic Technology
- 12.1.32.1. Company Overview
- 12.1.32.2. Products
- 12.1.32.3. Company Financials
- 12.1.32.4. SWOT Analysis
- 12.1.33 Guangdong AccoPower Semiconductor
- 12.1.33.1. Company Overview
- 12.1.33.2. Products
- 12.1.33.3. Company Financials
- 12.1.33.4. SWOT Analysis
- 12.1.34 Changzhou Galaxy Century Microelectronics
- 12.1.34.1. Company Overview
- 12.1.34.2. Products
- 12.1.34.3. Company Financials
- 12.1.34.4. SWOT Analysis
- 12.1.35 Hangzhou Silan Microelectronics
- 12.1.35.1. Company Overview
- 12.1.35.2. Products
- 12.1.35.3. Company Financials
- 12.1.35.4. SWOT Analysis
- 12.1.36 Cissoid
- 12.1.36.1. Company Overview
- 12.1.36.2. Products
- 12.1.36.3. Company Financials
- 12.1.36.4. SWOT Analysis
- 12.1.37 SK powertech
- 12.1.37.1. Company Overview
- 12.1.37.2. Products
- 12.1.37.3. Company Financials
- 12.1.37.4. SWOT Analysis
- 12.1.38 InventChip Technology
- 12.1.38.1. Company Overview
- 12.1.38.2. Products
- 12.1.38.3. Company Financials
- 12.1.38.4. SWOT Analysis
- 12.1.39 Hebei Sinopack Electronic Technology
- 12.1.39.1. Company Overview
- 12.1.39.2. Products
- 12.1.39.3. Company Financials
- 12.1.39.4. SWOT Analysis
- 12.1.40 Oriental Semiconductor
- 12.1.40.1. Company Overview
- 12.1.40.2. Products
- 12.1.40.3. Company Financials
- 12.1.40.4. SWOT Analysis
- 12.1.41 Jilin Sino-Microelectronics
- 12.1.41.1. Company Overview
- 12.1.41.2. Products
- 12.1.41.3. Company Financials
- 12.1.41.4. SWOT Analysis
- 12.1.42 PN Junction Semiconductor (Hangzhou)
- 12.1.42.1. Company Overview
- 12.1.42.2. Products
- 12.1.42.3. Company Financials
- 12.1.42.4. SWOT Analysis
- 12.1.1 STMicroelectronics
- 12.2. Market Entropy
- 12.2.1 Company's Key Areas Served
- 12.2.2 Recent Developments
- 12.3. Company Market Share Analysis 2025
- 12.3.1 Top 5 Companies Market Share Analysis
- 12.3.2 Top 3 Companies Market Share Analysis
- 12.4. List of Potential Customers
- 13. Research Methodology
List of Figures
- Figure 1: Global Automobile Sic And Gan Power Devices Revenue Breakdown (million, %) by Region 2025 & 2033
- Figure 2: Global Automobile Sic And Gan Power Devices Volume Breakdown (K, %) by Region 2025 & 2033
- Figure 3: North America Automobile Sic And Gan Power Devices Revenue (million), by Application 2025 & 2033
- Figure 4: North America Automobile Sic And Gan Power Devices Volume (K), by Application 2025 & 2033
- Figure 5: North America Automobile Sic And Gan Power Devices Revenue Share (%), by Application 2025 & 2033
- Figure 6: North America Automobile Sic And Gan Power Devices Volume Share (%), by Application 2025 & 2033
- Figure 7: North America Automobile Sic And Gan Power Devices Revenue (million), by Type 2025 & 2033
- Figure 8: North America Automobile Sic And Gan Power Devices Volume (K), by Type 2025 & 2033
- Figure 9: North America Automobile Sic And Gan Power Devices Revenue Share (%), by Type 2025 & 2033
- Figure 10: North America Automobile Sic And Gan Power Devices Volume Share (%), by Type 2025 & 2033
- Figure 11: North America Automobile Sic And Gan Power Devices Revenue (million), by Country 2025 & 2033
- Figure 12: North America Automobile Sic And Gan Power Devices Volume (K), by Country 2025 & 2033
- Figure 13: North America Automobile Sic And Gan Power Devices Revenue Share (%), by Country 2025 & 2033
- Figure 14: North America Automobile Sic And Gan Power Devices Volume Share (%), by Country 2025 & 2033
- Figure 15: South America Automobile Sic And Gan Power Devices Revenue (million), by Application 2025 & 2033
- Figure 16: South America Automobile Sic And Gan Power Devices Volume (K), by Application 2025 & 2033
- Figure 17: South America Automobile Sic And Gan Power Devices Revenue Share (%), by Application 2025 & 2033
- Figure 18: South America Automobile Sic And Gan Power Devices Volume Share (%), by Application 2025 & 2033
- Figure 19: South America Automobile Sic And Gan Power Devices Revenue (million), by Type 2025 & 2033
- Figure 20: South America Automobile Sic And Gan Power Devices Volume (K), by Type 2025 & 2033
- Figure 21: South America Automobile Sic And Gan Power Devices Revenue Share (%), by Type 2025 & 2033
- Figure 22: South America Automobile Sic And Gan Power Devices Volume Share (%), by Type 2025 & 2033
- Figure 23: South America Automobile Sic And Gan Power Devices Revenue (million), by Country 2025 & 2033
- Figure 24: South America Automobile Sic And Gan Power Devices Volume (K), by Country 2025 & 2033
- Figure 25: South America Automobile Sic And Gan Power Devices Revenue Share (%), by Country 2025 & 2033
- Figure 26: South America Automobile Sic And Gan Power Devices Volume Share (%), by Country 2025 & 2033
- Figure 27: Europe Automobile Sic And Gan Power Devices Revenue (million), by Application 2025 & 2033
- Figure 28: Europe Automobile Sic And Gan Power Devices Volume (K), by Application 2025 & 2033
- Figure 29: Europe Automobile Sic And Gan Power Devices Revenue Share (%), by Application 2025 & 2033
- Figure 30: Europe Automobile Sic And Gan Power Devices Volume Share (%), by Application 2025 & 2033
- Figure 31: Europe Automobile Sic And Gan Power Devices Revenue (million), by Type 2025 & 2033
- Figure 32: Europe Automobile Sic And Gan Power Devices Volume (K), by Type 2025 & 2033
- Figure 33: Europe Automobile Sic And Gan Power Devices Revenue Share (%), by Type 2025 & 2033
- Figure 34: Europe Automobile Sic And Gan Power Devices Volume Share (%), by Type 2025 & 2033
- Figure 35: Europe Automobile Sic And Gan Power Devices Revenue (million), by Country 2025 & 2033
- Figure 36: Europe Automobile Sic And Gan Power Devices Volume (K), by Country 2025 & 2033
- Figure 37: Europe Automobile Sic And Gan Power Devices Revenue Share (%), by Country 2025 & 2033
- Figure 38: Europe Automobile Sic And Gan Power Devices Volume Share (%), by Country 2025 & 2033
- Figure 39: Middle East & Africa Automobile Sic And Gan Power Devices Revenue (million), by Application 2025 & 2033
- Figure 40: Middle East & Africa Automobile Sic And Gan Power Devices Volume (K), by Application 2025 & 2033
- Figure 41: Middle East & Africa Automobile Sic And Gan Power Devices Revenue Share (%), by Application 2025 & 2033
- Figure 42: Middle East & Africa Automobile Sic And Gan Power Devices Volume Share (%), by Application 2025 & 2033
- Figure 43: Middle East & Africa Automobile Sic And Gan Power Devices Revenue (million), by Type 2025 & 2033
- Figure 44: Middle East & Africa Automobile Sic And Gan Power Devices Volume (K), by Type 2025 & 2033
- Figure 45: Middle East & Africa Automobile Sic And Gan Power Devices Revenue Share (%), by Type 2025 & 2033
- Figure 46: Middle East & Africa Automobile Sic And Gan Power Devices Volume Share (%), by Type 2025 & 2033
- Figure 47: Middle East & Africa Automobile Sic And Gan Power Devices Revenue (million), by Country 2025 & 2033
- Figure 48: Middle East & Africa Automobile Sic And Gan Power Devices Volume (K), by Country 2025 & 2033
- Figure 49: Middle East & Africa Automobile Sic And Gan Power Devices Revenue Share (%), by Country 2025 & 2033
- Figure 50: Middle East & Africa Automobile Sic And Gan Power Devices Volume Share (%), by Country 2025 & 2033
- Figure 51: Asia Pacific Automobile Sic And Gan Power Devices Revenue (million), by Application 2025 & 2033
- Figure 52: Asia Pacific Automobile Sic And Gan Power Devices Volume (K), by Application 2025 & 2033
- Figure 53: Asia Pacific Automobile Sic And Gan Power Devices Revenue Share (%), by Application 2025 & 2033
- Figure 54: Asia Pacific Automobile Sic And Gan Power Devices Volume Share (%), by Application 2025 & 2033
- Figure 55: Asia Pacific Automobile Sic And Gan Power Devices Revenue (million), by Type 2025 & 2033
- Figure 56: Asia Pacific Automobile Sic And Gan Power Devices Volume (K), by Type 2025 & 2033
- Figure 57: Asia Pacific Automobile Sic And Gan Power Devices Revenue Share (%), by Type 2025 & 2033
- Figure 58: Asia Pacific Automobile Sic And Gan Power Devices Volume Share (%), by Type 2025 & 2033
- Figure 59: Asia Pacific Automobile Sic And Gan Power Devices Revenue (million), by Country 2025 & 2033
- Figure 60: Asia Pacific Automobile Sic And Gan Power Devices Volume (K), by Country 2025 & 2033
- Figure 61: Asia Pacific Automobile Sic And Gan Power Devices Revenue Share (%), by Country 2025 & 2033
- Figure 62: Asia Pacific Automobile Sic And Gan Power Devices Volume Share (%), by Country 2025 & 2033
List of Tables
- Table 1: Global Automobile Sic And Gan Power Devices Revenue million Forecast, by Application 2020 & 2033
- Table 2: Global Automobile Sic And Gan Power Devices Volume K Forecast, by Application 2020 & 2033
- Table 3: Global Automobile Sic And Gan Power Devices Revenue million Forecast, by Type 2020 & 2033
- Table 4: Global Automobile Sic And Gan Power Devices Volume K Forecast, by Type 2020 & 2033
- Table 5: Global Automobile Sic And Gan Power Devices Revenue million Forecast, by Region 2020 & 2033
- Table 6: Global Automobile Sic And Gan Power Devices Volume K Forecast, by Region 2020 & 2033
- Table 7: Global Automobile Sic And Gan Power Devices Revenue million Forecast, by Application 2020 & 2033
- Table 8: Global Automobile Sic And Gan Power Devices Volume K Forecast, by Application 2020 & 2033
- Table 9: Global Automobile Sic And Gan Power Devices Revenue million Forecast, by Type 2020 & 2033
- Table 10: Global Automobile Sic And Gan Power Devices Volume K Forecast, by Type 2020 & 2033
- Table 11: Global Automobile Sic And Gan Power Devices Revenue million Forecast, by Country 2020 & 2033
- Table 12: Global Automobile Sic And Gan Power Devices Volume K Forecast, by Country 2020 & 2033
- Table 13: United States Automobile Sic And Gan Power Devices Revenue (million) Forecast, by Application 2020 & 2033
- Table 14: United States Automobile Sic And Gan Power Devices Volume (K) Forecast, by Application 2020 & 2033
- Table 15: Canada Automobile Sic And Gan Power Devices Revenue (million) Forecast, by Application 2020 & 2033
- Table 16: Canada Automobile Sic And Gan Power Devices Volume (K) Forecast, by Application 2020 & 2033
- Table 17: Mexico Automobile Sic And Gan Power Devices Revenue (million) Forecast, by Application 2020 & 2033
- Table 18: Mexico Automobile Sic And Gan Power Devices Volume (K) Forecast, by Application 2020 & 2033
- Table 19: Global Automobile Sic And Gan Power Devices Revenue million Forecast, by Application 2020 & 2033
- Table 20: Global Automobile Sic And Gan Power Devices Volume K Forecast, by Application 2020 & 2033
- Table 21: Global Automobile Sic And Gan Power Devices Revenue million Forecast, by Type 2020 & 2033
- Table 22: Global Automobile Sic And Gan Power Devices Volume K Forecast, by Type 2020 & 2033
- Table 23: Global Automobile Sic And Gan Power Devices Revenue million Forecast, by Country 2020 & 2033
- Table 24: Global Automobile Sic And Gan Power Devices Volume K Forecast, by Country 2020 & 2033
- Table 25: Brazil Automobile Sic And Gan Power Devices Revenue (million) Forecast, by Application 2020 & 2033
- Table 26: Brazil Automobile Sic And Gan Power Devices Volume (K) Forecast, by Application 2020 & 2033
- Table 27: Argentina Automobile Sic And Gan Power Devices Revenue (million) Forecast, by Application 2020 & 2033
- Table 28: Argentina Automobile Sic And Gan Power Devices Volume (K) Forecast, by Application 2020 & 2033
- Table 29: Rest of South America Automobile Sic And Gan Power Devices Revenue (million) Forecast, by Application 2020 & 2033
- Table 30: Rest of South America Automobile Sic And Gan Power Devices Volume (K) Forecast, by Application 2020 & 2033
- Table 31: Global Automobile Sic And Gan Power Devices Revenue million Forecast, by Application 2020 & 2033
- Table 32: Global Automobile Sic And Gan Power Devices Volume K Forecast, by Application 2020 & 2033
- Table 33: Global Automobile Sic And Gan Power Devices Revenue million Forecast, by Type 2020 & 2033
- Table 34: Global Automobile Sic And Gan Power Devices Volume K Forecast, by Type 2020 & 2033
- Table 35: Global Automobile Sic And Gan Power Devices Revenue million Forecast, by Country 2020 & 2033
- Table 36: Global Automobile Sic And Gan Power Devices Volume K Forecast, by Country 2020 & 2033
- Table 37: United Kingdom Automobile Sic And Gan Power Devices Revenue (million) Forecast, by Application 2020 & 2033
- Table 38: United Kingdom Automobile Sic And Gan Power Devices Volume (K) Forecast, by Application 2020 & 2033
- Table 39: Germany Automobile Sic And Gan Power Devices Revenue (million) Forecast, by Application 2020 & 2033
- Table 40: Germany Automobile Sic And Gan Power Devices Volume (K) Forecast, by Application 2020 & 2033
- Table 41: France Automobile Sic And Gan Power Devices Revenue (million) Forecast, by Application 2020 & 2033
- Table 42: France Automobile Sic And Gan Power Devices Volume (K) Forecast, by Application 2020 & 2033
- Table 43: Italy Automobile Sic And Gan Power Devices Revenue (million) Forecast, by Application 2020 & 2033
- Table 44: Italy Automobile Sic And Gan Power Devices Volume (K) Forecast, by Application 2020 & 2033
- Table 45: Spain Automobile Sic And Gan Power Devices Revenue (million) Forecast, by Application 2020 & 2033
- Table 46: Spain Automobile Sic And Gan Power Devices Volume (K) Forecast, by Application 2020 & 2033
- Table 47: Russia Automobile Sic And Gan Power Devices Revenue (million) Forecast, by Application 2020 & 2033
- Table 48: Russia Automobile Sic And Gan Power Devices Volume (K) Forecast, by Application 2020 & 2033
- Table 49: Benelux Automobile Sic And Gan Power Devices Revenue (million) Forecast, by Application 2020 & 2033
- Table 50: Benelux Automobile Sic And Gan Power Devices Volume (K) Forecast, by Application 2020 & 2033
- Table 51: Nordics Automobile Sic And Gan Power Devices Revenue (million) Forecast, by Application 2020 & 2033
- Table 52: Nordics Automobile Sic And Gan Power Devices Volume (K) Forecast, by Application 2020 & 2033
- Table 53: Rest of Europe Automobile Sic And Gan Power Devices Revenue (million) Forecast, by Application 2020 & 2033
- Table 54: Rest of Europe Automobile Sic And Gan Power Devices Volume (K) Forecast, by Application 2020 & 2033
- Table 55: Global Automobile Sic And Gan Power Devices Revenue million Forecast, by Application 2020 & 2033
- Table 56: Global Automobile Sic And Gan Power Devices Volume K Forecast, by Application 2020 & 2033
- Table 57: Global Automobile Sic And Gan Power Devices Revenue million Forecast, by Type 2020 & 2033
- Table 58: Global Automobile Sic And Gan Power Devices Volume K Forecast, by Type 2020 & 2033
- Table 59: Global Automobile Sic And Gan Power Devices Revenue million Forecast, by Country 2020 & 2033
- Table 60: Global Automobile Sic And Gan Power Devices Volume K Forecast, by Country 2020 & 2033
- Table 61: Turkey Automobile Sic And Gan Power Devices Revenue (million) Forecast, by Application 2020 & 2033
- Table 62: Turkey Automobile Sic And Gan Power Devices Volume (K) Forecast, by Application 2020 & 2033
- Table 63: Israel Automobile Sic And Gan Power Devices Revenue (million) Forecast, by Application 2020 & 2033
- Table 64: Israel Automobile Sic And Gan Power Devices Volume (K) Forecast, by Application 2020 & 2033
- Table 65: GCC Automobile Sic And Gan Power Devices Revenue (million) Forecast, by Application 2020 & 2033
- Table 66: GCC Automobile Sic And Gan Power Devices Volume (K) Forecast, by Application 2020 & 2033
- Table 67: North Africa Automobile Sic And Gan Power Devices Revenue (million) Forecast, by Application 2020 & 2033
- Table 68: North Africa Automobile Sic And Gan Power Devices Volume (K) Forecast, by Application 2020 & 2033
- Table 69: South Africa Automobile Sic And Gan Power Devices Revenue (million) Forecast, by Application 2020 & 2033
- Table 70: South Africa Automobile Sic And Gan Power Devices Volume (K) Forecast, by Application 2020 & 2033
- Table 71: Rest of Middle East & Africa Automobile Sic And Gan Power Devices Revenue (million) Forecast, by Application 2020 & 2033
- Table 72: Rest of Middle East & Africa Automobile Sic And Gan Power Devices Volume (K) Forecast, by Application 2020 & 2033
- Table 73: Global Automobile Sic And Gan Power Devices Revenue million Forecast, by Application 2020 & 2033
- Table 74: Global Automobile Sic And Gan Power Devices Volume K Forecast, by Application 2020 & 2033
- Table 75: Global Automobile Sic And Gan Power Devices Revenue million Forecast, by Type 2020 & 2033
- Table 76: Global Automobile Sic And Gan Power Devices Volume K Forecast, by Type 2020 & 2033
- Table 77: Global Automobile Sic And Gan Power Devices Revenue million Forecast, by Country 2020 & 2033
- Table 78: Global Automobile Sic And Gan Power Devices Volume K Forecast, by Country 2020 & 2033
- Table 79: China Automobile Sic And Gan Power Devices Revenue (million) Forecast, by Application 2020 & 2033
- Table 80: China Automobile Sic And Gan Power Devices Volume (K) Forecast, by Application 2020 & 2033
- Table 81: India Automobile Sic And Gan Power Devices Revenue (million) Forecast, by Application 2020 & 2033
- Table 82: India Automobile Sic And Gan Power Devices Volume (K) Forecast, by Application 2020 & 2033
- Table 83: Japan Automobile Sic And Gan Power Devices Revenue (million) Forecast, by Application 2020 & 2033
- Table 84: Japan Automobile Sic And Gan Power Devices Volume (K) Forecast, by Application 2020 & 2033
- Table 85: South Korea Automobile Sic And Gan Power Devices Revenue (million) Forecast, by Application 2020 & 2033
- Table 86: South Korea Automobile Sic And Gan Power Devices Volume (K) Forecast, by Application 2020 & 2033
- Table 87: ASEAN Automobile Sic And Gan Power Devices Revenue (million) Forecast, by Application 2020 & 2033
- Table 88: ASEAN Automobile Sic And Gan Power Devices Volume (K) Forecast, by Application 2020 & 2033
- Table 89: Oceania Automobile Sic And Gan Power Devices Revenue (million) Forecast, by Application 2020 & 2033
- Table 90: Oceania Automobile Sic And Gan Power Devices Volume (K) Forecast, by Application 2020 & 2033
- Table 91: Rest of Asia Pacific Automobile Sic And Gan Power Devices Revenue (million) Forecast, by Application 2020 & 2033
- Table 92: Rest of Asia Pacific Automobile Sic And Gan Power Devices Volume (K) Forecast, by Application 2020 & 2033
Frequently Asked Questions
1. What is the projected Compound Annual Growth Rate (CAGR) of the Automobile Sic And Gan Power Devices?
The projected CAGR is approximately 25.6%.
2. Which companies are prominent players in the Automobile Sic And Gan Power Devices?
Key companies in the market include STMicroelectronics, Infineon (GaN Systems), Wolfspeed, Rohm, onsemi, NXP, Innoscience, BYD Semiconductor, Microchip (Microsemi), Mitsubishi Electric (Vincotech), Semikron Danfoss, Fuji Electric, Toshiba, Bosch, San'an Optoelectronics, Littelfuse (IXYS), CETC 55, WeEn Semiconductors, BASiC Semiconductor, SemiQ, Diodes Incorporated, SanRex, Alpha & Omega Semiconductor, United Nova Technology, KEC Corporation, PANJIT Group, Nexperia, Vishay Intertechnology, Zhuzhou CRRC Times Electric, China Resources Microelectronics Limited, StarPower, Yangzhou Yangjie Electronic Technology, Guangdong AccoPower Semiconductor, Changzhou Galaxy Century Microelectronics, Hangzhou Silan Microelectronics, Cissoid, SK powertech, InventChip Technology, Hebei Sinopack Electronic Technology, Oriental Semiconductor, Jilin Sino-Microelectronics, PN Junction Semiconductor (Hangzhou).
3. What are the main segments of the Automobile Sic And Gan Power Devices?
The market segments include Application, Type.
4. Can you provide details about the market size?
The market size is estimated to be USD 13530 million as of 2022.
5. What are some drivers contributing to market growth?
N/A
6. What are the notable trends driving market growth?
N/A
7. Are there any restraints impacting market growth?
N/A
8. Can you provide examples of recent developments in the market?
N/A
9. What pricing options are available for accessing the report?
Pricing options include single-user, multi-user, and enterprise licenses priced at USD 3950.00, USD 5925.00, and USD 7900.00 respectively.
10. Is the market size provided in terms of value or volume?
The market size is provided in terms of value, measured in million and volume, measured in K.
11. Are there any specific market keywords associated with the report?
Yes, the market keyword associated with the report is "Automobile Sic And Gan Power Devices," which aids in identifying and referencing the specific market segment covered.
12. How do I determine which pricing option suits my needs best?
The pricing options vary based on user requirements and access needs. Individual users may opt for single-user licenses, while businesses requiring broader access may choose multi-user or enterprise licenses for cost-effective access to the report.
13. Are there any additional resources or data provided in the Automobile Sic And Gan Power Devices report?
While the report offers comprehensive insights, it's advisable to review the specific contents or supplementary materials provided to ascertain if additional resources or data are available.
14. How can I stay updated on further developments or reports in the Automobile Sic And Gan Power Devices?
To stay informed about further developments, trends, and reports in the Automobile Sic And Gan Power Devices, consider subscribing to industry newsletters, following relevant companies and organizations, or regularly checking reputable industry news sources and publications.
Methodology
Step 1 - Identification of Relevant Samples Size from Population Database


Step 2 - Approaches for Defining Global Market Size (Value, Volume* & Price*)

Note*: In applicable scenarios
Step 3 - Data Sources
Primary Research
- Web Analytics
- Survey Reports
- Research Institute
- Latest Research Reports
- Opinion Leaders
Secondary Research
- Annual Reports
- White Paper
- Latest Press Release
- Industry Association
- Paid Database
- Investor Presentations

Step 4 - Data Triangulation
Involves using different sources of information in order to increase the validity of a study
These sources are likely to be stakeholders in a program - participants, other researchers, program staff, other community members, and so on.
Then we put all data in single framework & apply various statistical tools to find out the dynamic on the market.
During the analysis stage, feedback from the stakeholder groups would be compared to determine areas of agreement as well as areas of divergence