

Key Insights
The global Automated Probe Systems market is poised for significant expansion, projected to reach an estimated $1914 million by 2025, with a robust Compound Annual Growth Rate (CAGR) of 4.9% from 2019 to 2033. This growth is primarily fueled by the escalating demand for advanced semiconductor testing solutions across various applications, including Integrated Device Manufacturers (IDMs) and Outsourced Semiconductor Assembly and Test (OSAT) companies. The increasing complexity and miniaturization of semiconductor devices necessitate highly precise and automated testing methodologies, driving the adoption of sophisticated probe systems. Furthermore, the burgeoning growth in sectors like consumer electronics, automotive, and artificial intelligence directly translates to higher production volumes of semiconductors, thereby amplifying the need for efficient and high-throughput automated probing. Key trends such as the integration of AI and machine learning for enhanced test efficiency, the development of higher-density probing capabilities, and the miniaturization of probe heads are expected to further shape market dynamics and create new opportunities for innovation and investment. The market's trajectory is also influenced by the ongoing technological advancements in wafer-level testing and the increasing adoption of these systems in research and development environments.
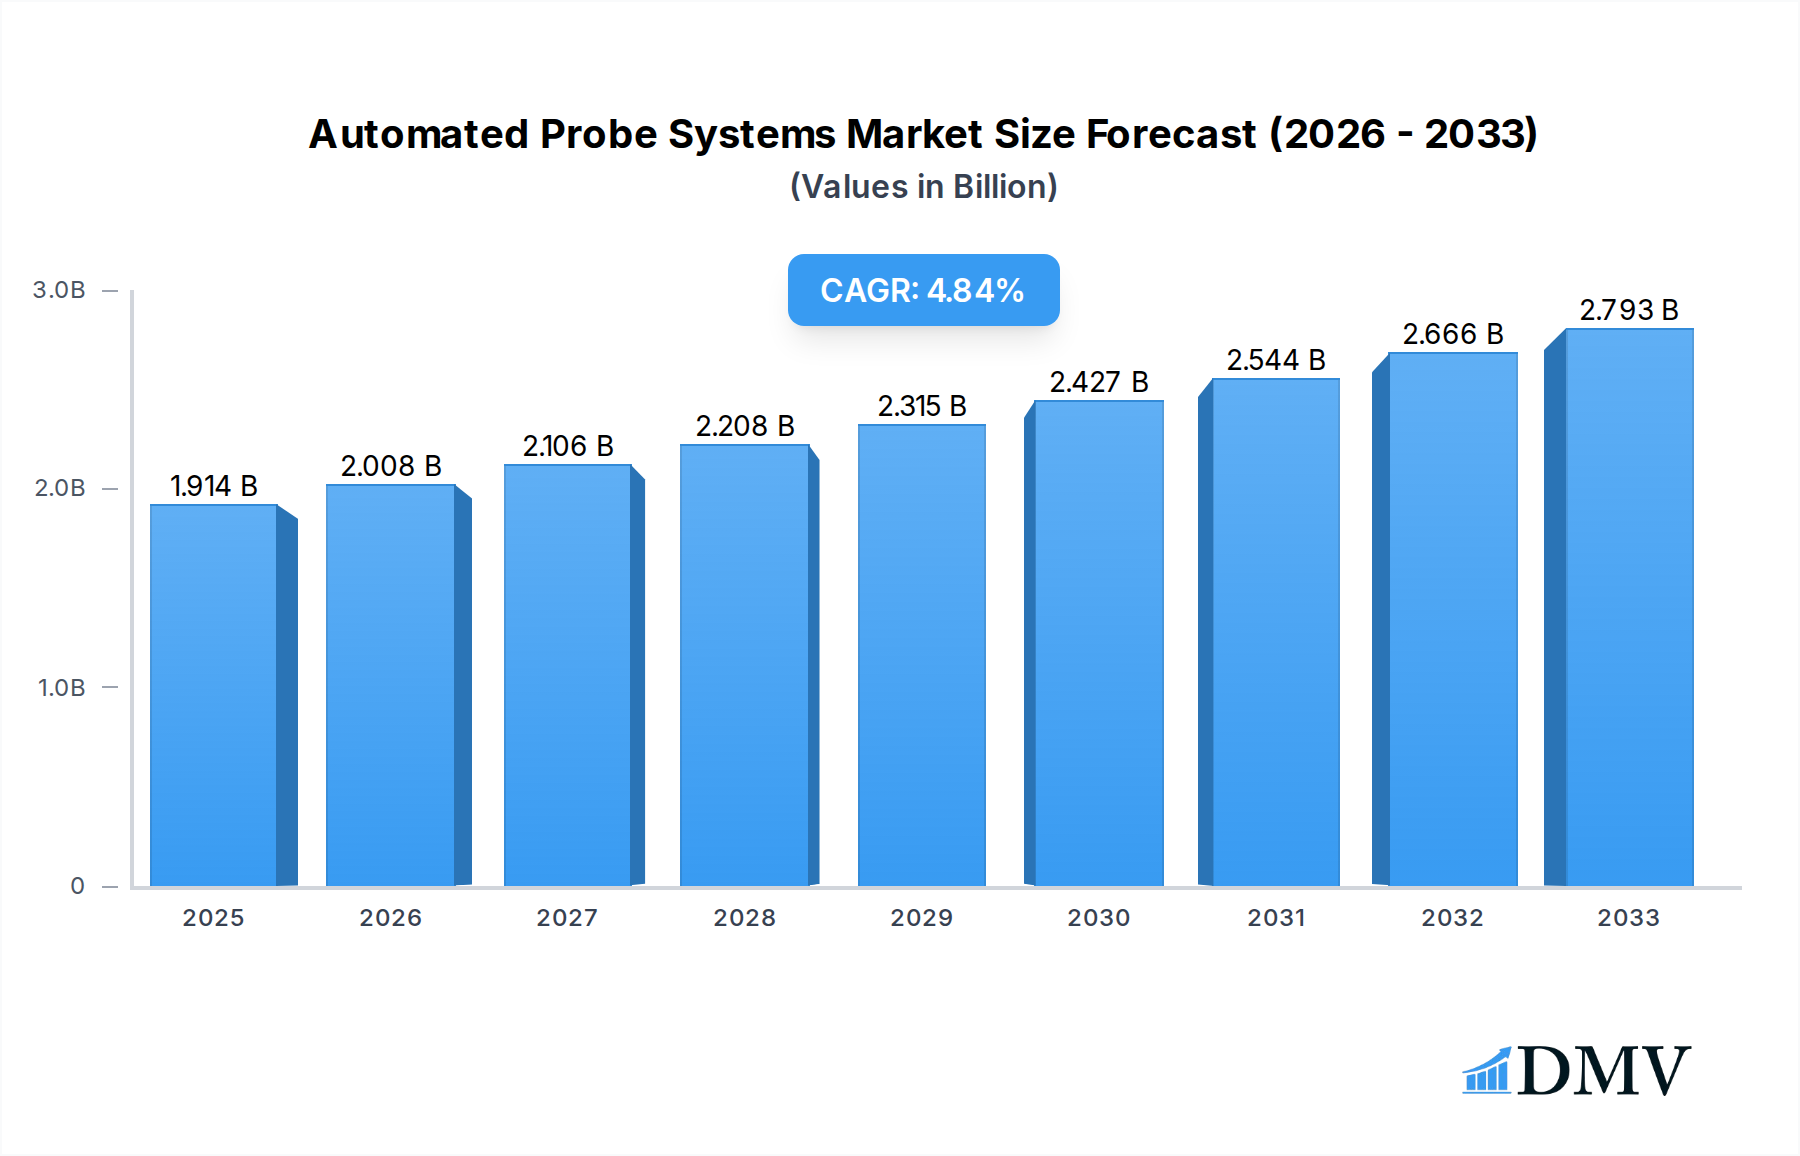
Automated Probe Systems Market Size (In Billion)
Despite the strong growth prospects, the market faces certain restraints. The high initial investment required for acquiring advanced automated probe systems, coupled with the ongoing need for skilled personnel to operate and maintain these sophisticated instruments, can pose a barrier to entry, particularly for smaller players. Additionally, the rapidly evolving nature of semiconductor technology demands continuous upgrades and adaptations of probing equipment, which can incur significant costs for manufacturers. However, the unwavering demand for higher quality and reliability in semiconductor components, driven by stringent industry standards and consumer expectations, will likely outweigh these challenges. The market is segmented into two primary types: Ball Screw Linear Translation Stage and Plane Stepper Motor XY-Stage, each catering to specific testing requirements. Geographically, the Asia Pacific region is anticipated to dominate the market, driven by the concentration of semiconductor manufacturing hubs in countries like China, Japan, and South Korea. North America and Europe are also expected to witness steady growth, supported by the presence of leading semiconductor companies and advanced research institutions.

Automated Probe Systems Company Market Share
Automated Probe Systems Market Composition & Trends
The Automated Probe Systems market, a critical segment within semiconductor testing and manufacturing, exhibits a moderate to high concentration, with key players like Tokyo Seimitsu, Tokyo Electron, and FormFactor dominating market share. Innovation remains a primary catalyst, driven by increasing demand for advanced semiconductor devices and the relentless pursuit of higher testing yields. Industry developments are significantly influenced by evolving regulatory landscapes, particularly concerning semiconductor manufacturing self-sufficiency and advanced technology adoption. Substitute products, while present in manual probing, are increasingly being outpaced by the efficiency and precision of automated systems. End-user profiles are predominantly comprised of Integrated Device Manufacturers (IDMs) and Outsourced Semiconductor Assembly and Test (OSAT) companies, with a growing segment of specialized foundries and R&D institutions. Mergers & Acquisitions (M&A) activities are notable, with historical deal values in the hundreds of million range, reflecting strategic consolidations to enhance product portfolios and expand geographical reach. For instance, acquisitions focusing on advanced wafer-level testing technologies are prominent. The market share distribution for automated probe systems is estimated to be around 65% for IDMs and 30% for OSATs, with the remaining 5% attributed to other applications, driving significant M&A deal values in the multi-million dollar range.
Automated Probe Systems Industry Evolution
The Automated Probe Systems industry has witnessed a dynamic evolution throughout the historical period of 2019–2024, with robust growth projected through the forecast period of 2025–2033. This trajectory is fundamentally shaped by the burgeoning demand for sophisticated semiconductor components across diverse sectors, including automotive, artificial intelligence, and 5G communications. Technological advancements have been paramount, with significant breakthroughs in probe card technology, wafer handling automation, and sophisticated data analytics for yield optimization. The market has seen a substantial increase in the adoption of advanced probing techniques, such as Kelvin probing and RF probing, to meet the stringent testing requirements of high-frequency and high-power devices. Consumer demand, influenced by the proliferation of smart devices and the increasing complexity of integrated circuits, has directly fueled the need for higher throughput and greater precision in semiconductor testing. The base year of 2025 marks a pivotal point, with an estimated market size in the low billions, expected to grow at a Compound Annual Growth Rate (CAGR) of approximately 8% through 2033. This growth is underpinned by substantial investments in research and development by leading manufacturers like Tokyo Seimitsu, Tokyo Electron, and FormFactor, who are continuously pushing the boundaries of what is possible in automated wafer probing. Furthermore, the increasing complexity of chip architectures and the miniaturization of components necessitate more sophisticated automated probe systems to ensure the reliability and performance of semiconductor devices before they reach the market. The adoption of AI and machine learning in test data analysis is also playing a crucial role in optimizing test strategies and reducing time-to-market for new chip designs. The market's evolution is also characterized by a shift towards more flexible and modular probe system designs, allowing for easier adaptation to different wafer sizes and testing requirements, further solidifying the industry's growth trajectory.
Leading Regions, Countries, or Segments in Automated Probe Systems
Asia Pacific, particularly East Asia, stands as the dominant region in the Automated Probe Systems market, driven by the presence of major semiconductor manufacturing hubs in South Korea, Taiwan, Japan, and China. This dominance is fueled by significant investment trends in advanced semiconductor fabrication facilities and a strong government focus on developing indigenous semiconductor capabilities.
Application Dominance:
- IDMs (Integrated Device Manufacturers): These companies are at the forefront of designing and manufacturing their own semiconductors, making them the largest consumers of automated probe systems for their internal production lines. Their demand for high-volume testing and unparalleled precision positions them as the primary market segment.
- OSAT (Outsourced Semiconductor Assembly and Test): OSAT providers play a crucial role in the semiconductor supply chain, offering specialized testing services. Their growth is directly tied to the expansion of fabless semiconductor companies and the need for outsourced testing solutions, making them a rapidly expanding segment.
- Others: This segment encompasses research institutions, universities, and niche foundries that require advanced probing capabilities for R&D and specialized production, contributing a smaller but significant portion to market demand.
Type Dominance:
- Ball Screw Linear Translation Stage: This type of stage offers high precision and accuracy for wafer probing applications, making it a preferred choice for critical testing processes. Its ability to provide smooth and controlled movement is essential for accurate probe placement.
- Plane Stepper Motor XY-Stage: While also providing precise movement, these stages are often favored for their cost-effectiveness and suitability for a broader range of applications where the absolute highest precision is not always the primary requirement.
The dominance of Asia Pacific is further underscored by countries like South Korea and Taiwan, which house leading IDMs and a substantial number of OSAT facilities. Regulatory support in these regions, including government incentives for advanced manufacturing and R&D, has fostered an environment conducive to the growth of the automated probe systems market. The concentration of leading players like Tokyo Seimitsu, Tokyo Electron, Semics, and Shen Zhen Sidea within this geographical area also contributes to its market leadership. The rapid expansion of wafer fabrication capacity in China, driven by national initiatives, is also a significant factor contributing to the region's leading position. The increasing complexity of semiconductor devices, particularly in areas like AI accelerators and advanced mobile processors, necessitates the adoption of highly sophisticated automated probe systems, further solidifying Asia Pacific's market leadership. The market size for automated probe systems in this region is estimated to be in the hundreds of million range, reflecting the extensive investments made by local and international semiconductor companies.
Automated Probe Systems Product Innovations
Recent product innovations in Automated Probe Systems are revolutionizing semiconductor testing. Companies are introducing advanced probe cards with higher probe densities and improved signal integrity for testing next-generation chips, supporting higher frequency bands and reduced contact resistance. Enhancements in wafer handling automation, including robotic arms with sophisticated vision systems, are dramatically reducing probe time and increasing throughput. Furthermore, the integration of AI and machine learning algorithms into probe systems allows for predictive maintenance and real-time yield optimization, leading to significant cost savings and faster time-to-market for semiconductor manufacturers. Performance metrics like probe per hour are consistently improving, with new systems achieving speeds in the millions.
Propelling Factors for Automated Probe Systems Growth
Several key factors are propelling the growth of the Automated Probe Systems market. The exponential rise in demand for advanced semiconductors, driven by technologies like Artificial Intelligence, 5G, and the Internet of Things (IoT), necessitates more sophisticated and higher-throughput testing solutions. Technological advancements in probe card technology, including finer pitch probes and improved signal integrity, are enabling the testing of increasingly complex and miniaturized integrated circuits. Furthermore, the growing trend of semiconductor manufacturing localization and the increasing focus on domestic supply chain resilience by various nations are driving significant investments in new fabrication facilities, which in turn require advanced automated probe systems. Economic drivers include the need to reduce testing costs and improve yield through automation, leading to substantial return on investment for semiconductor manufacturers.
Obstacles in the Automated Probe Systems Market
Despite robust growth, the Automated Probe Systems market faces several obstacles. The extremely high cost of advanced automated probe systems can be a significant barrier to entry, particularly for smaller companies or those in emerging markets, with initial investments potentially reaching into the tens of million dollars. Supply chain disruptions, exacerbated by geopolitical factors and raw material shortages, can impact manufacturing timelines and increase costs. The complexity of integrating new automated probe systems with existing manufacturing workflows requires specialized expertise and can lead to implementation challenges. Intense competition among established players and new entrants also puts pressure on pricing and margins. Furthermore, the rapid pace of technological advancement necessitates continuous R&D investment, adding to the financial burden.
Future Opportunities in Automated Probe Systems
Emerging opportunities in the Automated Probe Systems market are vast. The expanding applications of advanced semiconductors in sectors like electric vehicles, smart healthcare, and autonomous systems present significant new demand. The continuous miniaturization of chip components and the increasing demand for higher performance create opportunities for innovative probe technologies and higher precision systems. The growing trend of wafer-level testing, which allows for testing before dicing, offers a substantial avenue for growth, reducing overall manufacturing costs and improving yield. Furthermore, the development of AI-powered automated test solutions promises to unlock new levels of efficiency and predictive capabilities. The market for specialized probe systems for advanced packaging technologies is also poised for significant expansion, potentially reaching millions in value.
Major Players in the Automated Probe Systems Ecosystem
- Tokyo Seimitsu
- Tokyo Electron
- Semics
- Shen Zhen Sidea
- FitTech
- FormFactor
- MPI
- Semishare Electronic
- MarTek (Electroglas)
- MicroXact
- Wentworth Laboratories
- SemiProbe
- ESDEMC Technology
- STAR TECHNOLOGIES
- Pegasus Instrument
- POMME TECHNOLOGIES
- Tec Semiconductor Equipment (Shenzhen)
- ChangChun Guanghua Micro-Electronic Equipment
- Hangzhou Changchuan Technology
- Semipeak
- Chengdu Yunyi Zhichuang Technology
- Titan Micro Electronics
- Jingxin Intelligent Equipment (Suzhou)
- LINKPHYSICS
- Shanghai Junchen Automation Technology
Key Developments in Automated Probe Systems Industry
- Q1 2023: FormFactor launched a new generation of advanced probe cards for testing next-generation AI accelerators, boasting millions of performance improvements in contact resistance.
- Q4 2022: Tokyo Electron announced strategic partnerships with several leading OSAT providers to enhance their automated probing capabilities, potentially worth hundreds of million in new equipment sales.
- Q2 2023: Semics unveiled a new automated wafer probe system with enhanced AI-driven anomaly detection, significantly reducing test time by millions of operations per wafer.
- Q3 2023: MPI Corporation introduced a novel temperature control system for wafer probing, crucial for testing sensitive advanced semiconductor devices, with an estimated market impact in the tens of millions.
- Q1 2024: Shen Zhen Sidea expanded its product line with a new series of high-precision XY stages, catering to the growing demand for wafer-level testing solutions in the Chinese market.
Strategic Automated Probe Systems Market Forecast
The strategic Automated Probe Systems market forecast indicates a robust expansion driven by escalating demand for sophisticated semiconductors. Key growth catalysts include the relentless innovation in probe card technology and wafer handling automation, alongside the increasing adoption of AI for optimized testing strategies. Emerging markets and new applications, particularly in the automotive and IoT sectors, are poised to contribute significantly to market growth, with projected market value in the billions. Strategic investments in R&D and expansion of manufacturing capacities by leading players will further solidify market potential. The focus on advanced packaging solutions and the increasing trend towards wafer-level testing present substantial future opportunities, promising continued upward trajectory for the market.
Automated Probe Systems Segmentation
-
1. Application
- 1.1. IDMs
- 1.2. OSAT
- 1.3. Others
-
2. Type
- 2.1. Ball Screw Linear Translation Stage
- 2.2. Plane Stepper Motor XY-Stage
Automated Probe Systems Segmentation By Geography
-
1. North America
- 1.1. United States
- 1.2. Canada
- 1.3. Mexico
-
2. South America
- 2.1. Brazil
- 2.2. Argentina
- 2.3. Rest of South America
-
3. Europe
- 3.1. United Kingdom
- 3.2. Germany
- 3.3. France
- 3.4. Italy
- 3.5. Spain
- 3.6. Russia
- 3.7. Benelux
- 3.8. Nordics
- 3.9. Rest of Europe
-
4. Middle East & Africa
- 4.1. Turkey
- 4.2. Israel
- 4.3. GCC
- 4.4. North Africa
- 4.5. South Africa
- 4.6. Rest of Middle East & Africa
-
5. Asia Pacific
- 5.1. China
- 5.2. India
- 5.3. Japan
- 5.4. South Korea
- 5.5. ASEAN
- 5.6. Oceania
- 5.7. Rest of Asia Pacific

Automated Probe Systems Regional Market Share
Geographic Coverage of Automated Probe Systems
Automated Probe Systems REPORT HIGHLIGHTS
| Aspects | Details |
|---|---|
| Study Period | 2020-2034 |
| Base Year | 2025 |
| Estimated Year | 2026 |
| Forecast Period | 2026-2034 |
| Historical Period | 2020-2025 |
| Growth Rate | CAGR of 9.1% from 2020-2034 |
| Segmentation |
|
Table of Contents
- 1. Introduction
- 1.1. Research Scope
- 1.2. Market Segmentation
- 1.3. Research Objective
- 1.4. Definitions and Assumptions
- 2. Executive Summary
- 2.1. Market Snapshot
- 3. Market Dynamics
- 3.1. Market Drivers
- 3.2. Market Restrains
- 3.3. Market Trends
- 3.4. Market Opportunities
- 4. Market Factor Analysis
- 4.1. Porters Five Forces
- 4.1.1. Bargaining Power of Suppliers
- 4.1.2. Bargaining Power of Buyers
- 4.1.3. Threat of New Entrants
- 4.1.4. Threat of Substitutes
- 4.1.5. Competitive Rivalry
- 4.2. PESTEL analysis
- 4.3. BCG Analysis
- 4.3.1. Stars (High Growth, High Market Share)
- 4.3.2. Cash Cows (Low Growth, High Market Share)
- 4.3.3. Question Mark (High Growth, Low Market Share)
- 4.3.4. Dogs (Low Growth, Low Market Share)
- 4.4. Ansoff Matrix Analysis
- 4.5. Supply Chain Analysis
- 4.6. Regulatory Landscape
- 4.7. Current Market Potential and Opportunity Assessment (TAM–SAM–SOM Framework)
- 4.8. DMV Analyst Note
- 4.1. Porters Five Forces
- 5. Market Analysis, Insights and Forecast 2021-2033
- 5.1. Market Analysis, Insights and Forecast - by Application
- 5.1.1. IDMs
- 5.1.2. OSAT
- 5.1.3. Others
- 5.2. Market Analysis, Insights and Forecast - by Type
- 5.2.1. Ball Screw Linear Translation Stage
- 5.2.2. Plane Stepper Motor XY-Stage
- 5.3. Market Analysis, Insights and Forecast - by Region
- 5.3.1. North America
- 5.3.2. South America
- 5.3.3. Europe
- 5.3.4. Middle East & Africa
- 5.3.5. Asia Pacific
- 5.1. Market Analysis, Insights and Forecast - by Application
- 6. Global Automated Probe Systems Analysis, Insights and Forecast, 2021-2033
- 6.1. Market Analysis, Insights and Forecast - by Application
- 6.1.1. IDMs
- 6.1.2. OSAT
- 6.1.3. Others
- 6.2. Market Analysis, Insights and Forecast - by Type
- 6.2.1. Ball Screw Linear Translation Stage
- 6.2.2. Plane Stepper Motor XY-Stage
- 6.1. Market Analysis, Insights and Forecast - by Application
- 7. North America Automated Probe Systems Analysis, Insights and Forecast, 2020-2032
- 7.1. Market Analysis, Insights and Forecast - by Application
- 7.1.1. IDMs
- 7.1.2. OSAT
- 7.1.3. Others
- 7.2. Market Analysis, Insights and Forecast - by Type
- 7.2.1. Ball Screw Linear Translation Stage
- 7.2.2. Plane Stepper Motor XY-Stage
- 7.1. Market Analysis, Insights and Forecast - by Application
- 8. South America Automated Probe Systems Analysis, Insights and Forecast, 2020-2032
- 8.1. Market Analysis, Insights and Forecast - by Application
- 8.1.1. IDMs
- 8.1.2. OSAT
- 8.1.3. Others
- 8.2. Market Analysis, Insights and Forecast - by Type
- 8.2.1. Ball Screw Linear Translation Stage
- 8.2.2. Plane Stepper Motor XY-Stage
- 8.1. Market Analysis, Insights and Forecast - by Application
- 9. Europe Automated Probe Systems Analysis, Insights and Forecast, 2020-2032
- 9.1. Market Analysis, Insights and Forecast - by Application
- 9.1.1. IDMs
- 9.1.2. OSAT
- 9.1.3. Others
- 9.2. Market Analysis, Insights and Forecast - by Type
- 9.2.1. Ball Screw Linear Translation Stage
- 9.2.2. Plane Stepper Motor XY-Stage
- 9.1. Market Analysis, Insights and Forecast - by Application
- 10. Middle East & Africa Automated Probe Systems Analysis, Insights and Forecast, 2020-2032
- 10.1. Market Analysis, Insights and Forecast - by Application
- 10.1.1. IDMs
- 10.1.2. OSAT
- 10.1.3. Others
- 10.2. Market Analysis, Insights and Forecast - by Type
- 10.2.1. Ball Screw Linear Translation Stage
- 10.2.2. Plane Stepper Motor XY-Stage
- 10.1. Market Analysis, Insights and Forecast - by Application
- 11. Asia Pacific Automated Probe Systems Analysis, Insights and Forecast, 2020-2032
- 11.1. Market Analysis, Insights and Forecast - by Application
- 11.1.1. IDMs
- 11.1.2. OSAT
- 11.1.3. Others
- 11.2. Market Analysis, Insights and Forecast - by Type
- 11.2.1. Ball Screw Linear Translation Stage
- 11.2.2. Plane Stepper Motor XY-Stage
- 11.1. Market Analysis, Insights and Forecast - by Application
- 12. Competitive Analysis
- 12.1. Company Profiles
- 12.1.1 Tokyo Seimitsu
- 12.1.1.1. Company Overview
- 12.1.1.2. Products
- 12.1.1.3. Company Financials
- 12.1.1.4. SWOT Analysis
- 12.1.2 Tokyo Electron
- 12.1.2.1. Company Overview
- 12.1.2.2. Products
- 12.1.2.3. Company Financials
- 12.1.2.4. SWOT Analysis
- 12.1.3 Semics
- 12.1.3.1. Company Overview
- 12.1.3.2. Products
- 12.1.3.3. Company Financials
- 12.1.3.4. SWOT Analysis
- 12.1.4 Shen Zhen Sidea
- 12.1.4.1. Company Overview
- 12.1.4.2. Products
- 12.1.4.3. Company Financials
- 12.1.4.4. SWOT Analysis
- 12.1.5 FitTech
- 12.1.5.1. Company Overview
- 12.1.5.2. Products
- 12.1.5.3. Company Financials
- 12.1.5.4. SWOT Analysis
- 12.1.6 FormFactor
- 12.1.6.1. Company Overview
- 12.1.6.2. Products
- 12.1.6.3. Company Financials
- 12.1.6.4. SWOT Analysis
- 12.1.7 MPI
- 12.1.7.1. Company Overview
- 12.1.7.2. Products
- 12.1.7.3. Company Financials
- 12.1.7.4. SWOT Analysis
- 12.1.8 Semishare Electronic
- 12.1.8.1. Company Overview
- 12.1.8.2. Products
- 12.1.8.3. Company Financials
- 12.1.8.4. SWOT Analysis
- 12.1.9 MarTek (Electroglas)
- 12.1.9.1. Company Overview
- 12.1.9.2. Products
- 12.1.9.3. Company Financials
- 12.1.9.4. SWOT Analysis
- 12.1.10 MicroXact
- 12.1.10.1. Company Overview
- 12.1.10.2. Products
- 12.1.10.3. Company Financials
- 12.1.10.4. SWOT Analysis
- 12.1.11 Wentworth Laboratories
- 12.1.11.1. Company Overview
- 12.1.11.2. Products
- 12.1.11.3. Company Financials
- 12.1.11.4. SWOT Analysis
- 12.1.12 SemiProbe
- 12.1.12.1. Company Overview
- 12.1.12.2. Products
- 12.1.12.3. Company Financials
- 12.1.12.4. SWOT Analysis
- 12.1.13 ESDEMC Technology
- 12.1.13.1. Company Overview
- 12.1.13.2. Products
- 12.1.13.3. Company Financials
- 12.1.13.4. SWOT Analysis
- 12.1.14 STAR TECHNOLOGIES
- 12.1.14.1. Company Overview
- 12.1.14.2. Products
- 12.1.14.3. Company Financials
- 12.1.14.4. SWOT Analysis
- 12.1.15 Pegasus Instrument
- 12.1.15.1. Company Overview
- 12.1.15.2. Products
- 12.1.15.3. Company Financials
- 12.1.15.4. SWOT Analysis
- 12.1.16 POMME TECHNOLOGIES
- 12.1.16.1. Company Overview
- 12.1.16.2. Products
- 12.1.16.3. Company Financials
- 12.1.16.4. SWOT Analysis
- 12.1.17 Tec Semiconductor Equipment (Shenzhen)
- 12.1.17.1. Company Overview
- 12.1.17.2. Products
- 12.1.17.3. Company Financials
- 12.1.17.4. SWOT Analysis
- 12.1.18 ChangChun Guanghua Micro-Electronic Equipment
- 12.1.18.1. Company Overview
- 12.1.18.2. Products
- 12.1.18.3. Company Financials
- 12.1.18.4. SWOT Analysis
- 12.1.19 Hangzhou Changchuan Technology
- 12.1.19.1. Company Overview
- 12.1.19.2. Products
- 12.1.19.3. Company Financials
- 12.1.19.4. SWOT Analysis
- 12.1.20 Semipeak
- 12.1.20.1. Company Overview
- 12.1.20.2. Products
- 12.1.20.3. Company Financials
- 12.1.20.4. SWOT Analysis
- 12.1.21 Chengdu Yunyi Zhichuang Technology
- 12.1.21.1. Company Overview
- 12.1.21.2. Products
- 12.1.21.3. Company Financials
- 12.1.21.4. SWOT Analysis
- 12.1.22 Titan Micro Electronics
- 12.1.22.1. Company Overview
- 12.1.22.2. Products
- 12.1.22.3. Company Financials
- 12.1.22.4. SWOT Analysis
- 12.1.23 Jingxin Intelligent Equipment (Suzhou)
- 12.1.23.1. Company Overview
- 12.1.23.2. Products
- 12.1.23.3. Company Financials
- 12.1.23.4. SWOT Analysis
- 12.1.24 LINKPHYSICS
- 12.1.24.1. Company Overview
- 12.1.24.2. Products
- 12.1.24.3. Company Financials
- 12.1.24.4. SWOT Analysis
- 12.1.25 Shanghai Junchen Automation Technology
- 12.1.25.1. Company Overview
- 12.1.25.2. Products
- 12.1.25.3. Company Financials
- 12.1.25.4. SWOT Analysis
- 12.1.1 Tokyo Seimitsu
- 12.2. Market Entropy
- 12.2.1 Company's Key Areas Served
- 12.2.2 Recent Developments
- 12.3. Company Market Share Analysis 2025
- 12.3.1 Top 5 Companies Market Share Analysis
- 12.3.2 Top 3 Companies Market Share Analysis
- 12.4. List of Potential Customers
- 13. Research Methodology
List of Figures
- Figure 1: Global Automated Probe Systems Revenue Breakdown (undefined, %) by Region 2025 & 2033
- Figure 2: Global Automated Probe Systems Volume Breakdown (K, %) by Region 2025 & 2033
- Figure 3: North America Automated Probe Systems Revenue (undefined), by Application 2025 & 2033
- Figure 4: North America Automated Probe Systems Volume (K), by Application 2025 & 2033
- Figure 5: North America Automated Probe Systems Revenue Share (%), by Application 2025 & 2033
- Figure 6: North America Automated Probe Systems Volume Share (%), by Application 2025 & 2033
- Figure 7: North America Automated Probe Systems Revenue (undefined), by Type 2025 & 2033
- Figure 8: North America Automated Probe Systems Volume (K), by Type 2025 & 2033
- Figure 9: North America Automated Probe Systems Revenue Share (%), by Type 2025 & 2033
- Figure 10: North America Automated Probe Systems Volume Share (%), by Type 2025 & 2033
- Figure 11: North America Automated Probe Systems Revenue (undefined), by Country 2025 & 2033
- Figure 12: North America Automated Probe Systems Volume (K), by Country 2025 & 2033
- Figure 13: North America Automated Probe Systems Revenue Share (%), by Country 2025 & 2033
- Figure 14: North America Automated Probe Systems Volume Share (%), by Country 2025 & 2033
- Figure 15: South America Automated Probe Systems Revenue (undefined), by Application 2025 & 2033
- Figure 16: South America Automated Probe Systems Volume (K), by Application 2025 & 2033
- Figure 17: South America Automated Probe Systems Revenue Share (%), by Application 2025 & 2033
- Figure 18: South America Automated Probe Systems Volume Share (%), by Application 2025 & 2033
- Figure 19: South America Automated Probe Systems Revenue (undefined), by Type 2025 & 2033
- Figure 20: South America Automated Probe Systems Volume (K), by Type 2025 & 2033
- Figure 21: South America Automated Probe Systems Revenue Share (%), by Type 2025 & 2033
- Figure 22: South America Automated Probe Systems Volume Share (%), by Type 2025 & 2033
- Figure 23: South America Automated Probe Systems Revenue (undefined), by Country 2025 & 2033
- Figure 24: South America Automated Probe Systems Volume (K), by Country 2025 & 2033
- Figure 25: South America Automated Probe Systems Revenue Share (%), by Country 2025 & 2033
- Figure 26: South America Automated Probe Systems Volume Share (%), by Country 2025 & 2033
- Figure 27: Europe Automated Probe Systems Revenue (undefined), by Application 2025 & 2033
- Figure 28: Europe Automated Probe Systems Volume (K), by Application 2025 & 2033
- Figure 29: Europe Automated Probe Systems Revenue Share (%), by Application 2025 & 2033
- Figure 30: Europe Automated Probe Systems Volume Share (%), by Application 2025 & 2033
- Figure 31: Europe Automated Probe Systems Revenue (undefined), by Type 2025 & 2033
- Figure 32: Europe Automated Probe Systems Volume (K), by Type 2025 & 2033
- Figure 33: Europe Automated Probe Systems Revenue Share (%), by Type 2025 & 2033
- Figure 34: Europe Automated Probe Systems Volume Share (%), by Type 2025 & 2033
- Figure 35: Europe Automated Probe Systems Revenue (undefined), by Country 2025 & 2033
- Figure 36: Europe Automated Probe Systems Volume (K), by Country 2025 & 2033
- Figure 37: Europe Automated Probe Systems Revenue Share (%), by Country 2025 & 2033
- Figure 38: Europe Automated Probe Systems Volume Share (%), by Country 2025 & 2033
- Figure 39: Middle East & Africa Automated Probe Systems Revenue (undefined), by Application 2025 & 2033
- Figure 40: Middle East & Africa Automated Probe Systems Volume (K), by Application 2025 & 2033
- Figure 41: Middle East & Africa Automated Probe Systems Revenue Share (%), by Application 2025 & 2033
- Figure 42: Middle East & Africa Automated Probe Systems Volume Share (%), by Application 2025 & 2033
- Figure 43: Middle East & Africa Automated Probe Systems Revenue (undefined), by Type 2025 & 2033
- Figure 44: Middle East & Africa Automated Probe Systems Volume (K), by Type 2025 & 2033
- Figure 45: Middle East & Africa Automated Probe Systems Revenue Share (%), by Type 2025 & 2033
- Figure 46: Middle East & Africa Automated Probe Systems Volume Share (%), by Type 2025 & 2033
- Figure 47: Middle East & Africa Automated Probe Systems Revenue (undefined), by Country 2025 & 2033
- Figure 48: Middle East & Africa Automated Probe Systems Volume (K), by Country 2025 & 2033
- Figure 49: Middle East & Africa Automated Probe Systems Revenue Share (%), by Country 2025 & 2033
- Figure 50: Middle East & Africa Automated Probe Systems Volume Share (%), by Country 2025 & 2033
- Figure 51: Asia Pacific Automated Probe Systems Revenue (undefined), by Application 2025 & 2033
- Figure 52: Asia Pacific Automated Probe Systems Volume (K), by Application 2025 & 2033
- Figure 53: Asia Pacific Automated Probe Systems Revenue Share (%), by Application 2025 & 2033
- Figure 54: Asia Pacific Automated Probe Systems Volume Share (%), by Application 2025 & 2033
- Figure 55: Asia Pacific Automated Probe Systems Revenue (undefined), by Type 2025 & 2033
- Figure 56: Asia Pacific Automated Probe Systems Volume (K), by Type 2025 & 2033
- Figure 57: Asia Pacific Automated Probe Systems Revenue Share (%), by Type 2025 & 2033
- Figure 58: Asia Pacific Automated Probe Systems Volume Share (%), by Type 2025 & 2033
- Figure 59: Asia Pacific Automated Probe Systems Revenue (undefined), by Country 2025 & 2033
- Figure 60: Asia Pacific Automated Probe Systems Volume (K), by Country 2025 & 2033
- Figure 61: Asia Pacific Automated Probe Systems Revenue Share (%), by Country 2025 & 2033
- Figure 62: Asia Pacific Automated Probe Systems Volume Share (%), by Country 2025 & 2033
List of Tables
- Table 1: Global Automated Probe Systems Revenue undefined Forecast, by Application 2020 & 2033
- Table 2: Global Automated Probe Systems Volume K Forecast, by Application 2020 & 2033
- Table 3: Global Automated Probe Systems Revenue undefined Forecast, by Type 2020 & 2033
- Table 4: Global Automated Probe Systems Volume K Forecast, by Type 2020 & 2033
- Table 5: Global Automated Probe Systems Revenue undefined Forecast, by Region 2020 & 2033
- Table 6: Global Automated Probe Systems Volume K Forecast, by Region 2020 & 2033
- Table 7: Global Automated Probe Systems Revenue undefined Forecast, by Application 2020 & 2033
- Table 8: Global Automated Probe Systems Volume K Forecast, by Application 2020 & 2033
- Table 9: Global Automated Probe Systems Revenue undefined Forecast, by Type 2020 & 2033
- Table 10: Global Automated Probe Systems Volume K Forecast, by Type 2020 & 2033
- Table 11: Global Automated Probe Systems Revenue undefined Forecast, by Country 2020 & 2033
- Table 12: Global Automated Probe Systems Volume K Forecast, by Country 2020 & 2033
- Table 13: United States Automated Probe Systems Revenue (undefined) Forecast, by Application 2020 & 2033
- Table 14: United States Automated Probe Systems Volume (K) Forecast, by Application 2020 & 2033
- Table 15: Canada Automated Probe Systems Revenue (undefined) Forecast, by Application 2020 & 2033
- Table 16: Canada Automated Probe Systems Volume (K) Forecast, by Application 2020 & 2033
- Table 17: Mexico Automated Probe Systems Revenue (undefined) Forecast, by Application 2020 & 2033
- Table 18: Mexico Automated Probe Systems Volume (K) Forecast, by Application 2020 & 2033
- Table 19: Global Automated Probe Systems Revenue undefined Forecast, by Application 2020 & 2033
- Table 20: Global Automated Probe Systems Volume K Forecast, by Application 2020 & 2033
- Table 21: Global Automated Probe Systems Revenue undefined Forecast, by Type 2020 & 2033
- Table 22: Global Automated Probe Systems Volume K Forecast, by Type 2020 & 2033
- Table 23: Global Automated Probe Systems Revenue undefined Forecast, by Country 2020 & 2033
- Table 24: Global Automated Probe Systems Volume K Forecast, by Country 2020 & 2033
- Table 25: Brazil Automated Probe Systems Revenue (undefined) Forecast, by Application 2020 & 2033
- Table 26: Brazil Automated Probe Systems Volume (K) Forecast, by Application 2020 & 2033
- Table 27: Argentina Automated Probe Systems Revenue (undefined) Forecast, by Application 2020 & 2033
- Table 28: Argentina Automated Probe Systems Volume (K) Forecast, by Application 2020 & 2033
- Table 29: Rest of South America Automated Probe Systems Revenue (undefined) Forecast, by Application 2020 & 2033
- Table 30: Rest of South America Automated Probe Systems Volume (K) Forecast, by Application 2020 & 2033
- Table 31: Global Automated Probe Systems Revenue undefined Forecast, by Application 2020 & 2033
- Table 32: Global Automated Probe Systems Volume K Forecast, by Application 2020 & 2033
- Table 33: Global Automated Probe Systems Revenue undefined Forecast, by Type 2020 & 2033
- Table 34: Global Automated Probe Systems Volume K Forecast, by Type 2020 & 2033
- Table 35: Global Automated Probe Systems Revenue undefined Forecast, by Country 2020 & 2033
- Table 36: Global Automated Probe Systems Volume K Forecast, by Country 2020 & 2033
- Table 37: United Kingdom Automated Probe Systems Revenue (undefined) Forecast, by Application 2020 & 2033
- Table 38: United Kingdom Automated Probe Systems Volume (K) Forecast, by Application 2020 & 2033
- Table 39: Germany Automated Probe Systems Revenue (undefined) Forecast, by Application 2020 & 2033
- Table 40: Germany Automated Probe Systems Volume (K) Forecast, by Application 2020 & 2033
- Table 41: France Automated Probe Systems Revenue (undefined) Forecast, by Application 2020 & 2033
- Table 42: France Automated Probe Systems Volume (K) Forecast, by Application 2020 & 2033
- Table 43: Italy Automated Probe Systems Revenue (undefined) Forecast, by Application 2020 & 2033
- Table 44: Italy Automated Probe Systems Volume (K) Forecast, by Application 2020 & 2033
- Table 45: Spain Automated Probe Systems Revenue (undefined) Forecast, by Application 2020 & 2033
- Table 46: Spain Automated Probe Systems Volume (K) Forecast, by Application 2020 & 2033
- Table 47: Russia Automated Probe Systems Revenue (undefined) Forecast, by Application 2020 & 2033
- Table 48: Russia Automated Probe Systems Volume (K) Forecast, by Application 2020 & 2033
- Table 49: Benelux Automated Probe Systems Revenue (undefined) Forecast, by Application 2020 & 2033
- Table 50: Benelux Automated Probe Systems Volume (K) Forecast, by Application 2020 & 2033
- Table 51: Nordics Automated Probe Systems Revenue (undefined) Forecast, by Application 2020 & 2033
- Table 52: Nordics Automated Probe Systems Volume (K) Forecast, by Application 2020 & 2033
- Table 53: Rest of Europe Automated Probe Systems Revenue (undefined) Forecast, by Application 2020 & 2033
- Table 54: Rest of Europe Automated Probe Systems Volume (K) Forecast, by Application 2020 & 2033
- Table 55: Global Automated Probe Systems Revenue undefined Forecast, by Application 2020 & 2033
- Table 56: Global Automated Probe Systems Volume K Forecast, by Application 2020 & 2033
- Table 57: Global Automated Probe Systems Revenue undefined Forecast, by Type 2020 & 2033
- Table 58: Global Automated Probe Systems Volume K Forecast, by Type 2020 & 2033
- Table 59: Global Automated Probe Systems Revenue undefined Forecast, by Country 2020 & 2033
- Table 60: Global Automated Probe Systems Volume K Forecast, by Country 2020 & 2033
- Table 61: Turkey Automated Probe Systems Revenue (undefined) Forecast, by Application 2020 & 2033
- Table 62: Turkey Automated Probe Systems Volume (K) Forecast, by Application 2020 & 2033
- Table 63: Israel Automated Probe Systems Revenue (undefined) Forecast, by Application 2020 & 2033
- Table 64: Israel Automated Probe Systems Volume (K) Forecast, by Application 2020 & 2033
- Table 65: GCC Automated Probe Systems Revenue (undefined) Forecast, by Application 2020 & 2033
- Table 66: GCC Automated Probe Systems Volume (K) Forecast, by Application 2020 & 2033
- Table 67: North Africa Automated Probe Systems Revenue (undefined) Forecast, by Application 2020 & 2033
- Table 68: North Africa Automated Probe Systems Volume (K) Forecast, by Application 2020 & 2033
- Table 69: South Africa Automated Probe Systems Revenue (undefined) Forecast, by Application 2020 & 2033
- Table 70: South Africa Automated Probe Systems Volume (K) Forecast, by Application 2020 & 2033
- Table 71: Rest of Middle East & Africa Automated Probe Systems Revenue (undefined) Forecast, by Application 2020 & 2033
- Table 72: Rest of Middle East & Africa Automated Probe Systems Volume (K) Forecast, by Application 2020 & 2033
- Table 73: Global Automated Probe Systems Revenue undefined Forecast, by Application 2020 & 2033
- Table 74: Global Automated Probe Systems Volume K Forecast, by Application 2020 & 2033
- Table 75: Global Automated Probe Systems Revenue undefined Forecast, by Type 2020 & 2033
- Table 76: Global Automated Probe Systems Volume K Forecast, by Type 2020 & 2033
- Table 77: Global Automated Probe Systems Revenue undefined Forecast, by Country 2020 & 2033
- Table 78: Global Automated Probe Systems Volume K Forecast, by Country 2020 & 2033
- Table 79: China Automated Probe Systems Revenue (undefined) Forecast, by Application 2020 & 2033
- Table 80: China Automated Probe Systems Volume (K) Forecast, by Application 2020 & 2033
- Table 81: India Automated Probe Systems Revenue (undefined) Forecast, by Application 2020 & 2033
- Table 82: India Automated Probe Systems Volume (K) Forecast, by Application 2020 & 2033
- Table 83: Japan Automated Probe Systems Revenue (undefined) Forecast, by Application 2020 & 2033
- Table 84: Japan Automated Probe Systems Volume (K) Forecast, by Application 2020 & 2033
- Table 85: South Korea Automated Probe Systems Revenue (undefined) Forecast, by Application 2020 & 2033
- Table 86: South Korea Automated Probe Systems Volume (K) Forecast, by Application 2020 & 2033
- Table 87: ASEAN Automated Probe Systems Revenue (undefined) Forecast, by Application 2020 & 2033
- Table 88: ASEAN Automated Probe Systems Volume (K) Forecast, by Application 2020 & 2033
- Table 89: Oceania Automated Probe Systems Revenue (undefined) Forecast, by Application 2020 & 2033
- Table 90: Oceania Automated Probe Systems Volume (K) Forecast, by Application 2020 & 2033
- Table 91: Rest of Asia Pacific Automated Probe Systems Revenue (undefined) Forecast, by Application 2020 & 2033
- Table 92: Rest of Asia Pacific Automated Probe Systems Volume (K) Forecast, by Application 2020 & 2033
Frequently Asked Questions
1. What is the projected Compound Annual Growth Rate (CAGR) of the Automated Probe Systems?
The projected CAGR is approximately 9.1%.
2. Which companies are prominent players in the Automated Probe Systems?
Key companies in the market include Tokyo Seimitsu, Tokyo Electron, Semics, Shen Zhen Sidea, FitTech, FormFactor, MPI, Semishare Electronic, MarTek (Electroglas), MicroXact, Wentworth Laboratories, SemiProbe, ESDEMC Technology, STAR TECHNOLOGIES, Pegasus Instrument, POMME TECHNOLOGIES, Tec Semiconductor Equipment (Shenzhen), ChangChun Guanghua Micro-Electronic Equipment, Hangzhou Changchuan Technology, Semipeak, Chengdu Yunyi Zhichuang Technology, Titan Micro Electronics, Jingxin Intelligent Equipment (Suzhou), LINKPHYSICS, Shanghai Junchen Automation Technology.
3. What are the main segments of the Automated Probe Systems?
The market segments include Application, Type.
4. Can you provide details about the market size?
The market size is estimated to be USD XXX N/A as of 2022.
5. What are some drivers contributing to market growth?
N/A
6. What are the notable trends driving market growth?
N/A
7. Are there any restraints impacting market growth?
N/A
8. Can you provide examples of recent developments in the market?
N/A
9. What pricing options are available for accessing the report?
Pricing options include single-user, multi-user, and enterprise licenses priced at USD 3950.00, USD 5925.00, and USD 7900.00 respectively.
10. Is the market size provided in terms of value or volume?
The market size is provided in terms of value, measured in N/A and volume, measured in K.
11. Are there any specific market keywords associated with the report?
Yes, the market keyword associated with the report is "Automated Probe Systems," which aids in identifying and referencing the specific market segment covered.
12. How do I determine which pricing option suits my needs best?
The pricing options vary based on user requirements and access needs. Individual users may opt for single-user licenses, while businesses requiring broader access may choose multi-user or enterprise licenses for cost-effective access to the report.
13. Are there any additional resources or data provided in the Automated Probe Systems report?
While the report offers comprehensive insights, it's advisable to review the specific contents or supplementary materials provided to ascertain if additional resources or data are available.
14. How can I stay updated on further developments or reports in the Automated Probe Systems?
To stay informed about further developments, trends, and reports in the Automated Probe Systems, consider subscribing to industry newsletters, following relevant companies and organizations, or regularly checking reputable industry news sources and publications.
Methodology
Step 1 - Identification of Relevant Samples Size from Population Database


Step 2 - Approaches for Defining Global Market Size (Value, Volume* & Price*)

Note*: In applicable scenarios
Step 3 - Data Sources
Primary Research
- Web Analytics
- Survey Reports
- Research Institute
- Latest Research Reports
- Opinion Leaders
Secondary Research
- Annual Reports
- White Paper
- Latest Press Release
- Industry Association
- Paid Database
- Investor Presentations

Step 4 - Data Triangulation
Involves using different sources of information in order to increase the validity of a study
These sources are likely to be stakeholders in a program - participants, other researchers, program staff, other community members, and so on.
Then we put all data in single framework & apply various statistical tools to find out the dynamic on the market.
During the analysis stage, feedback from the stakeholder groups would be compared to determine areas of agreement as well as areas of divergence