

Key Insights
The Asia-Pacific Anti-Money Laundering (AML) solutions market is poised for substantial expansion, propelled by escalating financial crime, stringent regulatory compliance, and the accelerated adoption of digital financial technologies. This dynamic market, projected to reach $4.13 billion by 2025, is anticipated to grow at a robust Compound Annual Growth Rate (CAGR) of 17.8% from 2025 to 2033. Key growth drivers include the burgeoning economies of China and India, experiencing a surge in financial transactions, which consequently leads to stricter government enforcement of AML regulations. The rapid digitalization of financial services also presents new avenues for illicit activities, necessitating advanced solutions such as AI-powered transaction monitoring and Know Your Customer (KYC) systems. Increased awareness of money laundering's detrimental economic impact is driving significant investment in AML solutions across diverse sectors, including BFSI, retail, and healthcare.
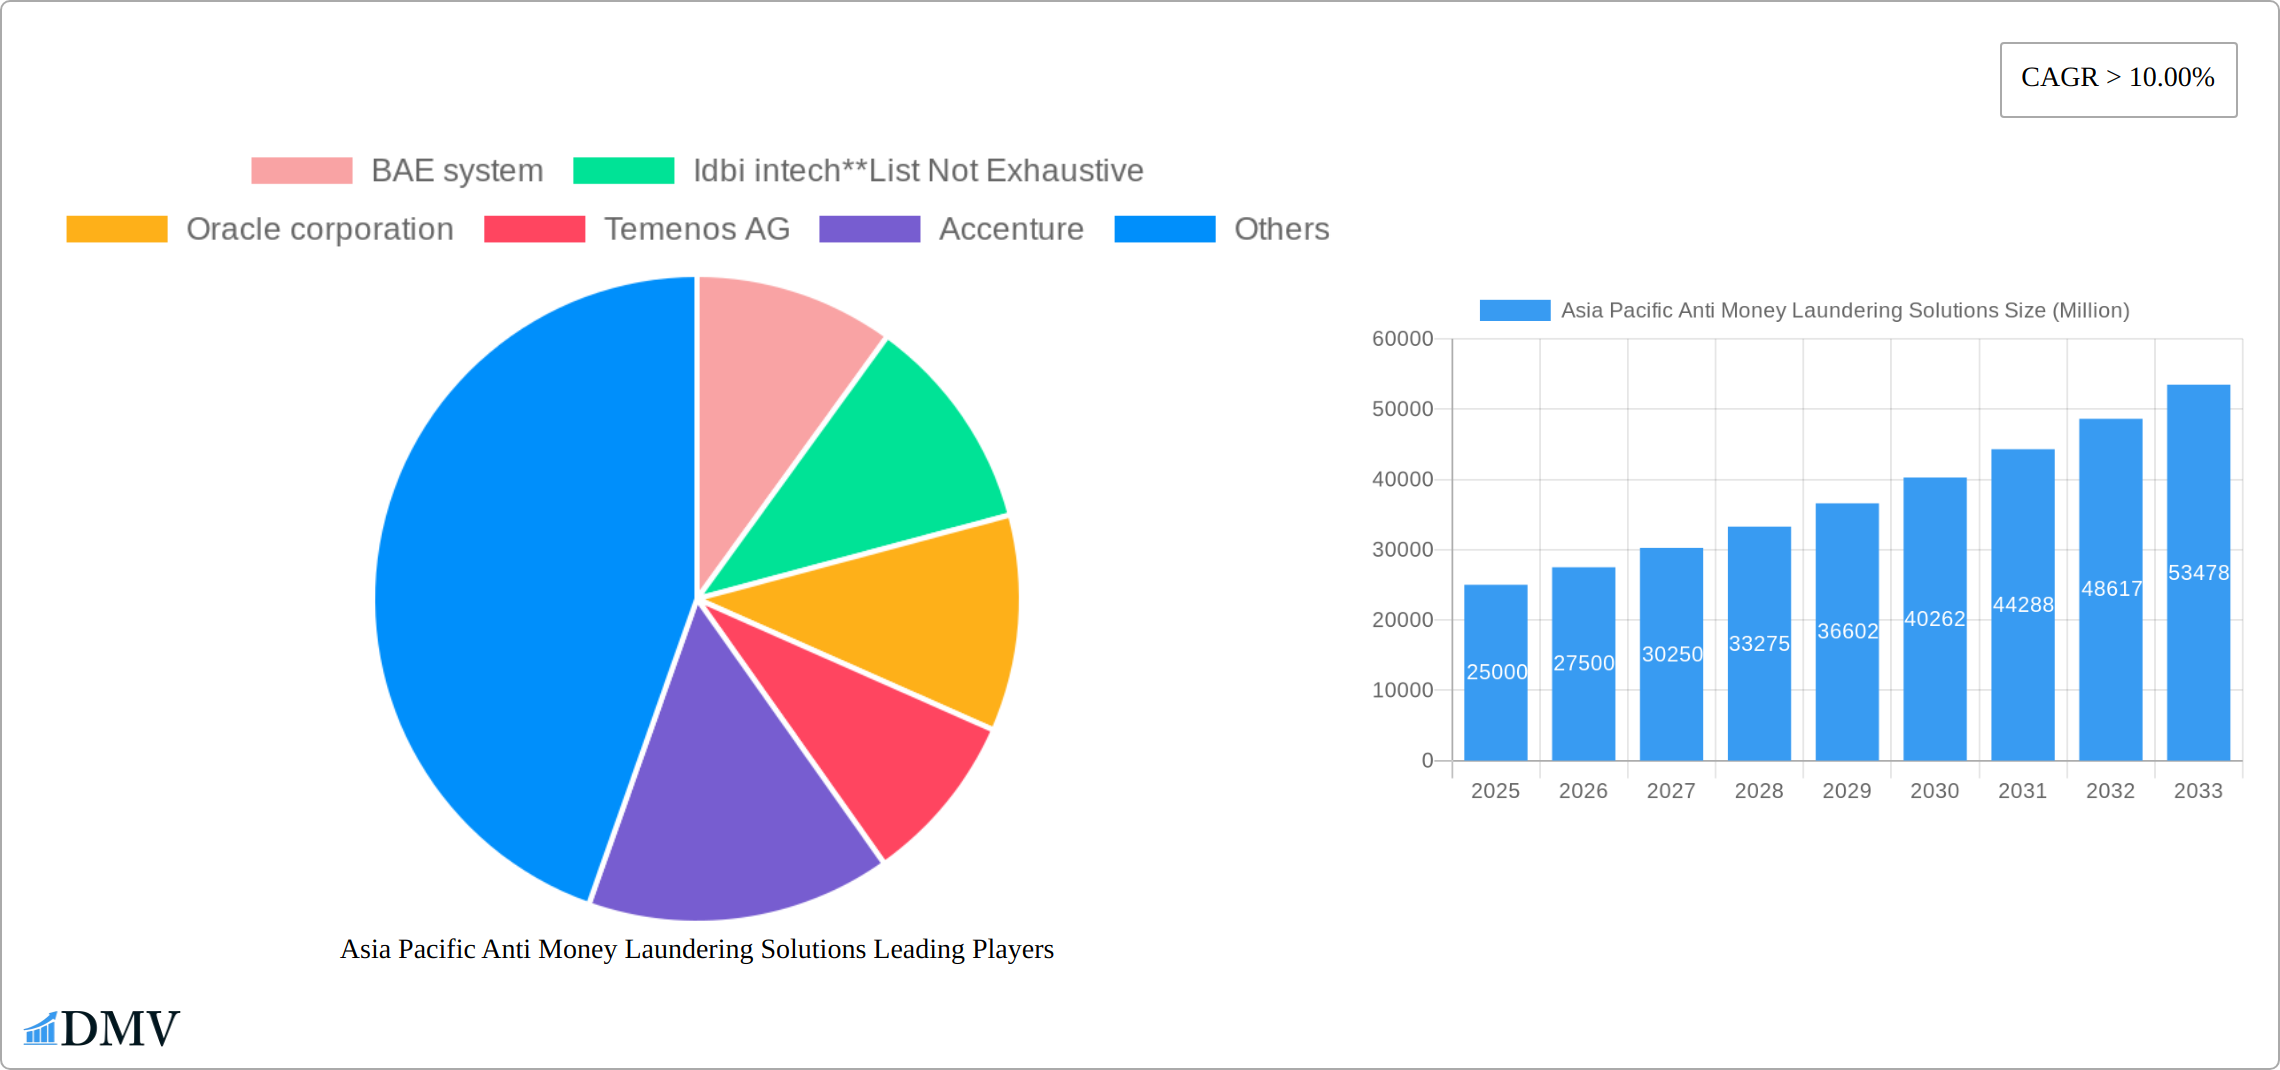
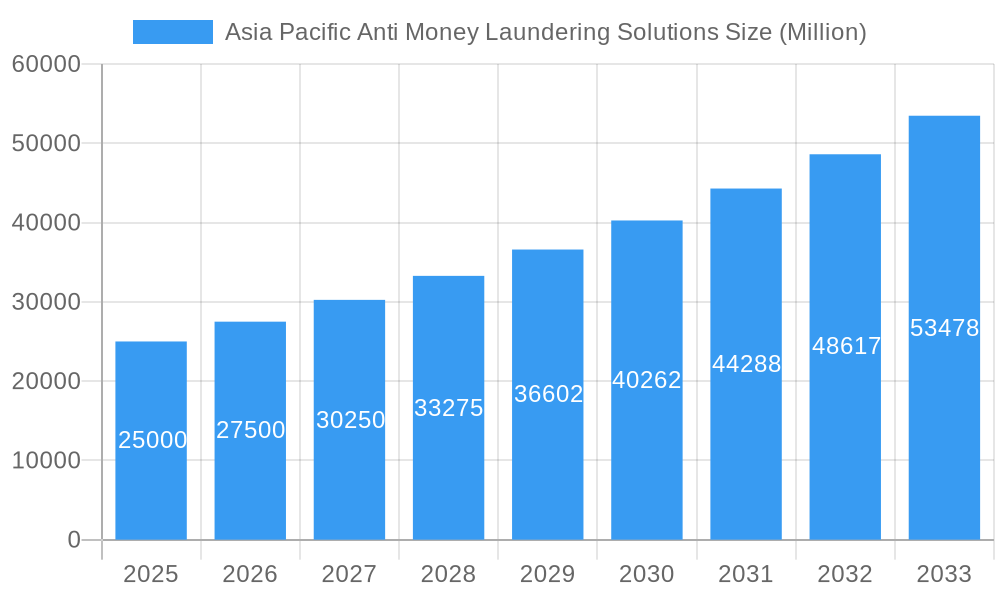
Asia Pacific Anti Money Laundering Solutions Market Size (In Billion)
Market segmentation highlights significant opportunities. The software segment is expected to lead due to its inherent flexibility and scalability, followed by services offering crucial implementation and maintenance support. Cloud deployment is gaining momentum, offering cost-effectiveness and enhanced accessibility. Within solutions, KYC systems and transaction monitoring are in high demand. Geographically, China and India represent the largest markets, fueled by their extensive populations and financial activity. However, Japan, Singapore, and Australia are also experiencing notable growth driven by increasing regulatory pressures and cross-border transactions. Despite challenges such as high implementation costs and system integration complexities, the market's growth trajectory remains strongly positive, underpinned by escalating regulatory scrutiny and continuous technological advancements. The competitive landscape features prominent players like BAE Systems, IBM, and Oracle, who are actively pursuing market share through innovation and strategic alliances.
Asia Pacific Anti Money Laundering Solutions Company Market Share
Asia Pacific Anti Money Laundering Solutions Market Composition & Trends
The Asia Pacific Anti Money Laundering (AML) Solutions market is characterized by a moderate level of concentration, with key players such as BAE Systems, Oracle Corporation, and IBM Corporation holding significant market shares. Market share distribution indicates that Oracle Corporation leads with an estimated 15% share, followed closely by IBM at 12%. The market is driven by innovation catalysts like the integration of artificial intelligence and machine learning into AML solutions, enhancing their capability to detect suspicious activities more efficiently. Regulatory landscapes across the region are tightening, with countries like China and Australia implementing stringent AML policies, which in turn fosters the adoption of advanced AML solutions. Substitute products, such as basic fraud detection software, are less effective, pushing the demand for specialized AML solutions. End-user profiles predominantly include the BFSI and IT & telecom sectors, which are increasingly investing in AML solutions to comply with regulations and safeguard their operations.
Market Share Distribution:
Oracle Corporation: 15%
IBM Corporation: 12%
Other Key Players: Varying shares up to 10%
M&A Activities:
In 2023, Accenture acquired xx, valued at $xx Million, to bolster its AML offerings.
Eastnets merged with xx in 2022, a deal worth $xx Million, enhancing its market presence.
The market also sees a rise in M&A activities as companies seek to expand their technological capabilities and geographical reach. These mergers and acquisitions are pivotal in shaping the competitive landscape, with deal values ranging from $xx Million to $xx Million, reflecting the strategic importance of AML solutions in the region.
Asia Pacific Anti Money Laundering Solutions Industry Evolution
The Asia Pacific AML Solutions market has witnessed significant evolution over the study period of 2019-2033, with a notable growth trajectory driven by technological advancements and shifting consumer demands. The market grew at a Compound Annual Growth Rate (CAGR) of 8.5% from 2019 to 2024, with the BFSI sector being the primary driver, accounting for 40% of the market's growth. The adoption of cloud-based AML solutions has surged, with cloud deployments growing at a rate of 12% annually, reflecting the industry's shift towards more flexible and scalable solutions. Technological advancements, such as the integration of AI and big data analytics, have revolutionized transaction monitoring and risk assessment, enabling more accurate and timely detection of money laundering activities. Consumer demands have shifted towards solutions that not only comply with regulatory requirements but also offer enhanced security and user experience. This shift has prompted companies like Temenos AG and Fiserv to invest heavily in R&D, resulting in innovative products that cater to these evolving needs. The market is expected to continue its growth trajectory, with a forecasted CAGR of 9.2% from 2025 to 2033, driven by ongoing technological innovations and increasing regulatory pressures.
Leading Regions, Countries, or Segments in Asia Pacific Anti Money Laundering Solutions
The Asia-Pacific Anti-Money Laundering (AML) solutions market is a dynamic landscape shaped by diverse regulatory environments and rapid technological advancements. While China remains a dominant force, accounting for an estimated 35% of the market in 2023 due to its substantial financial sector and rigorous regulatory framework (including the Anti-Money Laundering Law of the People's Republic of China), other key regions and countries are experiencing significant growth. This growth is fueled by increasing investments in fintech and AML technologies, particularly within the BFSI (Banking, Financial Services, and Insurance) sector. Investments in 2023 reached an estimated $XX Million, highlighting the significant commitment to combating financial crime.
The software segment continues to lead the market, with transaction monitoring solutions commanding a 50% share. This reflects the critical need for real-time monitoring and analysis of vast transaction volumes. Compliance reporting solutions hold a 25% share, underscoring the importance of adhering to increasingly complex regulatory demands. The cloud deployment model is experiencing robust growth, boasting a 15% annual growth rate, driven by its scalability and cost-effectiveness. The BFSI sector remains the primary adopter (40% market share), followed by the IT & Telecom sector (20%). However, growth is also evident in other sectors, including healthcare and retail, as awareness of AML compliance increases.
Beyond China, key growth areas include [Insert Specific Countries/Regions with supporting data and justification e.g., Singapore due to its robust fintech ecosystem, India due to its rapidly expanding digital economy, etc.]. These regions are characterized by [Describe common factors driving growth in these regions e.g., strong government initiatives, rising digitalization, increasing cross-border transactions, etc.].
Asia Pacific Anti Money Laundering Solutions Product Innovations
Product innovations in the Asia Pacific AML Solutions market are centered around enhancing detection capabilities and user experience. Companies like SAS Institute have introduced AI-driven transaction monitoring systems that significantly reduce false positives, improving operational efficiency. Oracle Corporation's latest compliance reporting solutions offer real-time insights and customizable reporting features, catering to the diverse needs of end-users. These innovations are characterized by their ability to integrate seamlessly with existing systems and provide actionable intelligence, setting them apart in a competitive market.
Propelling Factors for Asia Pacific Anti Money Laundering Solutions Growth
The growth of the Asia Pacific AML Solutions market is propelled by several key factors. Technological advancements, such as AI and machine learning, enhance the accuracy and efficiency of AML systems. Economic growth in the region, particularly in countries like China and India, increases the demand for robust financial security measures. Regulatory influences, including stricter AML laws and international compliance standards, drive the adoption of advanced solutions. For instance, Singapore's Monetary Authority has implemented stringent AML regulations, prompting financial institutions to invest in comprehensive AML solutions.
Obstacles in the Asia Pacific Anti Money Laundering Solutions Market
Despite significant growth potential, the Asia-Pacific AML solutions market faces challenges. Inconsistent regulatory requirements across different countries create complexities in deploying standardized solutions. Supply chain disruptions can impact the availability of critical components for AML systems. Furthermore, intense competition from both established players and emerging fintech companies can lead to price pressures and reduced profit margins. These factors necessitate strategic agility, innovative solutions, and robust risk management strategies for sustained success.
Future Opportunities in Asia Pacific Anti Money Laundering Solutions
The future of the Asia-Pacific AML solutions market is bright, driven by several key opportunities. Expansion into new sectors like healthcare and retail, fueled by increasing awareness of AML risks, presents significant potential. Technological advancements, including blockchain, artificial intelligence (AI), and advanced analytics, offer exciting avenues for developing more effective and efficient AML solutions. The continued surge in digital transactions and remote banking further strengthens the demand for sophisticated AML technologies, creating a favorable environment for innovative companies.
Major Players in the Asia Pacific Anti Money Laundering Solutions Ecosystem
Key Developments in Asia Pacific Anti Money Laundering Solutions Industry
- January 2023: Oracle Corporation launched new AML compliance reporting solutions, enhancing regulatory reporting capabilities across the region.
- March 2022: Accenture acquired [Company Name], expanding its AML offerings and strengthening its market position.
- June 2021: Eastnets merged with [Company Name], aiming to broaden its service portfolio and geographical reach.
- [Add 2-3 more recent and relevant key developments with dates and brief descriptions.]
Strategic Asia Pacific Anti Money Laundering Solutions Market Forecast
The Asia-Pacific AML solutions market is projected to experience robust growth, driven by technological innovation, intensifying regulatory scrutiny, and the expanding adoption of digital financial services. The market is expected to achieve a Compound Annual Growth Rate (CAGR) of 9.2% from 2025 to 2033. This growth will be fueled by the continued adoption of cloud-based solutions, the integration of AI and machine learning, and the expansion into new sectors. The increasing sophistication of financial crimes necessitates continuous innovation and adaptation within the AML solutions landscape.
Asia Pacific Anti Money Laundering Solutions Segmentation
-
1. Type
- 1.1. Software
- 1.2. Services
-
2. Deployment
- 2.1. On-premise
- 2.2. cloud
-
3. Solution
- 3.1. Know your customer systems
- 3.2. Compliance reporting
- 3.3. Transaction monitoring
- 3.4. Auditing & reporting
- 3.5. Other solutions
-
4. Industry
- 4.1. Healthcare
- 4.2. BFSI
- 4.3. Retail
- 4.4. IT & telecom
- 4.5. Government & others
Asia Pacific Anti Money Laundering Solutions Segmentation By Geography
-
1. Asia Pacific
- 1.1. China
- 1.2. Japan
- 1.3. South Korea
- 1.4. India
- 1.5. Australia
- 1.6. New Zealand
- 1.7. Indonesia
- 1.8. Malaysia
- 1.9. Singapore
- 1.10. Thailand
- 1.11. Vietnam
- 1.12. Philippines
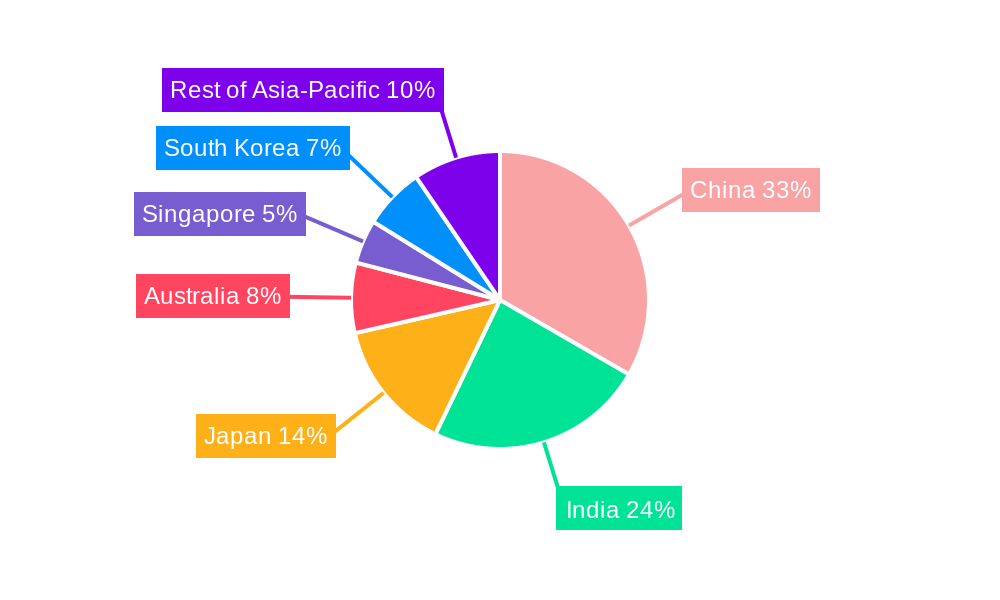
Asia Pacific Anti Money Laundering Solutions Regional Market Share
Geographic Coverage of Asia Pacific Anti Money Laundering Solutions
Asia Pacific Anti Money Laundering Solutions REPORT HIGHLIGHTS
| Aspects | Details |
|---|---|
| Study Period | 2020-2034 |
| Base Year | 2025 |
| Estimated Year | 2026 |
| Forecast Period | 2026-2034 |
| Historical Period | 2020-2025 |
| Growth Rate | CAGR of 17.8% from 2020-2034 |
| Segmentation |
|
Table of Contents
- 1. Introduction
- 1.1. Research Scope
- 1.2. Market Segmentation
- 1.3. Research Objective
- 1.4. Definitions and Assumptions
- 2. Executive Summary
- 2.1. Market Snapshot
- 3. Market Dynamics
- 3.1. Market Drivers
- 3.2. Market Restrains
- 3.3. Market Trends
- 3.4. Market Opportunities
- 4. Market Factor Analysis
- 4.1. Porters Five Forces
- 4.1.1. Bargaining Power of Suppliers
- 4.1.2. Bargaining Power of Buyers
- 4.1.3. Threat of New Entrants
- 4.1.4. Threat of Substitutes
- 4.1.5. Competitive Rivalry
- 4.2. PESTEL analysis
- 4.3. BCG Analysis
- 4.3.1. Stars (High Growth, High Market Share)
- 4.3.2. Cash Cows (Low Growth, High Market Share)
- 4.3.3. Question Mark (High Growth, Low Market Share)
- 4.3.4. Dogs (Low Growth, Low Market Share)
- 4.4. Ansoff Matrix Analysis
- 4.5. Supply Chain Analysis
- 4.6. Regulatory Landscape
- 4.7. Current Market Potential and Opportunity Assessment (TAM–SAM–SOM Framework)
- 4.8. DMV Analyst Note
- 4.1. Porters Five Forces
- 5. Market Analysis, Insights and Forecast 2021-2033
- 5.1. Market Analysis, Insights and Forecast - by Type
- 5.1.1. Software
- 5.1.2. Services
- 5.2. Market Analysis, Insights and Forecast - by Deployment
- 5.2.1. On-premise
- 5.2.2. cloud
- 5.3. Market Analysis, Insights and Forecast - by Solution
- 5.3.1. Know your customer systems
- 5.3.2. Compliance reporting
- 5.3.3. Transaction monitoring
- 5.3.4. Auditing & reporting
- 5.3.5. Other solutions
- 5.4. Market Analysis, Insights and Forecast - by Industry
- 5.4.1. Healthcare
- 5.4.2. BFSI
- 5.4.3. Retail
- 5.4.4. IT & telecom
- 5.4.5. Government & others
- 5.5. Market Analysis, Insights and Forecast - by Region
- 5.5.1. Asia Pacific
- 5.1. Market Analysis, Insights and Forecast - by Type
- 6. Asia Pacific Anti Money Laundering Solutions Analysis, Insights and Forecast, 2021-2033
- 6.1. Market Analysis, Insights and Forecast - by Type
- 6.1.1. Software
- 6.1.2. Services
- 6.2. Market Analysis, Insights and Forecast - by Deployment
- 6.2.1. On-premise
- 6.2.2. cloud
- 6.3. Market Analysis, Insights and Forecast - by Solution
- 6.3.1. Know your customer systems
- 6.3.2. Compliance reporting
- 6.3.3. Transaction monitoring
- 6.3.4. Auditing & reporting
- 6.3.5. Other solutions
- 6.4. Market Analysis, Insights and Forecast - by Industry
- 6.4.1. Healthcare
- 6.4.2. BFSI
- 6.4.3. Retail
- 6.4.4. IT & telecom
- 6.4.5. Government & others
- 6.1. Market Analysis, Insights and Forecast - by Type
- 7. Competitive Analysis
- 7.1. Company Profiles
- 7.1.1 BAE system
- 7.1.1.1. Company Overview
- 7.1.1.2. Products
- 7.1.1.3. Company Financials
- 7.1.1.4. SWOT Analysis
- 7.1.2 Idbi intech**List Not Exhaustive
- 7.1.2.1. Company Overview
- 7.1.2.2. Products
- 7.1.2.3. Company Financials
- 7.1.2.4. SWOT Analysis
- 7.1.3 Oracle corporation
- 7.1.3.1. Company Overview
- 7.1.3.2. Products
- 7.1.3.3. Company Financials
- 7.1.3.4. SWOT Analysis
- 7.1.4 Temenos AG
- 7.1.4.1. Company Overview
- 7.1.4.2. Products
- 7.1.4.3. Company Financials
- 7.1.4.4. SWOT Analysis
- 7.1.5 Accenture
- 7.1.5.1. Company Overview
- 7.1.5.2. Products
- 7.1.5.3. Company Financials
- 7.1.5.4. SWOT Analysis
- 7.1.6 Open text corporation
- 7.1.6.1. Company Overview
- 7.1.6.2. Products
- 7.1.6.3. Company Financials
- 7.1.6.4. SWOT Analysis
- 7.1.7 eastnets
- 7.1.7.1. Company Overview
- 7.1.7.2. Products
- 7.1.7.3. Company Financials
- 7.1.7.4. SWOT Analysis
- 7.1.8 ACI worldwide
- 7.1.8.1. Company Overview
- 7.1.8.2. Products
- 7.1.8.3. Company Financials
- 7.1.8.4. SWOT Analysis
- 7.1.9 IBM corporation
- 7.1.9.1. Company Overview
- 7.1.9.2. Products
- 7.1.9.3. Company Financials
- 7.1.9.4. SWOT Analysis
- 7.1.10 SAS Institute
- 7.1.10.1. Company Overview
- 7.1.10.2. Products
- 7.1.10.3. Company Financials
- 7.1.10.4. SWOT Analysis
- 7.1.11 Fiserv
- 7.1.11.1. Company Overview
- 7.1.11.2. Products
- 7.1.11.3. Company Financials
- 7.1.11.4. SWOT Analysis
- 7.1.12 NICE systems
- 7.1.12.1. Company Overview
- 7.1.12.2. Products
- 7.1.12.3. Company Financials
- 7.1.12.4. SWOT Analysis
- 7.1.1 BAE system
- 7.2. Market Entropy
- 7.2.1 Company's Key Areas Served
- 7.2.2 Recent Developments
- 7.3. Company Market Share Analysis 2025
- 7.3.1 Top 5 Companies Market Share Analysis
- 7.3.2 Top 3 Companies Market Share Analysis
- 7.4. List of Potential Customers
- 8. Research Methodology
List of Figures
- Figure 1: Asia Pacific Anti Money Laundering Solutions Revenue Breakdown (billion, %) by Product 2025 & 2033
- Figure 2: Asia Pacific Anti Money Laundering Solutions Share (%) by Company 2025
List of Tables
- Table 1: Asia Pacific Anti Money Laundering Solutions Revenue billion Forecast, by Type 2020 & 2033
- Table 2: Asia Pacific Anti Money Laundering Solutions Revenue billion Forecast, by Deployment 2020 & 2033
- Table 3: Asia Pacific Anti Money Laundering Solutions Revenue billion Forecast, by Solution 2020 & 2033
- Table 4: Asia Pacific Anti Money Laundering Solutions Revenue billion Forecast, by Industry 2020 & 2033
- Table 5: Asia Pacific Anti Money Laundering Solutions Revenue billion Forecast, by Region 2020 & 2033
- Table 6: Asia Pacific Anti Money Laundering Solutions Revenue billion Forecast, by Type 2020 & 2033
- Table 7: Asia Pacific Anti Money Laundering Solutions Revenue billion Forecast, by Deployment 2020 & 2033
- Table 8: Asia Pacific Anti Money Laundering Solutions Revenue billion Forecast, by Solution 2020 & 2033
- Table 9: Asia Pacific Anti Money Laundering Solutions Revenue billion Forecast, by Industry 2020 & 2033
- Table 10: Asia Pacific Anti Money Laundering Solutions Revenue billion Forecast, by Country 2020 & 2033
- Table 11: China Asia Pacific Anti Money Laundering Solutions Revenue (billion) Forecast, by Application 2020 & 2033
- Table 12: Japan Asia Pacific Anti Money Laundering Solutions Revenue (billion) Forecast, by Application 2020 & 2033
- Table 13: South Korea Asia Pacific Anti Money Laundering Solutions Revenue (billion) Forecast, by Application 2020 & 2033
- Table 14: India Asia Pacific Anti Money Laundering Solutions Revenue (billion) Forecast, by Application 2020 & 2033
- Table 15: Australia Asia Pacific Anti Money Laundering Solutions Revenue (billion) Forecast, by Application 2020 & 2033
- Table 16: New Zealand Asia Pacific Anti Money Laundering Solutions Revenue (billion) Forecast, by Application 2020 & 2033
- Table 17: Indonesia Asia Pacific Anti Money Laundering Solutions Revenue (billion) Forecast, by Application 2020 & 2033
- Table 18: Malaysia Asia Pacific Anti Money Laundering Solutions Revenue (billion) Forecast, by Application 2020 & 2033
- Table 19: Singapore Asia Pacific Anti Money Laundering Solutions Revenue (billion) Forecast, by Application 2020 & 2033
- Table 20: Thailand Asia Pacific Anti Money Laundering Solutions Revenue (billion) Forecast, by Application 2020 & 2033
- Table 21: Vietnam Asia Pacific Anti Money Laundering Solutions Revenue (billion) Forecast, by Application 2020 & 2033
- Table 22: Philippines Asia Pacific Anti Money Laundering Solutions Revenue (billion) Forecast, by Application 2020 & 2033
Frequently Asked Questions
1. What is the projected Compound Annual Growth Rate (CAGR) of the Asia Pacific Anti Money Laundering Solutions?
The projected CAGR is approximately 17.8%.
2. Which companies are prominent players in the Asia Pacific Anti Money Laundering Solutions?
Key companies in the market include BAE system, Idbi intech**List Not Exhaustive, Oracle corporation, Temenos AG, Accenture, Open text corporation, eastnets, ACI worldwide, IBM corporation, SAS Institute, Fiserv, NICE systems.
3. What are the main segments of the Asia Pacific Anti Money Laundering Solutions?
The market segments include Type, Deployment, Solution, Industry.
4. Can you provide details about the market size?
The market size is estimated to be USD 4.13 billion as of 2022.
5. What are some drivers contributing to market growth?
Embedded Insurance is Driving the Market.
6. What are the notable trends driving market growth?
Rise in the Volume of Wired Transactions Driving the Market.
7. Are there any restraints impacting market growth?
Inflation is Restraining the Property and Casualty Insurance Market of Singapore.
8. Can you provide examples of recent developments in the market?
N/A
9. What pricing options are available for accessing the report?
Pricing options include single-user, multi-user, and enterprise licenses priced at USD 3800, USD 4500, and USD 5800 respectively.
10. Is the market size provided in terms of value or volume?
The market size is provided in terms of value, measured in billion.
11. Are there any specific market keywords associated with the report?
Yes, the market keyword associated with the report is "Asia Pacific Anti Money Laundering Solutions," which aids in identifying and referencing the specific market segment covered.
12. How do I determine which pricing option suits my needs best?
The pricing options vary based on user requirements and access needs. Individual users may opt for single-user licenses, while businesses requiring broader access may choose multi-user or enterprise licenses for cost-effective access to the report.
13. Are there any additional resources or data provided in the Asia Pacific Anti Money Laundering Solutions report?
While the report offers comprehensive insights, it's advisable to review the specific contents or supplementary materials provided to ascertain if additional resources or data are available.
14. How can I stay updated on further developments or reports in the Asia Pacific Anti Money Laundering Solutions?
To stay informed about further developments, trends, and reports in the Asia Pacific Anti Money Laundering Solutions, consider subscribing to industry newsletters, following relevant companies and organizations, or regularly checking reputable industry news sources and publications.
Methodology
Step 1 - Identification of Relevant Samples Size from Population Database


Step 2 - Approaches for Defining Global Market Size (Value, Volume* & Price*)

Note*: In applicable scenarios
Step 3 - Data Sources
Primary Research
- Web Analytics
- Survey Reports
- Research Institute
- Latest Research Reports
- Opinion Leaders
Secondary Research
- Annual Reports
- White Paper
- Latest Press Release
- Industry Association
- Paid Database
- Investor Presentations

Step 4 - Data Triangulation
Involves using different sources of information in order to increase the validity of a study
These sources are likely to be stakeholders in a program - participants, other researchers, program staff, other community members, and so on.
Then we put all data in single framework & apply various statistical tools to find out the dynamic on the market.
During the analysis stage, feedback from the stakeholder groups would be compared to determine areas of agreement as well as areas of divergence