

Key Insights
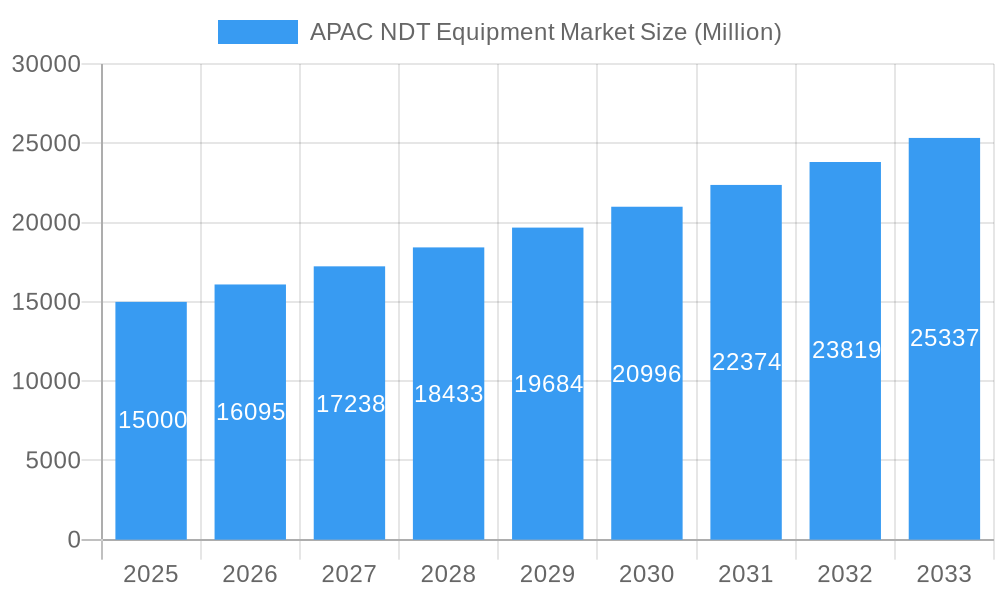
The Asia-Pacific (APAC) Non-Destructive Testing (NDT) equipment market is poised for significant expansion, driven by extensive infrastructure development across key economies such as China, India, and Japan. Heightened demand for stringent quality control and assurance in vital sectors including oil & gas, power & energy, and construction is accelerating the adoption of advanced NDT methodologies. Magnetic Particle Testing and Eddy Current Testing are anticipated to gain substantial market share due to their proven efficacy in identifying surface and subsurface material defects. The market is also trending towards automated and digitized NDT solutions, boosting operational efficiency and precision. While initial investment in advanced equipment and the requirement for skilled personnel present challenges, the market outlook is robust. The projected compound annual growth rate (CAGR) of 7.23% indicates substantial market value growth from the base year 2025 through 2033. Strong economic performance in numerous APAC nations, coupled with government support for infrastructure projects and industrial safety, are critical drivers of this optimistic trajectory. Increased awareness of safety regulations and the imperative to mitigate operational risks across diverse industries are further stimulating the uptake of reliable NDT equipment. The market size is estimated to reach 5 billion by 2033.
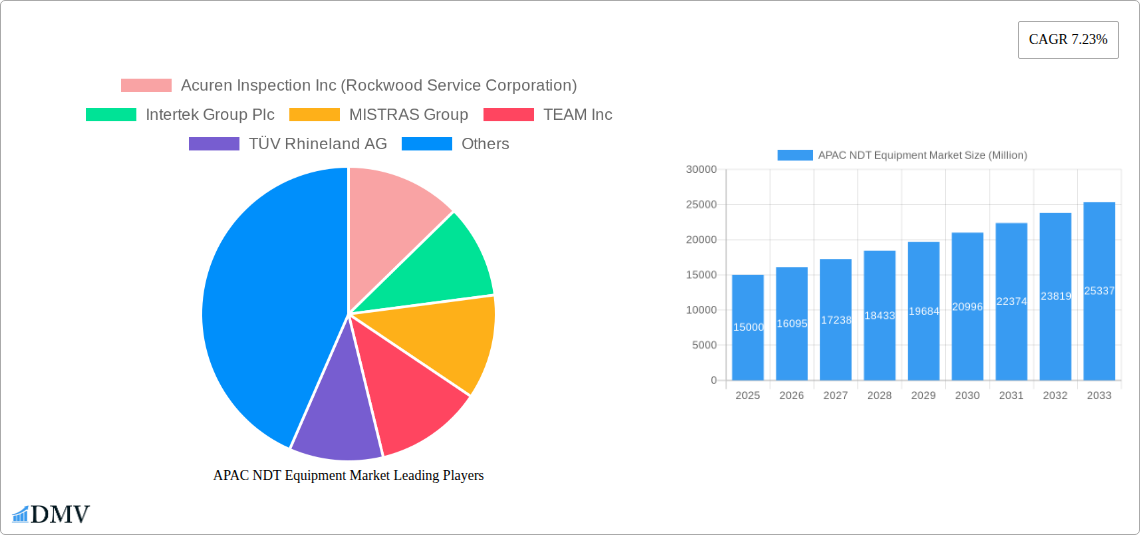
APAC NDT Equipment Market Market Size (In Billion)
Technological innovations, including the introduction of novel techniques and portable equipment, are enhancing the accessibility and cost-effectiveness of NDT. Intensifying competition among established and emerging vendors is expected to foster product enhancement, cost optimization, and expanded service portfolios. Market segmentation reveals significant contributions from various end-user industries, with oil & gas currently leading demand. However, the construction and automotive sectors are also demonstrating considerable growth potential, contributing to market expansion throughout the APAC region. Despite potential challenges such as labor shortages and economic volatility, the APAC NDT equipment market offers compelling opportunities for manufacturers, distributors, and service providers.
APAC NDT Equipment Market Company Market Share
APAC NDT Equipment Market: A Comprehensive Report (2019-2033)
This insightful report provides a detailed analysis of the Asia-Pacific Non-Destructive Testing (NDT) Equipment market, offering a comprehensive overview of market dynamics, growth drivers, and future opportunities from 2019 to 2033. The report covers key segments, including technology types (Radiography Testing, Ultrasonic Testing, Magnetic Particle Testing, Liquid Penetrant Testing, Visual Inspection, Eddy Current Testing, and Other Technologies) and end-users (Oil & Gas, Power & Energy, Construction, Automotive & Transportation, Aerospace & Defense, and Other End-users) across major APAC countries like China, Japan, India, South Korea, Singapore, Indonesia, and others (Thailand, Malaysia, etc.). With a base year of 2025 and a forecast period extending to 2033, this report is an invaluable resource for stakeholders seeking to understand and capitalize on the growth potential within this dynamic market. The estimated market value in 2025 is xx Million.
APAC NDT Equipment Market Composition & Trends
The APAC NDT equipment market is characterized by a moderately concentrated landscape, with several multinational corporations and regional players vying for market share. Market share distribution in 2024 showed the top 5 players holding approximately xx% of the market, with the remaining share distributed among numerous smaller players. Innovation is a key driver, with continuous advancements in technologies like ultrasonic testing and eddy current testing leading to improved accuracy, efficiency, and portability. The regulatory landscape is evolving, with increasing emphasis on safety and quality standards across various industries, driving demand for advanced NDT equipment. Substitute products are limited, with NDT methods often being the only feasible option for evaluating the integrity of materials and components without causing damage. End-user profiles vary widely, reflecting the diverse industrial landscape of the region. Significant M&A activities have been observed in the recent past, though precise deal values are not publicly disclosed in many cases, indicating a trend toward consolidation within the market.
- Market Concentration: Moderately concentrated, top 5 players holding approximately xx% of market share in 2024.
- Innovation Catalysts: Advancements in ultrasonic and eddy current testing technologies.
- Regulatory Landscape: Increasing emphasis on safety and quality standards.
- Substitute Products: Limited viable alternatives to NDT methods.
- End-User Profiles: Diverse across various industries (Oil & Gas, Power & Energy, Construction etc.).
- M&A Activity: Significant consolidation observed, with xx Million estimated value of M&A deals during 2020-2024 (estimated figure).
APAC NDT Equipment Market Industry Evolution
The APAC NDT equipment market has witnessed robust growth over the historical period (2019-2024), with a Compound Annual Growth Rate (CAGR) of xx%. This growth is primarily attributed to the increasing investments in infrastructure projects, particularly in the construction, energy, and transportation sectors across the region. Technological advancements, such as the development of more portable and user-friendly equipment, have also contributed significantly to market expansion. The rising adoption of advanced NDT techniques, driven by the need for improved quality control and safety, is another key factor. Shifting consumer demands, with a preference for higher precision and efficiency in inspection processes, are influencing product development and market strategies. Furthermore, stringent government regulations regarding safety and quality standards are encouraging the adoption of modern NDT technologies. The forecast period (2025-2033) projects continued growth, albeit at a slightly moderated pace, with a projected CAGR of xx%, driven by sustained investments in infrastructure development and ongoing technological innovations. Adoption rates for advanced technologies like phased array ultrasonic testing and digital radiography are expected to increase significantly during this period.
Leading Regions, Countries, or Segments in APAP NDT Equipment Market
The APAC NDT equipment market is dominated by China, driven by its substantial industrial base and rapid infrastructure development. Other significant markets include Japan, India, and South Korea.
- China: Key drivers include massive infrastructure projects, growing manufacturing sector, and stringent quality control regulations.
- Japan: Strong presence of advanced technology providers, high adoption rates of sophisticated NDT methods in various industries.
- India: Rapid industrialization and infrastructural development, growing demand for NDT services in energy, construction, and transportation sectors.
- South Korea: Significant investments in advanced manufacturing and industrial automation, increasing the need for precise NDT solutions.
Within technology types, Ultrasonic Testing and Radiography Testing hold the largest market shares due to their widespread applicability and established reliability. The Oil & Gas and Power & Energy sectors are the leading end-users, driving demand for advanced NDT equipment for pipeline inspection, power plant maintenance, and asset integrity management.
APAC NDT Equipment Market Product Innovations
Recent product innovations focus on enhancing portability, improving image quality (in radiography), increasing automation, and integrating advanced data analytics capabilities. New systems offer real-time data analysis and remote inspection capabilities, improving efficiency and reducing operational costs. For example, the introduction of phased array ultrasonic testing (PAUT) systems with improved flaw detection capabilities enhances the accuracy and speed of inspections. The development of advanced software for data analysis and reporting facilitates better interpretation of inspection results and facilitates better decision-making.
Propelling Factors for APAC NDT Equipment Market Growth
Several factors contribute to the growth of the APAC NDT equipment market. These include:
- Technological advancements: The development of more sophisticated and efficient NDT technologies, such as PAUT and digital radiography.
- Economic growth: The continued economic expansion of several APAC nations fuels infrastructure development and industrial activity, driving demand for NDT services.
- Stringent regulatory frameworks: Governments are increasingly enforcing stricter safety and quality standards, mandating the use of reliable NDT techniques.
Obstacles in the APAC NDT Equipment Market
Challenges to market growth include:
- High initial investment costs: The purchase and implementation of advanced NDT equipment can be expensive, posing a barrier for some companies.
- Skilled labor shortage: A lack of trained personnel to operate and interpret data from sophisticated NDT equipment can hinder market expansion.
- Supply chain disruptions: Global supply chain issues have impacted the availability and pricing of NDT equipment components and accessories.
Future Opportunities in APAC NDT Equipment Market
Future opportunities lie in:
- Expansion into emerging markets: Untapped potential exists in smaller economies across the APAC region with growing industrial activities.
- Development of specialized NDT solutions: Addressing specific industry needs, for example, advanced NDT for additive manufacturing inspections, will drive market demand.
- Adoption of AI and machine learning: Integrating AI and machine learning algorithms into NDT systems can enhance data analysis and flaw detection accuracy.
Major Players in the APAC NDT Equipment Market Ecosystem
- Acuren Inspection Inc (Rockwood Service Corporation)
- Intertek Group Plc
- MISTRAS Group
- TEAM Inc
- TÜV Rhineland AG
- Zetec Inc
- SGS Group
- Bureau Veritas S A
- Nikon Metrology NV
- Fujifilm Corporation
- Olympus Corporation
- Magnaflux Corp
- NCS Testing Technology Co Limited
- GE Measurement and Control
- Applus Services S A
- YXLON International Gmbh ( COMET Group)
Key Developments in APAC NDT Equipment Industry
- April 2021: Nikon Corporation launched the Lasermeister 102A, a new optical processing system for titanium alloy additive manufacturing, enhancing precision in material processing and inspection needs.
- April 2021: Nikon Corporation released a "Remote Control SDK" for its NEXIV CNC Video Measuring System, improving efficiency and remote inspection capabilities for electronic and semiconductor components.
- April 2021: Bureau Veritas joined the Task Force on Climate-related Financial Disclosures (TCFD), demonstrating commitment to environmental sustainability and influencing the industry’s approach to climate-related risks.
- April 2021: Carnival Corporation partnered with Bureau Veritas for health and safety services (including NDT), signifying the growing importance of NDT in ensuring safety and operational compliance across various sectors.
Strategic APAC NDT Equipment Market Forecast
The APAC NDT equipment market is poised for sustained growth over the forecast period (2025-2033), driven by ongoing infrastructure development, industrial expansion, and the adoption of advanced NDT technologies. Opportunities abound in specialized NDT solutions for emerging industries like additive manufacturing and renewable energy. The market’s evolution is expected to be shaped by technological innovations, increasing regulatory compliance, and the rise of data-driven inspection practices. This presents significant potential for market players to capitalize on technological advancements and growing demand for reliable and efficient NDT solutions across the region.
APAC NDT Equipment Market Segmentation
-
1. Technology Type
- 1.1. Radiography Testing
- 1.2. Ultrasonic Testing
- 1.3. Magnetic Particle Testing*
- 1.4. Liquid Penetrant Testing
- 1.5. Visual Inspection
- 1.6. Eddy Current Testing*
- 1.7. Other Technologies
-
2. End-user
- 2.1. Oil & Gas
- 2.2. Power & Energy
- 2.3. Construction
- 2.4. Automotive & Transportation
- 2.5. Aerospace & Defense
- 2.6. Other End-users
APAC NDT Equipment Market Segmentation By Geography
-
1. North America
- 1.1. United States
- 1.2. Canada
- 1.3. Mexico
-
2. South America
- 2.1. Brazil
- 2.2. Argentina
- 2.3. Rest of South America
-
3. Europe
- 3.1. United Kingdom
- 3.2. Germany
- 3.3. France
- 3.4. Italy
- 3.5. Spain
- 3.6. Russia
- 3.7. Benelux
- 3.8. Nordics
- 3.9. Rest of Europe
-
4. Middle East & Africa
- 4.1. Turkey
- 4.2. Israel
- 4.3. GCC
- 4.4. North Africa
- 4.5. South Africa
- 4.6. Rest of Middle East & Africa
-
5. Asia Pacific
- 5.1. China
- 5.2. India
- 5.3. Japan
- 5.4. South Korea
- 5.5. ASEAN
- 5.6. Oceania
- 5.7. Rest of Asia Pacific
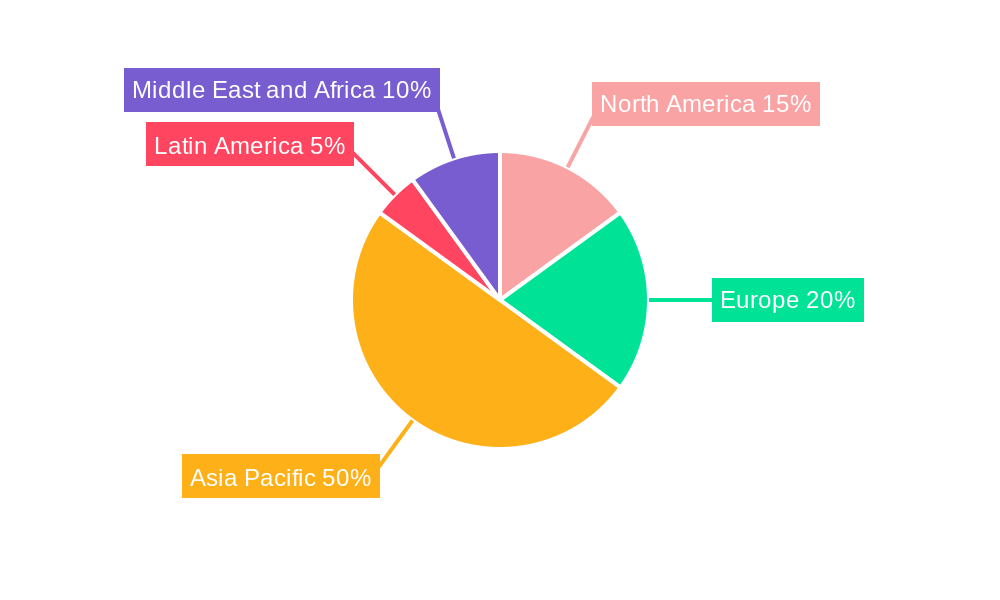
APAC NDT Equipment Market Regional Market Share
Geographic Coverage of APAC NDT Equipment Market
APAC NDT Equipment Market REPORT HIGHLIGHTS
| Aspects | Details |
|---|---|
| Study Period | 2020-2034 |
| Base Year | 2025 |
| Estimated Year | 2026 |
| Forecast Period | 2026-2034 |
| Historical Period | 2020-2025 |
| Growth Rate | CAGR of 7.23% from 2020-2034 |
| Segmentation |
|
Table of Contents
- 1. Introduction
- 1.1. Research Scope
- 1.2. Market Segmentation
- 1.3. Research Objective
- 1.4. Definitions and Assumptions
- 2. Executive Summary
- 2.1. Market Snapshot
- 3. Market Dynamics
- 3.1. Market Drivers
- 3.2. Market Restrains
- 3.3. Market Trends
- 3.4. Market Opportunities
- 4. Market Factor Analysis
- 4.1. Porters Five Forces
- 4.1.1. Bargaining Power of Suppliers
- 4.1.2. Bargaining Power of Buyers
- 4.1.3. Threat of New Entrants
- 4.1.4. Threat of Substitutes
- 4.1.5. Competitive Rivalry
- 4.2. PESTEL analysis
- 4.3. BCG Analysis
- 4.3.1. Stars (High Growth, High Market Share)
- 4.3.2. Cash Cows (Low Growth, High Market Share)
- 4.3.3. Question Mark (High Growth, Low Market Share)
- 4.3.4. Dogs (Low Growth, Low Market Share)
- 4.4. Ansoff Matrix Analysis
- 4.5. Supply Chain Analysis
- 4.6. Regulatory Landscape
- 4.7. Current Market Potential and Opportunity Assessment (TAM–SAM–SOM Framework)
- 4.8. DMV Analyst Note
- 4.1. Porters Five Forces
- 5. Market Analysis, Insights and Forecast 2021-2033
- 5.1. Market Analysis, Insights and Forecast - by Technology Type
- 5.1.1. Radiography Testing
- 5.1.2. Ultrasonic Testing
- 5.1.3. Magnetic Particle Testing*
- 5.1.4. Liquid Penetrant Testing
- 5.1.5. Visual Inspection
- 5.1.6. Eddy Current Testing*
- 5.1.7. Other Technologies
- 5.2. Market Analysis, Insights and Forecast - by End-user
- 5.2.1. Oil & Gas
- 5.2.2. Power & Energy
- 5.2.3. Construction
- 5.2.4. Automotive & Transportation
- 5.2.5. Aerospace & Defense
- 5.2.6. Other End-users
- 5.3. Market Analysis, Insights and Forecast - by Region
- 5.3.1. North America
- 5.3.2. South America
- 5.3.3. Europe
- 5.3.4. Middle East & Africa
- 5.3.5. Asia Pacific
- 5.1. Market Analysis, Insights and Forecast - by Technology Type
- 6. Global APAC NDT Equipment Market Analysis, Insights and Forecast, 2021-2033
- 6.1. Market Analysis, Insights and Forecast - by Technology Type
- 6.1.1. Radiography Testing
- 6.1.2. Ultrasonic Testing
- 6.1.3. Magnetic Particle Testing*
- 6.1.4. Liquid Penetrant Testing
- 6.1.5. Visual Inspection
- 6.1.6. Eddy Current Testing*
- 6.1.7. Other Technologies
- 6.2. Market Analysis, Insights and Forecast - by End-user
- 6.2.1. Oil & Gas
- 6.2.2. Power & Energy
- 6.2.3. Construction
- 6.2.4. Automotive & Transportation
- 6.2.5. Aerospace & Defense
- 6.2.6. Other End-users
- 6.1. Market Analysis, Insights and Forecast - by Technology Type
- 7. North America APAC NDT Equipment Market Analysis, Insights and Forecast, 2020-2032
- 7.1. Market Analysis, Insights and Forecast - by Technology Type
- 7.1.1. Radiography Testing
- 7.1.2. Ultrasonic Testing
- 7.1.3. Magnetic Particle Testing*
- 7.1.4. Liquid Penetrant Testing
- 7.1.5. Visual Inspection
- 7.1.6. Eddy Current Testing*
- 7.1.7. Other Technologies
- 7.2. Market Analysis, Insights and Forecast - by End-user
- 7.2.1. Oil & Gas
- 7.2.2. Power & Energy
- 7.2.3. Construction
- 7.2.4. Automotive & Transportation
- 7.2.5. Aerospace & Defense
- 7.2.6. Other End-users
- 7.1. Market Analysis, Insights and Forecast - by Technology Type
- 8. South America APAC NDT Equipment Market Analysis, Insights and Forecast, 2020-2032
- 8.1. Market Analysis, Insights and Forecast - by Technology Type
- 8.1.1. Radiography Testing
- 8.1.2. Ultrasonic Testing
- 8.1.3. Magnetic Particle Testing*
- 8.1.4. Liquid Penetrant Testing
- 8.1.5. Visual Inspection
- 8.1.6. Eddy Current Testing*
- 8.1.7. Other Technologies
- 8.2. Market Analysis, Insights and Forecast - by End-user
- 8.2.1. Oil & Gas
- 8.2.2. Power & Energy
- 8.2.3. Construction
- 8.2.4. Automotive & Transportation
- 8.2.5. Aerospace & Defense
- 8.2.6. Other End-users
- 8.1. Market Analysis, Insights and Forecast - by Technology Type
- 9. Europe APAC NDT Equipment Market Analysis, Insights and Forecast, 2020-2032
- 9.1. Market Analysis, Insights and Forecast - by Technology Type
- 9.1.1. Radiography Testing
- 9.1.2. Ultrasonic Testing
- 9.1.3. Magnetic Particle Testing*
- 9.1.4. Liquid Penetrant Testing
- 9.1.5. Visual Inspection
- 9.1.6. Eddy Current Testing*
- 9.1.7. Other Technologies
- 9.2. Market Analysis, Insights and Forecast - by End-user
- 9.2.1. Oil & Gas
- 9.2.2. Power & Energy
- 9.2.3. Construction
- 9.2.4. Automotive & Transportation
- 9.2.5. Aerospace & Defense
- 9.2.6. Other End-users
- 9.1. Market Analysis, Insights and Forecast - by Technology Type
- 10. Middle East & Africa APAC NDT Equipment Market Analysis, Insights and Forecast, 2020-2032
- 10.1. Market Analysis, Insights and Forecast - by Technology Type
- 10.1.1. Radiography Testing
- 10.1.2. Ultrasonic Testing
- 10.1.3. Magnetic Particle Testing*
- 10.1.4. Liquid Penetrant Testing
- 10.1.5. Visual Inspection
- 10.1.6. Eddy Current Testing*
- 10.1.7. Other Technologies
- 10.2. Market Analysis, Insights and Forecast - by End-user
- 10.2.1. Oil & Gas
- 10.2.2. Power & Energy
- 10.2.3. Construction
- 10.2.4. Automotive & Transportation
- 10.2.5. Aerospace & Defense
- 10.2.6. Other End-users
- 10.1. Market Analysis, Insights and Forecast - by Technology Type
- 11. Asia Pacific APAC NDT Equipment Market Analysis, Insights and Forecast, 2020-2032
- 11.1. Market Analysis, Insights and Forecast - by Technology Type
- 11.1.1. Radiography Testing
- 11.1.2. Ultrasonic Testing
- 11.1.3. Magnetic Particle Testing*
- 11.1.4. Liquid Penetrant Testing
- 11.1.5. Visual Inspection
- 11.1.6. Eddy Current Testing*
- 11.1.7. Other Technologies
- 11.2. Market Analysis, Insights and Forecast - by End-user
- 11.2.1. Oil & Gas
- 11.2.2. Power & Energy
- 11.2.3. Construction
- 11.2.4. Automotive & Transportation
- 11.2.5. Aerospace & Defense
- 11.2.6. Other End-users
- 11.1. Market Analysis, Insights and Forecast - by Technology Type
- 12. Competitive Analysis
- 12.1. Company Profiles
- 12.1.1 Acuren Inspection Inc (Rockwood Service Corporation)
- 12.1.1.1. Company Overview
- 12.1.1.2. Products
- 12.1.1.3. Company Financials
- 12.1.1.4. SWOT Analysis
- 12.1.2 Intertek Group Plc
- 12.1.2.1. Company Overview
- 12.1.2.2. Products
- 12.1.2.3. Company Financials
- 12.1.2.4. SWOT Analysis
- 12.1.3 MISTRAS Group
- 12.1.3.1. Company Overview
- 12.1.3.2. Products
- 12.1.3.3. Company Financials
- 12.1.3.4. SWOT Analysis
- 12.1.4 TEAM Inc
- 12.1.4.1. Company Overview
- 12.1.4.2. Products
- 12.1.4.3. Company Financials
- 12.1.4.4. SWOT Analysis
- 12.1.5 TÜV Rhineland AG
- 12.1.5.1. Company Overview
- 12.1.5.2. Products
- 12.1.5.3. Company Financials
- 12.1.5.4. SWOT Analysis
- 12.1.6 Zetec Inc *List Not Exhaustive
- 12.1.6.1. Company Overview
- 12.1.6.2. Products
- 12.1.6.3. Company Financials
- 12.1.6.4. SWOT Analysis
- 12.1.7 SGS Group
- 12.1.7.1. Company Overview
- 12.1.7.2. Products
- 12.1.7.3. Company Financials
- 12.1.7.4. SWOT Analysis
- 12.1.8 Bureau Veritas S A
- 12.1.8.1. Company Overview
- 12.1.8.2. Products
- 12.1.8.3. Company Financials
- 12.1.8.4. SWOT Analysis
- 12.1.9 Nikon Metrology NV
- 12.1.9.1. Company Overview
- 12.1.9.2. Products
- 12.1.9.3. Company Financials
- 12.1.9.4. SWOT Analysis
- 12.1.10 Fujifilm Corporation
- 12.1.10.1. Company Overview
- 12.1.10.2. Products
- 12.1.10.3. Company Financials
- 12.1.10.4. SWOT Analysis
- 12.1.11 Olympus Corporation
- 12.1.11.1. Company Overview
- 12.1.11.2. Products
- 12.1.11.3. Company Financials
- 12.1.11.4. SWOT Analysis
- 12.1.12 Magnaflux Corp
- 12.1.12.1. Company Overview
- 12.1.12.2. Products
- 12.1.12.3. Company Financials
- 12.1.12.4. SWOT Analysis
- 12.1.13 NCS Testing Technology Co Limited
- 12.1.13.1. Company Overview
- 12.1.13.2. Products
- 12.1.13.3. Company Financials
- 12.1.13.4. SWOT Analysis
- 12.1.14 GE Measurement and Control
- 12.1.14.1. Company Overview
- 12.1.14.2. Products
- 12.1.14.3. Company Financials
- 12.1.14.4. SWOT Analysis
- 12.1.15 Applus Services S A
- 12.1.15.1. Company Overview
- 12.1.15.2. Products
- 12.1.15.3. Company Financials
- 12.1.15.4. SWOT Analysis
- 12.1.16 YXLON International Gmbh ( COMET Group)
- 12.1.16.1. Company Overview
- 12.1.16.2. Products
- 12.1.16.3. Company Financials
- 12.1.16.4. SWOT Analysis
- 12.1.1 Acuren Inspection Inc (Rockwood Service Corporation)
- 12.2. Market Entropy
- 12.2.1 Company's Key Areas Served
- 12.2.2 Recent Developments
- 12.3. Company Market Share Analysis 2025
- 12.3.1 Top 5 Companies Market Share Analysis
- 12.3.2 Top 3 Companies Market Share Analysis
- 12.4. List of Potential Customers
- 13. Research Methodology
List of Figures
- Figure 1: Global APAC NDT Equipment Market Revenue Breakdown (billion, %) by Region 2025 & 2033
- Figure 2: North America APAC NDT Equipment Market Revenue (billion), by Technology Type 2025 & 2033
- Figure 3: North America APAC NDT Equipment Market Revenue Share (%), by Technology Type 2025 & 2033
- Figure 4: North America APAC NDT Equipment Market Revenue (billion), by End-user 2025 & 2033
- Figure 5: North America APAC NDT Equipment Market Revenue Share (%), by End-user 2025 & 2033
- Figure 6: North America APAC NDT Equipment Market Revenue (billion), by Country 2025 & 2033
- Figure 7: North America APAC NDT Equipment Market Revenue Share (%), by Country 2025 & 2033
- Figure 8: South America APAC NDT Equipment Market Revenue (billion), by Technology Type 2025 & 2033
- Figure 9: South America APAC NDT Equipment Market Revenue Share (%), by Technology Type 2025 & 2033
- Figure 10: South America APAC NDT Equipment Market Revenue (billion), by End-user 2025 & 2033
- Figure 11: South America APAC NDT Equipment Market Revenue Share (%), by End-user 2025 & 2033
- Figure 12: South America APAC NDT Equipment Market Revenue (billion), by Country 2025 & 2033
- Figure 13: South America APAC NDT Equipment Market Revenue Share (%), by Country 2025 & 2033
- Figure 14: Europe APAC NDT Equipment Market Revenue (billion), by Technology Type 2025 & 2033
- Figure 15: Europe APAC NDT Equipment Market Revenue Share (%), by Technology Type 2025 & 2033
- Figure 16: Europe APAC NDT Equipment Market Revenue (billion), by End-user 2025 & 2033
- Figure 17: Europe APAC NDT Equipment Market Revenue Share (%), by End-user 2025 & 2033
- Figure 18: Europe APAC NDT Equipment Market Revenue (billion), by Country 2025 & 2033
- Figure 19: Europe APAC NDT Equipment Market Revenue Share (%), by Country 2025 & 2033
- Figure 20: Middle East & Africa APAC NDT Equipment Market Revenue (billion), by Technology Type 2025 & 2033
- Figure 21: Middle East & Africa APAC NDT Equipment Market Revenue Share (%), by Technology Type 2025 & 2033
- Figure 22: Middle East & Africa APAC NDT Equipment Market Revenue (billion), by End-user 2025 & 2033
- Figure 23: Middle East & Africa APAC NDT Equipment Market Revenue Share (%), by End-user 2025 & 2033
- Figure 24: Middle East & Africa APAC NDT Equipment Market Revenue (billion), by Country 2025 & 2033
- Figure 25: Middle East & Africa APAC NDT Equipment Market Revenue Share (%), by Country 2025 & 2033
- Figure 26: Asia Pacific APAC NDT Equipment Market Revenue (billion), by Technology Type 2025 & 2033
- Figure 27: Asia Pacific APAC NDT Equipment Market Revenue Share (%), by Technology Type 2025 & 2033
- Figure 28: Asia Pacific APAC NDT Equipment Market Revenue (billion), by End-user 2025 & 2033
- Figure 29: Asia Pacific APAC NDT Equipment Market Revenue Share (%), by End-user 2025 & 2033
- Figure 30: Asia Pacific APAC NDT Equipment Market Revenue (billion), by Country 2025 & 2033
- Figure 31: Asia Pacific APAC NDT Equipment Market Revenue Share (%), by Country 2025 & 2033
List of Tables
- Table 1: Global APAC NDT Equipment Market Revenue billion Forecast, by Technology Type 2020 & 2033
- Table 2: Global APAC NDT Equipment Market Revenue billion Forecast, by End-user 2020 & 2033
- Table 3: Global APAC NDT Equipment Market Revenue billion Forecast, by Region 2020 & 2033
- Table 4: Global APAC NDT Equipment Market Revenue billion Forecast, by Technology Type 2020 & 2033
- Table 5: Global APAC NDT Equipment Market Revenue billion Forecast, by End-user 2020 & 2033
- Table 6: Global APAC NDT Equipment Market Revenue billion Forecast, by Country 2020 & 2033
- Table 7: United States APAC NDT Equipment Market Revenue (billion) Forecast, by Application 2020 & 2033
- Table 8: Canada APAC NDT Equipment Market Revenue (billion) Forecast, by Application 2020 & 2033
- Table 9: Mexico APAC NDT Equipment Market Revenue (billion) Forecast, by Application 2020 & 2033
- Table 10: Global APAC NDT Equipment Market Revenue billion Forecast, by Technology Type 2020 & 2033
- Table 11: Global APAC NDT Equipment Market Revenue billion Forecast, by End-user 2020 & 2033
- Table 12: Global APAC NDT Equipment Market Revenue billion Forecast, by Country 2020 & 2033
- Table 13: Brazil APAC NDT Equipment Market Revenue (billion) Forecast, by Application 2020 & 2033
- Table 14: Argentina APAC NDT Equipment Market Revenue (billion) Forecast, by Application 2020 & 2033
- Table 15: Rest of South America APAC NDT Equipment Market Revenue (billion) Forecast, by Application 2020 & 2033
- Table 16: Global APAC NDT Equipment Market Revenue billion Forecast, by Technology Type 2020 & 2033
- Table 17: Global APAC NDT Equipment Market Revenue billion Forecast, by End-user 2020 & 2033
- Table 18: Global APAC NDT Equipment Market Revenue billion Forecast, by Country 2020 & 2033
- Table 19: United Kingdom APAC NDT Equipment Market Revenue (billion) Forecast, by Application 2020 & 2033
- Table 20: Germany APAC NDT Equipment Market Revenue (billion) Forecast, by Application 2020 & 2033
- Table 21: France APAC NDT Equipment Market Revenue (billion) Forecast, by Application 2020 & 2033
- Table 22: Italy APAC NDT Equipment Market Revenue (billion) Forecast, by Application 2020 & 2033
- Table 23: Spain APAC NDT Equipment Market Revenue (billion) Forecast, by Application 2020 & 2033
- Table 24: Russia APAC NDT Equipment Market Revenue (billion) Forecast, by Application 2020 & 2033
- Table 25: Benelux APAC NDT Equipment Market Revenue (billion) Forecast, by Application 2020 & 2033
- Table 26: Nordics APAC NDT Equipment Market Revenue (billion) Forecast, by Application 2020 & 2033
- Table 27: Rest of Europe APAC NDT Equipment Market Revenue (billion) Forecast, by Application 2020 & 2033
- Table 28: Global APAC NDT Equipment Market Revenue billion Forecast, by Technology Type 2020 & 2033
- Table 29: Global APAC NDT Equipment Market Revenue billion Forecast, by End-user 2020 & 2033
- Table 30: Global APAC NDT Equipment Market Revenue billion Forecast, by Country 2020 & 2033
- Table 31: Turkey APAC NDT Equipment Market Revenue (billion) Forecast, by Application 2020 & 2033
- Table 32: Israel APAC NDT Equipment Market Revenue (billion) Forecast, by Application 2020 & 2033
- Table 33: GCC APAC NDT Equipment Market Revenue (billion) Forecast, by Application 2020 & 2033
- Table 34: North Africa APAC NDT Equipment Market Revenue (billion) Forecast, by Application 2020 & 2033
- Table 35: South Africa APAC NDT Equipment Market Revenue (billion) Forecast, by Application 2020 & 2033
- Table 36: Rest of Middle East & Africa APAC NDT Equipment Market Revenue (billion) Forecast, by Application 2020 & 2033
- Table 37: Global APAC NDT Equipment Market Revenue billion Forecast, by Technology Type 2020 & 2033
- Table 38: Global APAC NDT Equipment Market Revenue billion Forecast, by End-user 2020 & 2033
- Table 39: Global APAC NDT Equipment Market Revenue billion Forecast, by Country 2020 & 2033
- Table 40: China APAC NDT Equipment Market Revenue (billion) Forecast, by Application 2020 & 2033
- Table 41: India APAC NDT Equipment Market Revenue (billion) Forecast, by Application 2020 & 2033
- Table 42: Japan APAC NDT Equipment Market Revenue (billion) Forecast, by Application 2020 & 2033
- Table 43: South Korea APAC NDT Equipment Market Revenue (billion) Forecast, by Application 2020 & 2033
- Table 44: ASEAN APAC NDT Equipment Market Revenue (billion) Forecast, by Application 2020 & 2033
- Table 45: Oceania APAC NDT Equipment Market Revenue (billion) Forecast, by Application 2020 & 2033
- Table 46: Rest of Asia Pacific APAC NDT Equipment Market Revenue (billion) Forecast, by Application 2020 & 2033
Frequently Asked Questions
1. What is the projected Compound Annual Growth Rate (CAGR) of the APAC NDT Equipment Market?
The projected CAGR is approximately 7.23%.
2. Which companies are prominent players in the APAC NDT Equipment Market?
Key companies in the market include Acuren Inspection Inc (Rockwood Service Corporation), Intertek Group Plc, MISTRAS Group, TEAM Inc, TÜV Rhineland AG, Zetec Inc *List Not Exhaustive, SGS Group, Bureau Veritas S A, Nikon Metrology NV, Fujifilm Corporation, Olympus Corporation, Magnaflux Corp, NCS Testing Technology Co Limited, GE Measurement and Control, Applus Services S A, YXLON International Gmbh ( COMET Group).
3. What are the main segments of the APAC NDT Equipment Market?
The market segments include Technology Type, End-user.
4. Can you provide details about the market size?
The market size is estimated to be USD 5 billion as of 2022.
5. What are some drivers contributing to market growth?
Stringent safety regulations and growth in inspection services industry expected to drive adoption; Growing demand from the construction industry.
6. What are the notable trends driving market growth?
Stringent Regulations Mandating Safety.
7. Are there any restraints impacting market growth?
High replacement rate remains a key concern followed by reluctance to adopt new technologies in emerging regions.
8. Can you provide examples of recent developments in the market?
APRIL 2021- Nikon Corporation launched the Lasermeister 102A, a new optical processing system capable of titanium alloy additive manufacturing. The Lasermeister series uses a high-precision laser to perform a variety of metal processing tasks, including additive manufacturing like a 3D printer and laser marking and welding.
9. What pricing options are available for accessing the report?
Pricing options include single-user, multi-user, and enterprise licenses priced at USD 4750, USD 4950, and USD 6800 respectively.
10. Is the market size provided in terms of value or volume?
The market size is provided in terms of value, measured in billion.
11. Are there any specific market keywords associated with the report?
Yes, the market keyword associated with the report is "APAC NDT Equipment Market," which aids in identifying and referencing the specific market segment covered.
12. How do I determine which pricing option suits my needs best?
The pricing options vary based on user requirements and access needs. Individual users may opt for single-user licenses, while businesses requiring broader access may choose multi-user or enterprise licenses for cost-effective access to the report.
13. Are there any additional resources or data provided in the APAC NDT Equipment Market report?
While the report offers comprehensive insights, it's advisable to review the specific contents or supplementary materials provided to ascertain if additional resources or data are available.
14. How can I stay updated on further developments or reports in the APAC NDT Equipment Market?
To stay informed about further developments, trends, and reports in the APAC NDT Equipment Market, consider subscribing to industry newsletters, following relevant companies and organizations, or regularly checking reputable industry news sources and publications.
Methodology
Step 1 - Identification of Relevant Samples Size from Population Database


Step 2 - Approaches for Defining Global Market Size (Value, Volume* & Price*)

Note*: In applicable scenarios
Step 3 - Data Sources
Primary Research
- Web Analytics
- Survey Reports
- Research Institute
- Latest Research Reports
- Opinion Leaders
Secondary Research
- Annual Reports
- White Paper
- Latest Press Release
- Industry Association
- Paid Database
- Investor Presentations

Step 4 - Data Triangulation
Involves using different sources of information in order to increase the validity of a study
These sources are likely to be stakeholders in a program - participants, other researchers, program staff, other community members, and so on.
Then we put all data in single framework & apply various statistical tools to find out the dynamic on the market.
During the analysis stage, feedback from the stakeholder groups would be compared to determine areas of agreement as well as areas of divergence