

Key Insights
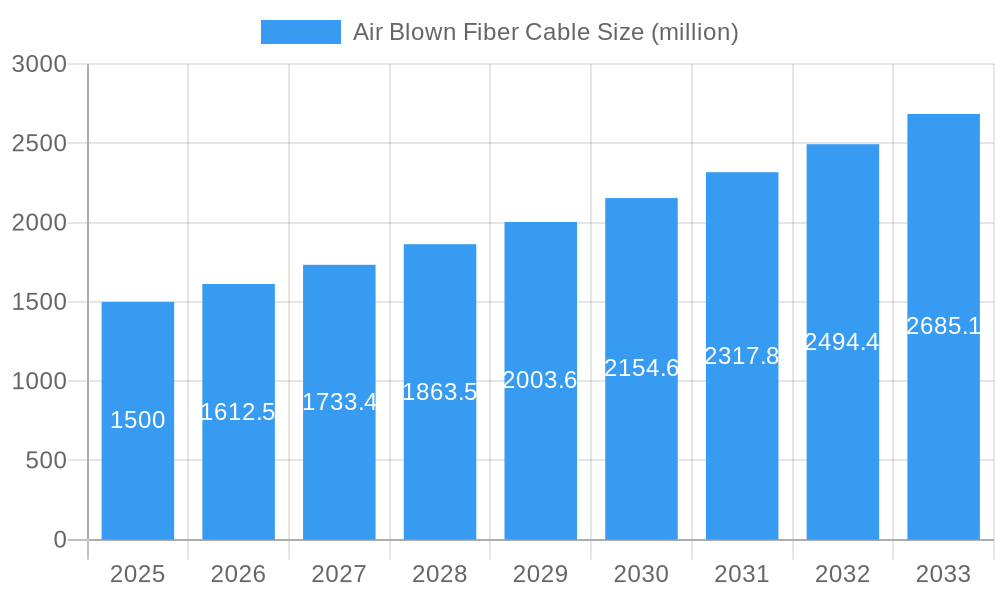
The Air Blown Fiber (ABF) Cable market is projected for robust expansion, driven by the escalating global demand for high-speed internet connectivity and the continuous rollout of fiber-to-the-home (FTTH) and fiber-to-the-x (FTTx) networks. With an estimated market size of approximately USD 1.5 billion in 2025 and a projected Compound Annual Growth Rate (CAGR) of around 7.5% from 2025 to 2033, the market is poised for significant value creation, reaching an estimated USD 2.5 billion by the end of the forecast period. Key drivers include the need for flexible, scalable, and cost-effective fiber deployment solutions, especially in dense urban environments and challenging terrains where traditional trenching methods are impractical or prohibitively expensive. The increasing adoption of broadband services, coupled with the growth of 5G infrastructure and the burgeoning Internet of Things (IoT) ecosystem, further fuels the demand for ABF cables that offer ease of installation and future-proofing capabilities.
Air Blown Fiber Cable Market Size (In Billion)
The market is segmented by application and type, with FTTx and Broadband applications dominating, reflecting the widespread infrastructure development. Single-core and multi-core cable types cater to varying deployment needs, with multi-core variants gaining traction for higher bandwidth requirements. Geographically, the Asia Pacific region, particularly China and India, is expected to lead market growth due to massive investments in digital infrastructure and a large, rapidly growing subscriber base. North America and Europe also represent substantial markets, driven by ongoing network upgrades and government initiatives promoting digital inclusion. Emerging markets in the Middle East & Africa and South America are anticipated to witness significant growth as they focus on expanding their telecommunication networks. Despite the positive outlook, challenges such as the initial high cost of microduct installation and the need for specialized blowing equipment can present some restraints. However, the inherent advantages of ABF technology, including reduced installation time and lower long-term operational costs, are expected to outweigh these challenges, propelling sustained market growth. Major players like Prysmian Group, Corning, and ZTT are actively investing in research and development to enhance product offerings and expand their global presence.
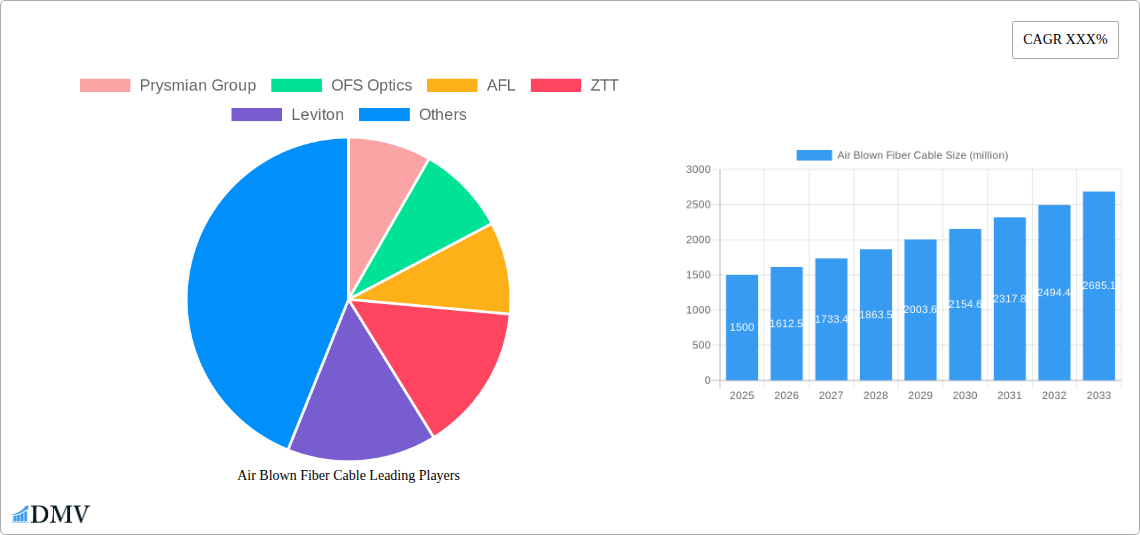
Air Blown Fiber Cable Company Market Share
Air Blown Fiber Cable Market Analysis Report: Global Trends, Innovations, and Future Outlook (2019-2033)
This comprehensive market research report offers an in-depth analysis of the global Air Blown Fiber (ABF) Cable market, a critical component in modern telecommunications infrastructure. Spanning the study period from 2019 to 2033, with a base and estimated year of 2025 and a forecast period from 2025 to 2033, this report leverages historical data from 2019-2024 to provide actionable insights for stakeholders. Discover key market trends, competitive landscapes, technological advancements, and future growth opportunities within the fiber optic cable industry, particularly focusing on ABF cable solutions. Whether you're a manufacturer, installer, network operator, or investor, this report equips you with the knowledge to navigate the evolving broadband deployment and FTTx network expansion landscape.
Air Blown Fiber Cable Market Composition & Trends
The air blown fiber cable market exhibits moderate to high concentration, with a notable presence of major players such as Prysmian Group, OFS Optics, AFL, ZTT, Leviton, Sumitomo, Corning, Tongding Interconnection Information Co., Ltd., Hengtong Optic-electric Co.,ltd., Yangtze Optical Fiber and Cable Joint Stock Limited Company, Twentsche (Nanjing) Fiber Optics Ltd., Sopto, Shenzhen Hanxin Communication Optical Cable Co., Ltd., and Sichuan Huiyuan Optical Communications Co., Ltd. Innovation is primarily driven by the increasing demand for higher bandwidth and faster deployment solutions, directly impacting fiber optic cable innovation. The regulatory landscape is generally supportive of telecom infrastructure investment, with governments worldwide pushing for expanded broadband connectivity. Substitute products, while present in the form of traditional duct cables, are increasingly outpaced by the efficiency and cost-effectiveness of ABF solutions. End-user profiles range from large telecommunication carriers and internet service providers to enterprise networks and industrial applications. Merger and acquisition (M&A) activities are expected to continue as larger entities seek to consolidate market share and acquire specialized ABF technologies. For instance, historical M&A deals in the broader fiber optic sector have ranged from tens to hundreds of million dollars, signaling significant strategic consolidation potential. The market share distribution indicates that leading global players command substantial portions, but niche specialists are also carving out significant segments.
Air Blown Fiber Cable Industry Evolution
The air blown fiber cable industry has witnessed a dynamic evolution, primarily characterized by a consistent upward trajectory in market growth. This growth is intrinsically linked to the accelerating global demand for high-speed internet and robust telecommunications networks, making air blown fiber deployment a cornerstone of modern infrastructure. Technological advancements have been pivotal, with continuous improvements in fiber optic technology, microduct systems, and blowing equipment enhancing deployment efficiency and reliability. The development of single core and multi-core air blown fiber cables has catered to diverse deployment needs, offering flexibility and scalability for various applications, from dense urban areas to challenging rural terrains. Consumer demand has shifted dramatically towards faster, more reliable internet services, driving the widespread adoption of FTTx (Fiber to the X) initiatives and extensive broadband network expansion. This surge in demand has spurred significant investment in fiber optic cable manufacturing and installation, directly benefiting the ABF cable market. Adoption metrics show a steady increase in the percentage of new fiber deployments utilizing ABF technology, particularly in greenfield projects and network upgrades. The industry has successfully navigated early adoption hurdles, establishing ABF as a preferred method for efficient and cost-effective fiber optic network construction. The market's growth rate has consistently exceeded general infrastructure growth, driven by the imperative to bridge the digital divide and support the ever-increasing data consumption of the digital age. Over the forecast period, sustained investment in 5G networks, IoT deployments, and cloud computing will further fuel the demand for high-capacity fiber optic infrastructure, solidifying the position of air blown fiber solutions.
Leading Regions, Countries, or Segments in Air Blown Fiber Cable
The air blown fiber cable market is currently dominated by regions demonstrating significant investment in telecommunications infrastructure and a strong push towards digital transformation. Asia-Pacific, particularly China, stands out as a leading region due to substantial government initiatives promoting broadband access and FTTx network deployment. The sheer scale of investment in this segment, often in the billions of dollars annually, coupled with the presence of major fiber optic cable manufacturers like ZTT, Hengtong, and Yangtze Optical Fiber, solidifies its leadership.
- Key Drivers of Dominance in Asia-Pacific:
- Aggressive FTTx Rollouts: Governments have set ambitious targets for universal broadband coverage, necessitating rapid and efficient fiber deployments.
- 5G Network Expansion: The global race for 5G implementation requires extensive fiber backhaul, making ABF a preferred solution for its speed and cost-effectiveness.
- Manufacturing Prowess: The region is a global hub for fiber optic cable production, offering economies of scale and driving down costs.
- Technological Adoption: A high propensity to adopt new technologies, including advanced blowing techniques and microduct systems.
Among the segments, FTTx stands out as the primary application driving market growth. The demand for high-speed internet in residential and business premises fuels extensive deployments, making ABF cables ideal for efficiently connecting these end-points. This segment's dominance is further reinforced by evolving consumer expectations for seamless connectivity and high-bandwidth applications like streaming, gaming, and video conferencing.
In terms of Type, multi-core air blown fiber cables are gaining traction, offering higher fiber density within a single duct. This is particularly beneficial in urban environments where space is limited and the need for massive data carrying capacity is paramount. However, single core air blown fiber cables continue to hold a significant market share, especially in scenarios requiring simpler deployments or targeted connectivity solutions. The choice between single and multi-core often depends on the specific network architecture and future scalability plans, with a growing trend towards multi-core solutions for future-proofing networks.
Air Blown Fiber Cable Product Innovations
Product innovations in the air blown fiber cable market are focused on enhancing deployment speed, improving fiber density, and increasing cable durability. Advancements in materials science have led to lighter, more flexible fiber optic cables that are easier to blow through microducts over longer distances, reducing installation time and labor costs by millions. Furthermore, innovations in multi-core fiber technology are enabling higher bandwidth capacity within a single cable, crucial for meeting the escalating demands of broadband connectivity and 5G deployments. Manufacturers are also developing cables with enhanced environmental resistance, ensuring reliable performance in challenging conditions, a key selling proposition for critical infrastructure.
Propelling Factors for Air Blown Fiber Growth
The growth of the air blown fiber cable market is propelled by several key factors. Firstly, the relentless global demand for higher bandwidth and faster internet speeds, driven by FTTx initiatives and the proliferation of data-intensive applications, creates a constant need for efficient fiber optic deployment. Secondly, technological advancements in air blowing technology and microduct systems significantly reduce installation costs and time compared to traditional methods, making it an economically attractive option. Thirdly, government policies and investments aimed at expanding broadband infrastructure and bridging the digital divide, particularly in developing regions, provide strong regulatory support. Lastly, the increasing adoption of 5G networks, which require extensive fiber backhaul, is a significant catalyst for ABF cable demand.
Obstacles in the Air Blown Fiber Cable Market
Despite robust growth, the air blown fiber cable market faces certain obstacles. The initial capital investment required for specialized blowing equipment and microduct installation can be a barrier for smaller operators. Supply chain disruptions, as seen in recent global events, can impact the availability of raw materials and components, leading to price volatility and project delays. Furthermore, the technical expertise required for optimal air blown fiber deployment necessitates trained personnel, and a shortage of skilled technicians can hinder rapid expansion. Competitive pressures from alternative fiber deployment methods, though less efficient, can also pose a challenge in certain market segments.
Future Opportunities in Air Blown Fiber Cable
Emerging opportunities in the air blown fiber cable market are abundant and diverse. The ongoing expansion of smart cities and the proliferation of the Internet of Things (IoT) will necessitate dense fiber optic networks, where ABF solutions are ideally suited for their scalability. The increasing demand for data centers and cloud services requires massive fiber optic connectivity, presenting a significant opportunity. Furthermore, the development of new microduct technologies and more efficient blowing machines will further enhance the cost-effectiveness and deployment speed of ABF systems, opening up new markets. The global push for universal broadband access in underserved rural areas also represents a substantial growth avenue for ABF technology.
Major Players in the Air Blown Fiber Cable Ecosystem
- Prysmian Group
- OFS Optics
- AFL
- ZTT
- Leviton
- Sumitomo
- Corning
- Tongding Interconnection Information Co., Ltd.
- Hengtong Optic-electric Co.,ltd.
- Yangtze Optical Fiber and Cable Joint Stock Limited Company
- Twentsche (Nanjing) Fiber Optics Ltd.
- Sopto
- Shenzhen Hanxin Communication Optical Cable Co., Ltd.
- Sichuan Huiyuan Optical Communications Co., Ltd
Key Developments in Air Blown Fiber Cable Industry
- 2023: Increased investment in R&D for higher-capacity multi-core air blown fiber cables to support evolving network demands.
- 2022: Rollout of advanced air blowing equipment with enhanced control and efficiency, reducing deployment times significantly.
- 2021: Growing adoption of ABF solutions for 5G backhaul infrastructure, spurred by global 5G network expansion efforts.
- 2020: Focus on developing more robust and environmentally resistant ABF cables to ensure reliability in diverse climates.
- 2019: Significant increase in FTTx projects globally, driving demand for efficient fiber optic deployment methods like air blown fiber.
Strategic Air Blown Fiber Market Forecast
The strategic forecast for the air blown fiber cable market indicates continued robust growth, driven by the insatiable demand for high-speed broadband connectivity and the critical role of fiber optics in enabling next-generation technologies like 5G and IoT. Key growth catalysts include ongoing FTTx deployments, substantial government investments in digital infrastructure, and continuous technological advancements in fiber and blowing techniques, which collectively promise to lower deployment costs by millions. The market is poised to benefit from emerging opportunities in smart city initiatives and the expanding data center landscape, solidifying its position as a vital component of the global telecommunications ecosystem.
Air Blown Fiber Cable Segmentation
-
1. Application
- 1.1. FTTx
- 1.2. Broadband
- 1.3. Others
-
2. Type
- 2.1. Single Core
- 2.2. Multi-core
Air Blown Fiber Cable Segmentation By Geography
-
1. North America
- 1.1. United States
- 1.2. Canada
- 1.3. Mexico
-
2. South America
- 2.1. Brazil
- 2.2. Argentina
- 2.3. Rest of South America
-
3. Europe
- 3.1. United Kingdom
- 3.2. Germany
- 3.3. France
- 3.4. Italy
- 3.5. Spain
- 3.6. Russia
- 3.7. Benelux
- 3.8. Nordics
- 3.9. Rest of Europe
-
4. Middle East & Africa
- 4.1. Turkey
- 4.2. Israel
- 4.3. GCC
- 4.4. North Africa
- 4.5. South Africa
- 4.6. Rest of Middle East & Africa
-
5. Asia Pacific
- 5.1. China
- 5.2. India
- 5.3. Japan
- 5.4. South Korea
- 5.5. ASEAN
- 5.6. Oceania
- 5.7. Rest of Asia Pacific
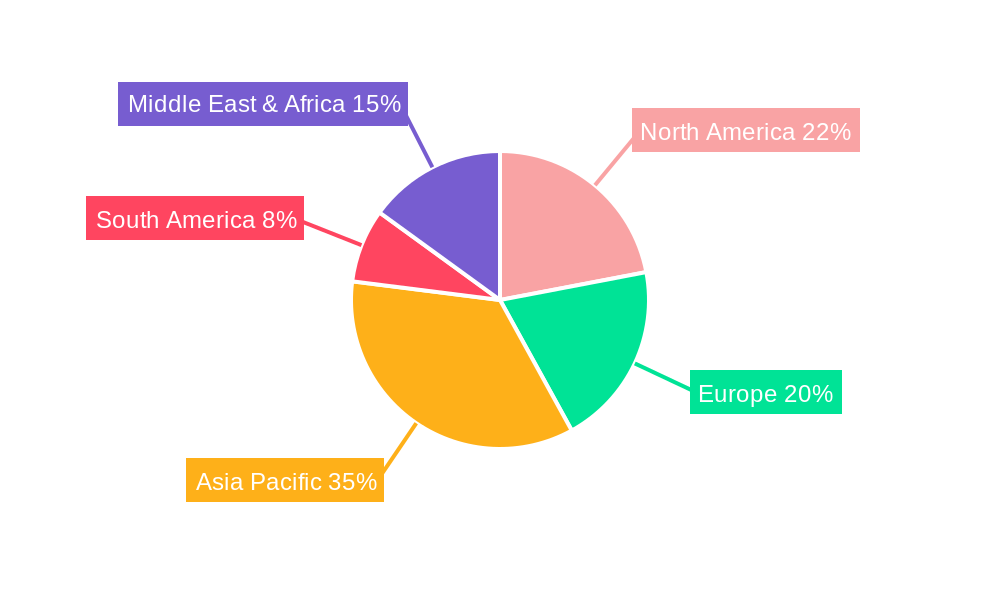
Air Blown Fiber Cable Regional Market Share
Geographic Coverage of Air Blown Fiber Cable
Air Blown Fiber Cable REPORT HIGHLIGHTS
| Aspects | Details |
|---|---|
| Study Period | 2020-2034 |
| Base Year | 2025 |
| Estimated Year | 2026 |
| Forecast Period | 2026-2034 |
| Historical Period | 2020-2025 |
| Growth Rate | CAGR of 4.7% from 2020-2034 |
| Segmentation |
|
Table of Contents
- 1. Introduction
- 1.1. Research Scope
- 1.2. Market Segmentation
- 1.3. Research Objective
- 1.4. Definitions and Assumptions
- 2. Executive Summary
- 2.1. Market Snapshot
- 3. Market Dynamics
- 3.1. Market Drivers
- 3.2. Market Restrains
- 3.3. Market Trends
- 3.4. Market Opportunities
- 4. Market Factor Analysis
- 4.1. Porters Five Forces
- 4.1.1. Bargaining Power of Suppliers
- 4.1.2. Bargaining Power of Buyers
- 4.1.3. Threat of New Entrants
- 4.1.4. Threat of Substitutes
- 4.1.5. Competitive Rivalry
- 4.2. PESTEL analysis
- 4.3. BCG Analysis
- 4.3.1. Stars (High Growth, High Market Share)
- 4.3.2. Cash Cows (Low Growth, High Market Share)
- 4.3.3. Question Mark (High Growth, Low Market Share)
- 4.3.4. Dogs (Low Growth, Low Market Share)
- 4.4. Ansoff Matrix Analysis
- 4.5. Supply Chain Analysis
- 4.6. Regulatory Landscape
- 4.7. Current Market Potential and Opportunity Assessment (TAM–SAM–SOM Framework)
- 4.8. DMV Analyst Note
- 4.1. Porters Five Forces
- 5. Market Analysis, Insights and Forecast 2021-2033
- 5.1. Market Analysis, Insights and Forecast - by Application
- 5.1.1. FTTx
- 5.1.2. Broadband
- 5.1.3. Others
- 5.2. Market Analysis, Insights and Forecast - by Type
- 5.2.1. Single Core
- 5.2.2. Multi-core
- 5.3. Market Analysis, Insights and Forecast - by Region
- 5.3.1. North America
- 5.3.2. South America
- 5.3.3. Europe
- 5.3.4. Middle East & Africa
- 5.3.5. Asia Pacific
- 5.1. Market Analysis, Insights and Forecast - by Application
- 6. Global Air Blown Fiber Cable Analysis, Insights and Forecast, 2021-2033
- 6.1. Market Analysis, Insights and Forecast - by Application
- 6.1.1. FTTx
- 6.1.2. Broadband
- 6.1.3. Others
- 6.2. Market Analysis, Insights and Forecast - by Type
- 6.2.1. Single Core
- 6.2.2. Multi-core
- 6.1. Market Analysis, Insights and Forecast - by Application
- 7. North America Air Blown Fiber Cable Analysis, Insights and Forecast, 2020-2032
- 7.1. Market Analysis, Insights and Forecast - by Application
- 7.1.1. FTTx
- 7.1.2. Broadband
- 7.1.3. Others
- 7.2. Market Analysis, Insights and Forecast - by Type
- 7.2.1. Single Core
- 7.2.2. Multi-core
- 7.1. Market Analysis, Insights and Forecast - by Application
- 8. South America Air Blown Fiber Cable Analysis, Insights and Forecast, 2020-2032
- 8.1. Market Analysis, Insights and Forecast - by Application
- 8.1.1. FTTx
- 8.1.2. Broadband
- 8.1.3. Others
- 8.2. Market Analysis, Insights and Forecast - by Type
- 8.2.1. Single Core
- 8.2.2. Multi-core
- 8.1. Market Analysis, Insights and Forecast - by Application
- 9. Europe Air Blown Fiber Cable Analysis, Insights and Forecast, 2020-2032
- 9.1. Market Analysis, Insights and Forecast - by Application
- 9.1.1. FTTx
- 9.1.2. Broadband
- 9.1.3. Others
- 9.2. Market Analysis, Insights and Forecast - by Type
- 9.2.1. Single Core
- 9.2.2. Multi-core
- 9.1. Market Analysis, Insights and Forecast - by Application
- 10. Middle East & Africa Air Blown Fiber Cable Analysis, Insights and Forecast, 2020-2032
- 10.1. Market Analysis, Insights and Forecast - by Application
- 10.1.1. FTTx
- 10.1.2. Broadband
- 10.1.3. Others
- 10.2. Market Analysis, Insights and Forecast - by Type
- 10.2.1. Single Core
- 10.2.2. Multi-core
- 10.1. Market Analysis, Insights and Forecast - by Application
- 11. Asia Pacific Air Blown Fiber Cable Analysis, Insights and Forecast, 2020-2032
- 11.1. Market Analysis, Insights and Forecast - by Application
- 11.1.1. FTTx
- 11.1.2. Broadband
- 11.1.3. Others
- 11.2. Market Analysis, Insights and Forecast - by Type
- 11.2.1. Single Core
- 11.2.2. Multi-core
- 11.1. Market Analysis, Insights and Forecast - by Application
- 12. Competitive Analysis
- 12.1. Company Profiles
- 12.1.1 Prysmian Group
- 12.1.1.1. Company Overview
- 12.1.1.2. Products
- 12.1.1.3. Company Financials
- 12.1.1.4. SWOT Analysis
- 12.1.2 OFS Optics
- 12.1.2.1. Company Overview
- 12.1.2.2. Products
- 12.1.2.3. Company Financials
- 12.1.2.4. SWOT Analysis
- 12.1.3 AFL
- 12.1.3.1. Company Overview
- 12.1.3.2. Products
- 12.1.3.3. Company Financials
- 12.1.3.4. SWOT Analysis
- 12.1.4 ZTT
- 12.1.4.1. Company Overview
- 12.1.4.2. Products
- 12.1.4.3. Company Financials
- 12.1.4.4. SWOT Analysis
- 12.1.5 Leviton
- 12.1.5.1. Company Overview
- 12.1.5.2. Products
- 12.1.5.3. Company Financials
- 12.1.5.4. SWOT Analysis
- 12.1.6 Sumitomo
- 12.1.6.1. Company Overview
- 12.1.6.2. Products
- 12.1.6.3. Company Financials
- 12.1.6.4. SWOT Analysis
- 12.1.7 Corning
- 12.1.7.1. Company Overview
- 12.1.7.2. Products
- 12.1.7.3. Company Financials
- 12.1.7.4. SWOT Analysis
- 12.1.8 Tongding Interconnection Information Co.Ltd.
- 12.1.8.1. Company Overview
- 12.1.8.2. Products
- 12.1.8.3. Company Financials
- 12.1.8.4. SWOT Analysis
- 12.1.9 Hengtong Optic-electric Co.ltd.
- 12.1.9.1. Company Overview
- 12.1.9.2. Products
- 12.1.9.3. Company Financials
- 12.1.9.4. SWOT Analysis
- 12.1.10 Yangtze Optical Fiber and Cable Joint Stock Limited Company
- 12.1.10.1. Company Overview
- 12.1.10.2. Products
- 12.1.10.3. Company Financials
- 12.1.10.4. SWOT Analysis
- 12.1.11 Twentsche(Nanjing)Fiber Optics Ltd.
- 12.1.11.1. Company Overview
- 12.1.11.2. Products
- 12.1.11.3. Company Financials
- 12.1.11.4. SWOT Analysis
- 12.1.12 Sopto
- 12.1.12.1. Company Overview
- 12.1.12.2. Products
- 12.1.12.3. Company Financials
- 12.1.12.4. SWOT Analysis
- 12.1.13 Shenzhen Hanxin Communication Optical Cable Co. Ltd.
- 12.1.13.1. Company Overview
- 12.1.13.2. Products
- 12.1.13.3. Company Financials
- 12.1.13.4. SWOT Analysis
- 12.1.14 Sichuan Huiyuan Optical Communications Co. Ltd
- 12.1.14.1. Company Overview
- 12.1.14.2. Products
- 12.1.14.3. Company Financials
- 12.1.14.4. SWOT Analysis
- 12.1.1 Prysmian Group
- 12.2. Market Entropy
- 12.2.1 Company's Key Areas Served
- 12.2.2 Recent Developments
- 12.3. Company Market Share Analysis 2025
- 12.3.1 Top 5 Companies Market Share Analysis
- 12.3.2 Top 3 Companies Market Share Analysis
- 12.4. List of Potential Customers
- 13. Research Methodology
List of Figures
- Figure 1: Global Air Blown Fiber Cable Revenue Breakdown (undefined, %) by Region 2025 & 2033
- Figure 2: Global Air Blown Fiber Cable Volume Breakdown (K, %) by Region 2025 & 2033
- Figure 3: North America Air Blown Fiber Cable Revenue (undefined), by Application 2025 & 2033
- Figure 4: North America Air Blown Fiber Cable Volume (K), by Application 2025 & 2033
- Figure 5: North America Air Blown Fiber Cable Revenue Share (%), by Application 2025 & 2033
- Figure 6: North America Air Blown Fiber Cable Volume Share (%), by Application 2025 & 2033
- Figure 7: North America Air Blown Fiber Cable Revenue (undefined), by Type 2025 & 2033
- Figure 8: North America Air Blown Fiber Cable Volume (K), by Type 2025 & 2033
- Figure 9: North America Air Blown Fiber Cable Revenue Share (%), by Type 2025 & 2033
- Figure 10: North America Air Blown Fiber Cable Volume Share (%), by Type 2025 & 2033
- Figure 11: North America Air Blown Fiber Cable Revenue (undefined), by Country 2025 & 2033
- Figure 12: North America Air Blown Fiber Cable Volume (K), by Country 2025 & 2033
- Figure 13: North America Air Blown Fiber Cable Revenue Share (%), by Country 2025 & 2033
- Figure 14: North America Air Blown Fiber Cable Volume Share (%), by Country 2025 & 2033
- Figure 15: South America Air Blown Fiber Cable Revenue (undefined), by Application 2025 & 2033
- Figure 16: South America Air Blown Fiber Cable Volume (K), by Application 2025 & 2033
- Figure 17: South America Air Blown Fiber Cable Revenue Share (%), by Application 2025 & 2033
- Figure 18: South America Air Blown Fiber Cable Volume Share (%), by Application 2025 & 2033
- Figure 19: South America Air Blown Fiber Cable Revenue (undefined), by Type 2025 & 2033
- Figure 20: South America Air Blown Fiber Cable Volume (K), by Type 2025 & 2033
- Figure 21: South America Air Blown Fiber Cable Revenue Share (%), by Type 2025 & 2033
- Figure 22: South America Air Blown Fiber Cable Volume Share (%), by Type 2025 & 2033
- Figure 23: South America Air Blown Fiber Cable Revenue (undefined), by Country 2025 & 2033
- Figure 24: South America Air Blown Fiber Cable Volume (K), by Country 2025 & 2033
- Figure 25: South America Air Blown Fiber Cable Revenue Share (%), by Country 2025 & 2033
- Figure 26: South America Air Blown Fiber Cable Volume Share (%), by Country 2025 & 2033
- Figure 27: Europe Air Blown Fiber Cable Revenue (undefined), by Application 2025 & 2033
- Figure 28: Europe Air Blown Fiber Cable Volume (K), by Application 2025 & 2033
- Figure 29: Europe Air Blown Fiber Cable Revenue Share (%), by Application 2025 & 2033
- Figure 30: Europe Air Blown Fiber Cable Volume Share (%), by Application 2025 & 2033
- Figure 31: Europe Air Blown Fiber Cable Revenue (undefined), by Type 2025 & 2033
- Figure 32: Europe Air Blown Fiber Cable Volume (K), by Type 2025 & 2033
- Figure 33: Europe Air Blown Fiber Cable Revenue Share (%), by Type 2025 & 2033
- Figure 34: Europe Air Blown Fiber Cable Volume Share (%), by Type 2025 & 2033
- Figure 35: Europe Air Blown Fiber Cable Revenue (undefined), by Country 2025 & 2033
- Figure 36: Europe Air Blown Fiber Cable Volume (K), by Country 2025 & 2033
- Figure 37: Europe Air Blown Fiber Cable Revenue Share (%), by Country 2025 & 2033
- Figure 38: Europe Air Blown Fiber Cable Volume Share (%), by Country 2025 & 2033
- Figure 39: Middle East & Africa Air Blown Fiber Cable Revenue (undefined), by Application 2025 & 2033
- Figure 40: Middle East & Africa Air Blown Fiber Cable Volume (K), by Application 2025 & 2033
- Figure 41: Middle East & Africa Air Blown Fiber Cable Revenue Share (%), by Application 2025 & 2033
- Figure 42: Middle East & Africa Air Blown Fiber Cable Volume Share (%), by Application 2025 & 2033
- Figure 43: Middle East & Africa Air Blown Fiber Cable Revenue (undefined), by Type 2025 & 2033
- Figure 44: Middle East & Africa Air Blown Fiber Cable Volume (K), by Type 2025 & 2033
- Figure 45: Middle East & Africa Air Blown Fiber Cable Revenue Share (%), by Type 2025 & 2033
- Figure 46: Middle East & Africa Air Blown Fiber Cable Volume Share (%), by Type 2025 & 2033
- Figure 47: Middle East & Africa Air Blown Fiber Cable Revenue (undefined), by Country 2025 & 2033
- Figure 48: Middle East & Africa Air Blown Fiber Cable Volume (K), by Country 2025 & 2033
- Figure 49: Middle East & Africa Air Blown Fiber Cable Revenue Share (%), by Country 2025 & 2033
- Figure 50: Middle East & Africa Air Blown Fiber Cable Volume Share (%), by Country 2025 & 2033
- Figure 51: Asia Pacific Air Blown Fiber Cable Revenue (undefined), by Application 2025 & 2033
- Figure 52: Asia Pacific Air Blown Fiber Cable Volume (K), by Application 2025 & 2033
- Figure 53: Asia Pacific Air Blown Fiber Cable Revenue Share (%), by Application 2025 & 2033
- Figure 54: Asia Pacific Air Blown Fiber Cable Volume Share (%), by Application 2025 & 2033
- Figure 55: Asia Pacific Air Blown Fiber Cable Revenue (undefined), by Type 2025 & 2033
- Figure 56: Asia Pacific Air Blown Fiber Cable Volume (K), by Type 2025 & 2033
- Figure 57: Asia Pacific Air Blown Fiber Cable Revenue Share (%), by Type 2025 & 2033
- Figure 58: Asia Pacific Air Blown Fiber Cable Volume Share (%), by Type 2025 & 2033
- Figure 59: Asia Pacific Air Blown Fiber Cable Revenue (undefined), by Country 2025 & 2033
- Figure 60: Asia Pacific Air Blown Fiber Cable Volume (K), by Country 2025 & 2033
- Figure 61: Asia Pacific Air Blown Fiber Cable Revenue Share (%), by Country 2025 & 2033
- Figure 62: Asia Pacific Air Blown Fiber Cable Volume Share (%), by Country 2025 & 2033
List of Tables
- Table 1: Global Air Blown Fiber Cable Revenue undefined Forecast, by Application 2020 & 2033
- Table 2: Global Air Blown Fiber Cable Volume K Forecast, by Application 2020 & 2033
- Table 3: Global Air Blown Fiber Cable Revenue undefined Forecast, by Type 2020 & 2033
- Table 4: Global Air Blown Fiber Cable Volume K Forecast, by Type 2020 & 2033
- Table 5: Global Air Blown Fiber Cable Revenue undefined Forecast, by Region 2020 & 2033
- Table 6: Global Air Blown Fiber Cable Volume K Forecast, by Region 2020 & 2033
- Table 7: Global Air Blown Fiber Cable Revenue undefined Forecast, by Application 2020 & 2033
- Table 8: Global Air Blown Fiber Cable Volume K Forecast, by Application 2020 & 2033
- Table 9: Global Air Blown Fiber Cable Revenue undefined Forecast, by Type 2020 & 2033
- Table 10: Global Air Blown Fiber Cable Volume K Forecast, by Type 2020 & 2033
- Table 11: Global Air Blown Fiber Cable Revenue undefined Forecast, by Country 2020 & 2033
- Table 12: Global Air Blown Fiber Cable Volume K Forecast, by Country 2020 & 2033
- Table 13: United States Air Blown Fiber Cable Revenue (undefined) Forecast, by Application 2020 & 2033
- Table 14: United States Air Blown Fiber Cable Volume (K) Forecast, by Application 2020 & 2033
- Table 15: Canada Air Blown Fiber Cable Revenue (undefined) Forecast, by Application 2020 & 2033
- Table 16: Canada Air Blown Fiber Cable Volume (K) Forecast, by Application 2020 & 2033
- Table 17: Mexico Air Blown Fiber Cable Revenue (undefined) Forecast, by Application 2020 & 2033
- Table 18: Mexico Air Blown Fiber Cable Volume (K) Forecast, by Application 2020 & 2033
- Table 19: Global Air Blown Fiber Cable Revenue undefined Forecast, by Application 2020 & 2033
- Table 20: Global Air Blown Fiber Cable Volume K Forecast, by Application 2020 & 2033
- Table 21: Global Air Blown Fiber Cable Revenue undefined Forecast, by Type 2020 & 2033
- Table 22: Global Air Blown Fiber Cable Volume K Forecast, by Type 2020 & 2033
- Table 23: Global Air Blown Fiber Cable Revenue undefined Forecast, by Country 2020 & 2033
- Table 24: Global Air Blown Fiber Cable Volume K Forecast, by Country 2020 & 2033
- Table 25: Brazil Air Blown Fiber Cable Revenue (undefined) Forecast, by Application 2020 & 2033
- Table 26: Brazil Air Blown Fiber Cable Volume (K) Forecast, by Application 2020 & 2033
- Table 27: Argentina Air Blown Fiber Cable Revenue (undefined) Forecast, by Application 2020 & 2033
- Table 28: Argentina Air Blown Fiber Cable Volume (K) Forecast, by Application 2020 & 2033
- Table 29: Rest of South America Air Blown Fiber Cable Revenue (undefined) Forecast, by Application 2020 & 2033
- Table 30: Rest of South America Air Blown Fiber Cable Volume (K) Forecast, by Application 2020 & 2033
- Table 31: Global Air Blown Fiber Cable Revenue undefined Forecast, by Application 2020 & 2033
- Table 32: Global Air Blown Fiber Cable Volume K Forecast, by Application 2020 & 2033
- Table 33: Global Air Blown Fiber Cable Revenue undefined Forecast, by Type 2020 & 2033
- Table 34: Global Air Blown Fiber Cable Volume K Forecast, by Type 2020 & 2033
- Table 35: Global Air Blown Fiber Cable Revenue undefined Forecast, by Country 2020 & 2033
- Table 36: Global Air Blown Fiber Cable Volume K Forecast, by Country 2020 & 2033
- Table 37: United Kingdom Air Blown Fiber Cable Revenue (undefined) Forecast, by Application 2020 & 2033
- Table 38: United Kingdom Air Blown Fiber Cable Volume (K) Forecast, by Application 2020 & 2033
- Table 39: Germany Air Blown Fiber Cable Revenue (undefined) Forecast, by Application 2020 & 2033
- Table 40: Germany Air Blown Fiber Cable Volume (K) Forecast, by Application 2020 & 2033
- Table 41: France Air Blown Fiber Cable Revenue (undefined) Forecast, by Application 2020 & 2033
- Table 42: France Air Blown Fiber Cable Volume (K) Forecast, by Application 2020 & 2033
- Table 43: Italy Air Blown Fiber Cable Revenue (undefined) Forecast, by Application 2020 & 2033
- Table 44: Italy Air Blown Fiber Cable Volume (K) Forecast, by Application 2020 & 2033
- Table 45: Spain Air Blown Fiber Cable Revenue (undefined) Forecast, by Application 2020 & 2033
- Table 46: Spain Air Blown Fiber Cable Volume (K) Forecast, by Application 2020 & 2033
- Table 47: Russia Air Blown Fiber Cable Revenue (undefined) Forecast, by Application 2020 & 2033
- Table 48: Russia Air Blown Fiber Cable Volume (K) Forecast, by Application 2020 & 2033
- Table 49: Benelux Air Blown Fiber Cable Revenue (undefined) Forecast, by Application 2020 & 2033
- Table 50: Benelux Air Blown Fiber Cable Volume (K) Forecast, by Application 2020 & 2033
- Table 51: Nordics Air Blown Fiber Cable Revenue (undefined) Forecast, by Application 2020 & 2033
- Table 52: Nordics Air Blown Fiber Cable Volume (K) Forecast, by Application 2020 & 2033
- Table 53: Rest of Europe Air Blown Fiber Cable Revenue (undefined) Forecast, by Application 2020 & 2033
- Table 54: Rest of Europe Air Blown Fiber Cable Volume (K) Forecast, by Application 2020 & 2033
- Table 55: Global Air Blown Fiber Cable Revenue undefined Forecast, by Application 2020 & 2033
- Table 56: Global Air Blown Fiber Cable Volume K Forecast, by Application 2020 & 2033
- Table 57: Global Air Blown Fiber Cable Revenue undefined Forecast, by Type 2020 & 2033
- Table 58: Global Air Blown Fiber Cable Volume K Forecast, by Type 2020 & 2033
- Table 59: Global Air Blown Fiber Cable Revenue undefined Forecast, by Country 2020 & 2033
- Table 60: Global Air Blown Fiber Cable Volume K Forecast, by Country 2020 & 2033
- Table 61: Turkey Air Blown Fiber Cable Revenue (undefined) Forecast, by Application 2020 & 2033
- Table 62: Turkey Air Blown Fiber Cable Volume (K) Forecast, by Application 2020 & 2033
- Table 63: Israel Air Blown Fiber Cable Revenue (undefined) Forecast, by Application 2020 & 2033
- Table 64: Israel Air Blown Fiber Cable Volume (K) Forecast, by Application 2020 & 2033
- Table 65: GCC Air Blown Fiber Cable Revenue (undefined) Forecast, by Application 2020 & 2033
- Table 66: GCC Air Blown Fiber Cable Volume (K) Forecast, by Application 2020 & 2033
- Table 67: North Africa Air Blown Fiber Cable Revenue (undefined) Forecast, by Application 2020 & 2033
- Table 68: North Africa Air Blown Fiber Cable Volume (K) Forecast, by Application 2020 & 2033
- Table 69: South Africa Air Blown Fiber Cable Revenue (undefined) Forecast, by Application 2020 & 2033
- Table 70: South Africa Air Blown Fiber Cable Volume (K) Forecast, by Application 2020 & 2033
- Table 71: Rest of Middle East & Africa Air Blown Fiber Cable Revenue (undefined) Forecast, by Application 2020 & 2033
- Table 72: Rest of Middle East & Africa Air Blown Fiber Cable Volume (K) Forecast, by Application 2020 & 2033
- Table 73: Global Air Blown Fiber Cable Revenue undefined Forecast, by Application 2020 & 2033
- Table 74: Global Air Blown Fiber Cable Volume K Forecast, by Application 2020 & 2033
- Table 75: Global Air Blown Fiber Cable Revenue undefined Forecast, by Type 2020 & 2033
- Table 76: Global Air Blown Fiber Cable Volume K Forecast, by Type 2020 & 2033
- Table 77: Global Air Blown Fiber Cable Revenue undefined Forecast, by Country 2020 & 2033
- Table 78: Global Air Blown Fiber Cable Volume K Forecast, by Country 2020 & 2033
- Table 79: China Air Blown Fiber Cable Revenue (undefined) Forecast, by Application 2020 & 2033
- Table 80: China Air Blown Fiber Cable Volume (K) Forecast, by Application 2020 & 2033
- Table 81: India Air Blown Fiber Cable Revenue (undefined) Forecast, by Application 2020 & 2033
- Table 82: India Air Blown Fiber Cable Volume (K) Forecast, by Application 2020 & 2033
- Table 83: Japan Air Blown Fiber Cable Revenue (undefined) Forecast, by Application 2020 & 2033
- Table 84: Japan Air Blown Fiber Cable Volume (K) Forecast, by Application 2020 & 2033
- Table 85: South Korea Air Blown Fiber Cable Revenue (undefined) Forecast, by Application 2020 & 2033
- Table 86: South Korea Air Blown Fiber Cable Volume (K) Forecast, by Application 2020 & 2033
- Table 87: ASEAN Air Blown Fiber Cable Revenue (undefined) Forecast, by Application 2020 & 2033
- Table 88: ASEAN Air Blown Fiber Cable Volume (K) Forecast, by Application 2020 & 2033
- Table 89: Oceania Air Blown Fiber Cable Revenue (undefined) Forecast, by Application 2020 & 2033
- Table 90: Oceania Air Blown Fiber Cable Volume (K) Forecast, by Application 2020 & 2033
- Table 91: Rest of Asia Pacific Air Blown Fiber Cable Revenue (undefined) Forecast, by Application 2020 & 2033
- Table 92: Rest of Asia Pacific Air Blown Fiber Cable Volume (K) Forecast, by Application 2020 & 2033
Frequently Asked Questions
1. What is the projected Compound Annual Growth Rate (CAGR) of the Air Blown Fiber Cable?
The projected CAGR is approximately 4.7%.
2. Which companies are prominent players in the Air Blown Fiber Cable?
Key companies in the market include Prysmian Group, OFS Optics, AFL, ZTT, Leviton, Sumitomo, Corning, Tongding Interconnection Information Co.,Ltd., Hengtong Optic-electric Co.,ltd., Yangtze Optical Fiber and Cable Joint Stock Limited Company, Twentsche(Nanjing)Fiber Optics Ltd., Sopto, Shenzhen Hanxin Communication Optical Cable Co., Ltd., Sichuan Huiyuan Optical Communications Co., Ltd.
3. What are the main segments of the Air Blown Fiber Cable?
The market segments include Application, Type.
4. Can you provide details about the market size?
The market size is estimated to be USD XXX N/A as of 2022.
5. What are some drivers contributing to market growth?
N/A
6. What are the notable trends driving market growth?
N/A
7. Are there any restraints impacting market growth?
N/A
8. Can you provide examples of recent developments in the market?
N/A
9. What pricing options are available for accessing the report?
Pricing options include single-user, multi-user, and enterprise licenses priced at USD 3950.00, USD 5925.00, and USD 7900.00 respectively.
10. Is the market size provided in terms of value or volume?
The market size is provided in terms of value, measured in N/A and volume, measured in K.
11. Are there any specific market keywords associated with the report?
Yes, the market keyword associated with the report is "Air Blown Fiber Cable," which aids in identifying and referencing the specific market segment covered.
12. How do I determine which pricing option suits my needs best?
The pricing options vary based on user requirements and access needs. Individual users may opt for single-user licenses, while businesses requiring broader access may choose multi-user or enterprise licenses for cost-effective access to the report.
13. Are there any additional resources or data provided in the Air Blown Fiber Cable report?
While the report offers comprehensive insights, it's advisable to review the specific contents or supplementary materials provided to ascertain if additional resources or data are available.
14. How can I stay updated on further developments or reports in the Air Blown Fiber Cable?
To stay informed about further developments, trends, and reports in the Air Blown Fiber Cable, consider subscribing to industry newsletters, following relevant companies and organizations, or regularly checking reputable industry news sources and publications.
Methodology
Step 1 - Identification of Relevant Samples Size from Population Database


Step 2 - Approaches for Defining Global Market Size (Value, Volume* & Price*)

Note*: In applicable scenarios
Step 3 - Data Sources
Primary Research
- Web Analytics
- Survey Reports
- Research Institute
- Latest Research Reports
- Opinion Leaders
Secondary Research
- Annual Reports
- White Paper
- Latest Press Release
- Industry Association
- Paid Database
- Investor Presentations

Step 4 - Data Triangulation
Involves using different sources of information in order to increase the validity of a study
These sources are likely to be stakeholders in a program - participants, other researchers, program staff, other community members, and so on.
Then we put all data in single framework & apply various statistical tools to find out the dynamic on the market.
During the analysis stage, feedback from the stakeholder groups would be compared to determine areas of agreement as well as areas of divergence