

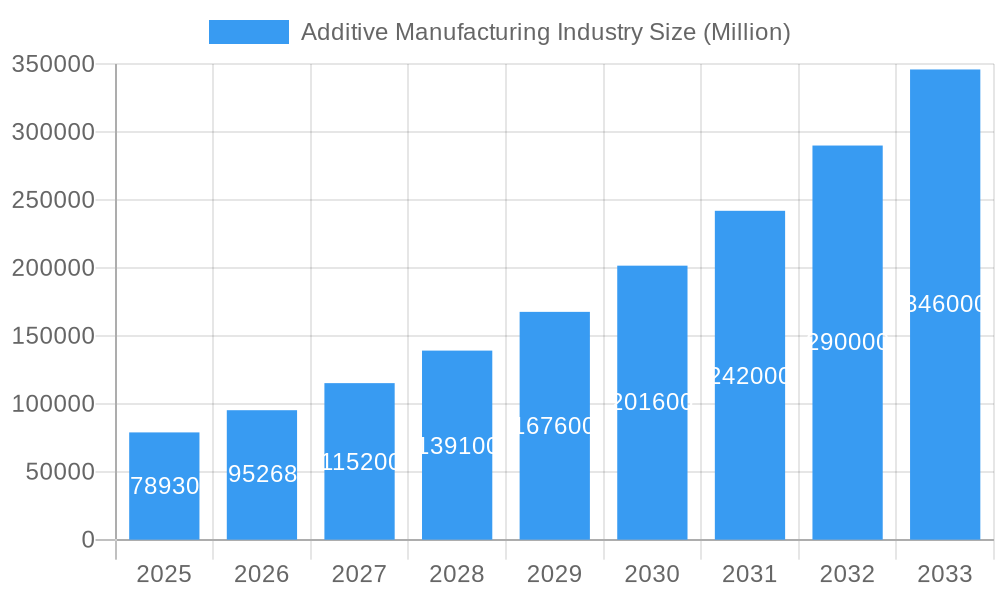
Key Insights
The Additive Manufacturing (AM) industry, also known as 3D printing, is experiencing robust growth, projected to reach a market size of $78.93 billion in 2025, expanding at a Compound Annual Growth Rate (CAGR) of 20.70%. This expansion is driven by several key factors. Firstly, the increasing adoption of AM technologies across diverse sectors like aerospace and defense, automotive, and healthcare is fueling demand. These industries benefit from AM's ability to create complex geometries, lightweight components, and customized solutions, leading to improved product performance and reduced production costs. Secondly, advancements in materials science are expanding the range of printable materials, including high-performance plastics, metals, and ceramics, further broadening AM's applications. Thirdly, the decreasing cost of 3D printing equipment and materials is making the technology more accessible to small and medium-sized enterprises (SMEs), further stimulating market growth. Finally, the rising focus on customization and on-demand manufacturing is creating a favorable environment for AM technologies to thrive.
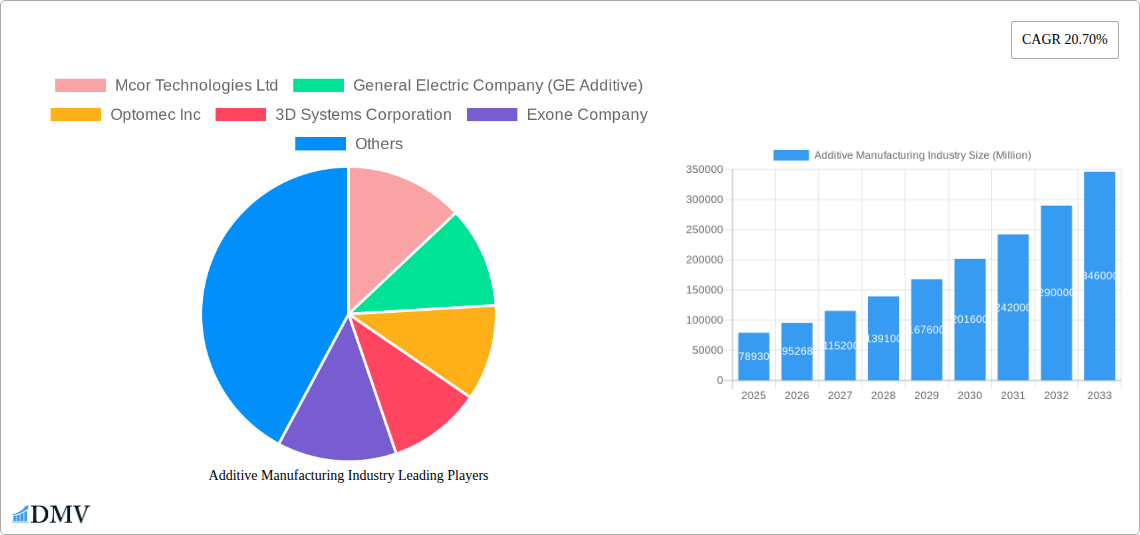
Additive Manufacturing Industry Market Size (In Billion)
However, the growth trajectory is not without challenges. While the technology continues to mature, certain restraints persist. These include the relatively slow printing speeds compared to traditional manufacturing methods, limitations in scalability for mass production, and the need for skilled personnel to operate and maintain AM systems. Despite these challenges, the long-term outlook for the AM industry remains optimistic, fueled by continuous technological advancements, increasing industry adoption, and expanding applications across various sectors. The segmentation by technology (Stereo Lithography, Fused Deposition Modelling, etc.), end-user (Aerospace, Automotive, etc.), and material (Plastics, Metals, Ceramics) highlights the diverse nature of the market and provides opportunities for specialized players to cater to specific niches. The geographical distribution, with significant presence in North America, Europe, and Asia Pacific, indicates a global market with varied regional growth rates driven by factors such as technological maturity, regulatory landscape, and industrial infrastructure.
Additive Manufacturing Industry Company Market Share
Additive Manufacturing Industry: A Comprehensive Market Report (2019-2033)
This insightful report provides a detailed analysis of the Additive Manufacturing (AM) industry, encompassing market trends, technological advancements, key players, and future growth prospects. With a study period spanning 2019-2033, a base year of 2025, and a forecast period of 2025-2033, this report is an indispensable resource for stakeholders seeking to understand and capitalize on the transformative potential of 3D printing. The market is projected to reach xx Million by 2033, exhibiting a robust Compound Annual Growth Rate (CAGR) of xx%.
Additive Manufacturing Industry Market Composition & Trends
The Additive Manufacturing market, valued at xx Million in 2024, is characterized by a moderately concentrated landscape with several key players vying for market share. Innovation is a significant driver, with continuous advancements in 3D printing technologies pushing the boundaries of material science and application possibilities. The regulatory environment, while evolving, generally supports the growth of the industry, although specific regional variations exist. Substitute products, such as traditional manufacturing methods, still hold a significant market share, but the advantages of AM in terms of customization and efficiency are increasingly driving adoption.
Market share is distributed among major players, including but not limited to 3D Systems Corporation, GE Additive, Stratasys Ltd, EOS GmbH, and others. Mergers and acquisitions (M&A) activity is notable, reflecting industry consolidation and strategic expansion efforts. Recent M&A deals have totaled an estimated xx Million, with a notable increase in deal value observed in recent years.
- Market Concentration: Moderately concentrated, with top 5 players holding approximately xx% market share.
- Innovation Catalysts: Advancements in materials science, software integration, and printing technologies.
- Regulatory Landscape: Generally supportive, with regional variations influencing adoption rates.
- Substitute Products: Traditional manufacturing methods, posing competitive pressure.
- End-User Profiles: Diverse, encompassing aerospace, automotive, healthcare, and industrial sectors.
- M&A Activity: Significant, driving industry consolidation and expansion, with recent deal values totaling xx Million.
Additive Manufacturing Industry Industry Evolution
The Additive Manufacturing industry has experienced significant growth driven by technological advancements, expanding applications, and evolving consumer demands. From 2019 to 2024, the market witnessed a CAGR of xx%, and this momentum is expected to continue, with a projected CAGR of xx% from 2025 to 2033. This growth is fueled by factors such as decreasing production costs, increasing material diversity, and the ability to produce complex geometries previously unattainable through traditional manufacturing.
The adoption of AM technologies is accelerating across various industries, driven by the need for customized products, faster prototyping cycles, and efficient production of lightweight, high-strength components. The market is witnessing a shift from prototyping applications to high-volume manufacturing, further catalyzing the industry's growth trajectory. Specifically, the automotive and aerospace sectors are early adopters of AM, utilizing its capabilities for producing lightweight and high-performance parts. Healthcare applications, including implants and prosthetics, are another area experiencing rapid growth. Emerging trends suggest a growing integration of AI and automation within AM workflows, further boosting efficiency and precision. The industry is expected to see increased investment in R&D to expand material capabilities and improve process automation.
Leading Regions, Countries, or Segments in Additive Manufacturing Industry
The Additive Manufacturing market exhibits regional variations in growth and adoption. North America and Europe currently hold dominant positions, driven by substantial investments in R&D, strong technological infrastructure, and significant presence of key players. However, Asia-Pacific is emerging as a key growth region, with rapid adoption in countries like China and Japan.
By Technology: Laser Sintering currently holds the largest segment share followed by Fused Deposition Modelling (FDM) due to its versatility and established market presence. However, Binder Jetting Printing is experiencing rapid growth, driven by its suitability for mass production and cost-effectiveness.
By End User: Aerospace and Defense remains the leading segment, driven by the need for lightweight and high-performance components. The Automotive industry is also experiencing significant growth, driven by AM's ability to optimize design and reduce lead times. The Healthcare sector is exhibiting robust growth due to the creation of customized implants and prosthetics.
By Material: Metals currently hold the largest market share, followed by plastics and ceramics. The demand for high-performance metal components is driving significant investments in metal AM technologies.
- Key Drivers (North America & Europe): Strong government support for R&D, advanced technological infrastructure, established industry presence.
- Key Drivers (Asia-Pacific): Rapid industrialization, growing investment in advanced manufacturing technologies, increasing consumer demand.
Additive Manufacturing Industry Product Innovations
Recent product innovations focus on increased speed, precision, and material diversity. New materials are continually being developed, expanding the scope of AM applications, including high-temperature alloys, biocompatible materials, and advanced polymers. Furthermore, software advancements are improving the design and manufacturing processes, allowing for greater efficiency and complexity in printed parts. Unique selling propositions increasingly focus on reducing production costs, enabling mass customization, and shortening lead times compared to traditional manufacturing methods.
Propelling Factors for Additive Manufacturing Industry Growth
Technological advancements, such as improved printing speeds, enhanced material capabilities, and integrated software solutions, are key growth drivers. Economically, the ability of AM to reduce material waste, shorten lead times, and customize production significantly lowers overall manufacturing costs, bolstering market growth. Regulatory support, in the form of government grants, tax incentives, and industry-specific regulations, further encourages adoption and investment.
Obstacles in the Additive Manufacturing Industry Market
High initial investment costs for equipment and materials remain a significant barrier, limiting entry for smaller businesses. Supply chain disruptions, especially those affecting specialized materials, pose challenges for consistent production. Intense competition among established players and the emergence of new entrants creates a dynamic and competitive market landscape.
Future Opportunities in Additive Manufacturing Industry
The industry is poised for growth through the expansion into new markets, particularly in personalized medicine, construction, and consumer goods. Technological advancements, such as multi-material printing and artificial intelligence integration, will further expand AM's capabilities. Emerging consumer trends towards customization and on-demand manufacturing will further drive market growth.
Major Players in the Additive Manufacturing Industry Ecosystem
- Mcor Technologies Ltd
- General Electric Company (GE Additive)
- Optomec Inc
- 3D Systems Corporation
- Exone Company
- SLM Solutions Group AG
- EOS GmbH
- Materialise NV
- Stratasys Ltd
- EnvisionTEC GmbH
Key Developments in Additive Manufacturing Industry Industry
- March 2023: Merz Dental partnered with Nexa 3D, boosting dental desktop 3D printing.
- October 2022: GE Additive launched its Series 3 binder jet platform for industrial-scale metal part production (over 140,000 components produced, 15% more fuel-efficient).
- July 2022: Toyota began producing and selling stock parts using HP Multi Jet Fusion 3D printing, optimizing designs and lead times.
Strategic Additive Manufacturing Industry Market Forecast
The Additive Manufacturing industry is poised for continued strong growth, driven by technological advancements, expanding applications, and increasing adoption across various sectors. Future opportunities lie in the development of new materials, software integrations, and the expansion into new markets. The market is expected to see significant growth in the coming years, driven by the factors discussed above and the potential for disruption in various industries.
Additive Manufacturing Industry Segmentation
-
1. Technology
- 1.1. Stereo Lithography
- 1.2. Fused Deposition Modelling
- 1.3. Laser Sintering
- 1.4. Binder Jetting Printing
- 1.5. Other Technologies
-
2. End User
- 2.1. Aerospace and Defense
- 2.2. Automotive
- 2.3. Healthcare
- 2.4. Industrial
- 2.5. Other End Users
-
3. Material
- 3.1. Plastic
- 3.2. Metals
- 3.3. Ceramics
Additive Manufacturing Industry Segmentation By Geography
-
1. North America
- 1.1. United States
- 1.2. Canada
-
2. Europe
- 2.1. United Kingdom
- 2.2. Germany
- 2.3. France
- 2.4. Rest of Europe
-
3. Asia Pacific
- 3.1. China
- 3.2. Japan
- 3.3. India
- 3.4. Rest of Asia Pacific
-
4. Latin America
- 4.1. Brazil
- 4.2. Mexico
- 4.3. Argentina
- 4.4. Rest of Latin America
- 5. Middle East
-
6. UAE
- 6.1. Saudi Arabia
- 6.2. Israel
- 6.3. South Africa
- 6.4. Rest of Middle East
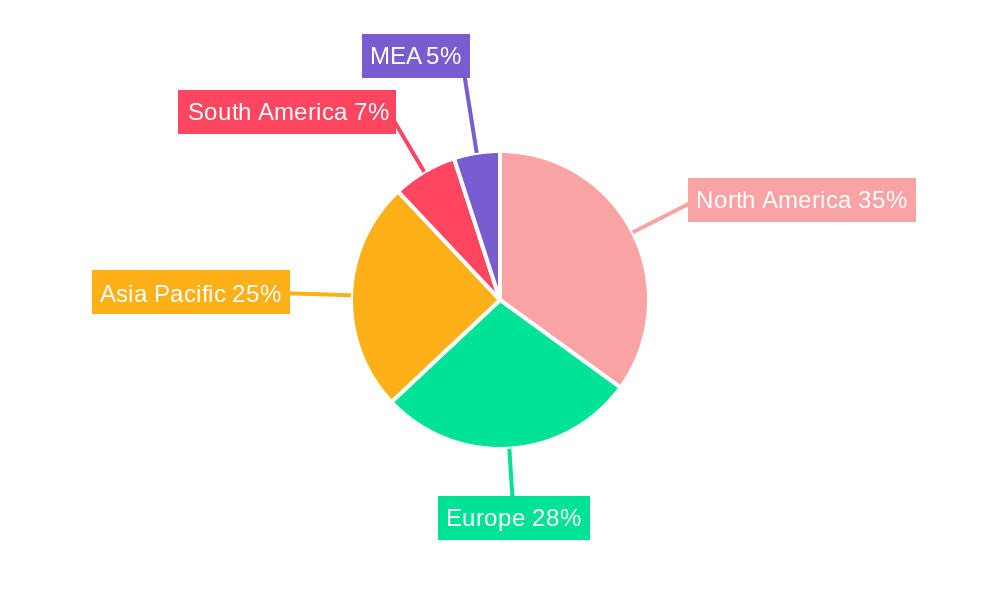
Additive Manufacturing Industry Regional Market Share
Geographic Coverage of Additive Manufacturing Industry
Additive Manufacturing Industry REPORT HIGHLIGHTS
| Aspects | Details |
|---|---|
| Study Period | 2020-2034 |
| Base Year | 2025 |
| Estimated Year | 2026 |
| Forecast Period | 2026-2034 |
| Historical Period | 2020-2025 |
| Growth Rate | CAGR of 20.70% from 2020-2034 |
| Segmentation |
|
Table of Contents
- 1. Introduction
- 1.1. Research Scope
- 1.2. Market Segmentation
- 1.3. Research Objective
- 1.4. Definitions and Assumptions
- 2. Executive Summary
- 2.1. Market Snapshot
- 3. Market Dynamics
- 3.1. Market Drivers
- 3.2. Market Restrains
- 3.3. Market Trends
- 3.4. Market Opportunities
- 4. Market Factor Analysis
- 4.1. Porters Five Forces
- 4.1.1. Bargaining Power of Suppliers
- 4.1.2. Bargaining Power of Buyers
- 4.1.3. Threat of New Entrants
- 4.1.4. Threat of Substitutes
- 4.1.5. Competitive Rivalry
- 4.2. PESTEL analysis
- 4.3. BCG Analysis
- 4.3.1. Stars (High Growth, High Market Share)
- 4.3.2. Cash Cows (Low Growth, High Market Share)
- 4.3.3. Question Mark (High Growth, Low Market Share)
- 4.3.4. Dogs (Low Growth, Low Market Share)
- 4.4. Ansoff Matrix Analysis
- 4.5. Supply Chain Analysis
- 4.6. Regulatory Landscape
- 4.7. Current Market Potential and Opportunity Assessment (TAM–SAM–SOM Framework)
- 4.8. DMV Analyst Note
- 4.1. Porters Five Forces
- 5. Market Analysis, Insights and Forecast 2021-2033
- 5.1. Market Analysis, Insights and Forecast - by Technology
- 5.1.1. Stereo Lithography
- 5.1.2. Fused Deposition Modelling
- 5.1.3. Laser Sintering
- 5.1.4. Binder Jetting Printing
- 5.1.5. Other Technologies
- 5.2. Market Analysis, Insights and Forecast - by End User
- 5.2.1. Aerospace and Defense
- 5.2.2. Automotive
- 5.2.3. Healthcare
- 5.2.4. Industrial
- 5.2.5. Other End Users
- 5.3. Market Analysis, Insights and Forecast - by Material
- 5.3.1. Plastic
- 5.3.2. Metals
- 5.3.3. Ceramics
- 5.4. Market Analysis, Insights and Forecast - by Region
- 5.4.1. North America
- 5.4.2. Europe
- 5.4.3. Asia Pacific
- 5.4.4. Latin America
- 5.4.5. Middle East
- 5.4.6. UAE
- 5.1. Market Analysis, Insights and Forecast - by Technology
- 6. Global Additive Manufacturing Industry Analysis, Insights and Forecast, 2021-2033
- 6.1. Market Analysis, Insights and Forecast - by Technology
- 6.1.1. Stereo Lithography
- 6.1.2. Fused Deposition Modelling
- 6.1.3. Laser Sintering
- 6.1.4. Binder Jetting Printing
- 6.1.5. Other Technologies
- 6.2. Market Analysis, Insights and Forecast - by End User
- 6.2.1. Aerospace and Defense
- 6.2.2. Automotive
- 6.2.3. Healthcare
- 6.2.4. Industrial
- 6.2.5. Other End Users
- 6.3. Market Analysis, Insights and Forecast - by Material
- 6.3.1. Plastic
- 6.3.2. Metals
- 6.3.3. Ceramics
- 6.1. Market Analysis, Insights and Forecast - by Technology
- 7. North America Additive Manufacturing Industry Analysis, Insights and Forecast, 2020-2032
- 7.1. Market Analysis, Insights and Forecast - by Technology
- 7.1.1. Stereo Lithography
- 7.1.2. Fused Deposition Modelling
- 7.1.3. Laser Sintering
- 7.1.4. Binder Jetting Printing
- 7.1.5. Other Technologies
- 7.2. Market Analysis, Insights and Forecast - by End User
- 7.2.1. Aerospace and Defense
- 7.2.2. Automotive
- 7.2.3. Healthcare
- 7.2.4. Industrial
- 7.2.5. Other End Users
- 7.3. Market Analysis, Insights and Forecast - by Material
- 7.3.1. Plastic
- 7.3.2. Metals
- 7.3.3. Ceramics
- 7.1. Market Analysis, Insights and Forecast - by Technology
- 8. Europe Additive Manufacturing Industry Analysis, Insights and Forecast, 2020-2032
- 8.1. Market Analysis, Insights and Forecast - by Technology
- 8.1.1. Stereo Lithography
- 8.1.2. Fused Deposition Modelling
- 8.1.3. Laser Sintering
- 8.1.4. Binder Jetting Printing
- 8.1.5. Other Technologies
- 8.2. Market Analysis, Insights and Forecast - by End User
- 8.2.1. Aerospace and Defense
- 8.2.2. Automotive
- 8.2.3. Healthcare
- 8.2.4. Industrial
- 8.2.5. Other End Users
- 8.3. Market Analysis, Insights and Forecast - by Material
- 8.3.1. Plastic
- 8.3.2. Metals
- 8.3.3. Ceramics
- 8.1. Market Analysis, Insights and Forecast - by Technology
- 9. Asia Pacific Additive Manufacturing Industry Analysis, Insights and Forecast, 2020-2032
- 9.1. Market Analysis, Insights and Forecast - by Technology
- 9.1.1. Stereo Lithography
- 9.1.2. Fused Deposition Modelling
- 9.1.3. Laser Sintering
- 9.1.4. Binder Jetting Printing
- 9.1.5. Other Technologies
- 9.2. Market Analysis, Insights and Forecast - by End User
- 9.2.1. Aerospace and Defense
- 9.2.2. Automotive
- 9.2.3. Healthcare
- 9.2.4. Industrial
- 9.2.5. Other End Users
- 9.3. Market Analysis, Insights and Forecast - by Material
- 9.3.1. Plastic
- 9.3.2. Metals
- 9.3.3. Ceramics
- 9.1. Market Analysis, Insights and Forecast - by Technology
- 10. Latin America Additive Manufacturing Industry Analysis, Insights and Forecast, 2020-2032
- 10.1. Market Analysis, Insights and Forecast - by Technology
- 10.1.1. Stereo Lithography
- 10.1.2. Fused Deposition Modelling
- 10.1.3. Laser Sintering
- 10.1.4. Binder Jetting Printing
- 10.1.5. Other Technologies
- 10.2. Market Analysis, Insights and Forecast - by End User
- 10.2.1. Aerospace and Defense
- 10.2.2. Automotive
- 10.2.3. Healthcare
- 10.2.4. Industrial
- 10.2.5. Other End Users
- 10.3. Market Analysis, Insights and Forecast - by Material
- 10.3.1. Plastic
- 10.3.2. Metals
- 10.3.3. Ceramics
- 10.1. Market Analysis, Insights and Forecast - by Technology
- 11. Middle East Additive Manufacturing Industry Analysis, Insights and Forecast, 2020-2032
- 11.1. Market Analysis, Insights and Forecast - by Technology
- 11.1.1. Stereo Lithography
- 11.1.2. Fused Deposition Modelling
- 11.1.3. Laser Sintering
- 11.1.4. Binder Jetting Printing
- 11.1.5. Other Technologies
- 11.2. Market Analysis, Insights and Forecast - by End User
- 11.2.1. Aerospace and Defense
- 11.2.2. Automotive
- 11.2.3. Healthcare
- 11.2.4. Industrial
- 11.2.5. Other End Users
- 11.3. Market Analysis, Insights and Forecast - by Material
- 11.3.1. Plastic
- 11.3.2. Metals
- 11.3.3. Ceramics
- 11.1. Market Analysis, Insights and Forecast - by Technology
- 12. UAE Additive Manufacturing Industry Analysis, Insights and Forecast, 2020-2032
- 12.1. Market Analysis, Insights and Forecast - by Technology
- 12.1.1. Stereo Lithography
- 12.1.2. Fused Deposition Modelling
- 12.1.3. Laser Sintering
- 12.1.4. Binder Jetting Printing
- 12.1.5. Other Technologies
- 12.2. Market Analysis, Insights and Forecast - by End User
- 12.2.1. Aerospace and Defense
- 12.2.2. Automotive
- 12.2.3. Healthcare
- 12.2.4. Industrial
- 12.2.5. Other End Users
- 12.3. Market Analysis, Insights and Forecast - by Material
- 12.3.1. Plastic
- 12.3.2. Metals
- 12.3.3. Ceramics
- 12.1. Market Analysis, Insights and Forecast - by Technology
- 13. Competitive Analysis
- 13.1. Company Profiles
- 13.1.1 Mcor Technologies Ltd
- 13.1.1.1. Company Overview
- 13.1.1.2. Products
- 13.1.1.3. Company Financials
- 13.1.1.4. SWOT Analysis
- 13.1.2 General Electric Company (GE Additive)
- 13.1.2.1. Company Overview
- 13.1.2.2. Products
- 13.1.2.3. Company Financials
- 13.1.2.4. SWOT Analysis
- 13.1.3 Optomec Inc
- 13.1.3.1. Company Overview
- 13.1.3.2. Products
- 13.1.3.3. Company Financials
- 13.1.3.4. SWOT Analysis
- 13.1.4 3D Systems Corporation
- 13.1.4.1. Company Overview
- 13.1.4.2. Products
- 13.1.4.3. Company Financials
- 13.1.4.4. SWOT Analysis
- 13.1.5 Exone Company
- 13.1.5.1. Company Overview
- 13.1.5.2. Products
- 13.1.5.3. Company Financials
- 13.1.5.4. SWOT Analysis
- 13.1.6 SLM Solutions Group AG*List Not Exhaustive
- 13.1.6.1. Company Overview
- 13.1.6.2. Products
- 13.1.6.3. Company Financials
- 13.1.6.4. SWOT Analysis
- 13.1.7 EOS GmbH
- 13.1.7.1. Company Overview
- 13.1.7.2. Products
- 13.1.7.3. Company Financials
- 13.1.7.4. SWOT Analysis
- 13.1.8 Materialise NV
- 13.1.8.1. Company Overview
- 13.1.8.2. Products
- 13.1.8.3. Company Financials
- 13.1.8.4. SWOT Analysis
- 13.1.9 Stratasys Ltd
- 13.1.9.1. Company Overview
- 13.1.9.2. Products
- 13.1.9.3. Company Financials
- 13.1.9.4. SWOT Analysis
- 13.1.10 EnvisionTEC GmbH
- 13.1.10.1. Company Overview
- 13.1.10.2. Products
- 13.1.10.3. Company Financials
- 13.1.10.4. SWOT Analysis
- 13.1.1 Mcor Technologies Ltd
- 13.2. Market Entropy
- 13.2.1 Company's Key Areas Served
- 13.2.2 Recent Developments
- 13.3. Company Market Share Analysis 2025
- 13.3.1 Top 5 Companies Market Share Analysis
- 13.3.2 Top 3 Companies Market Share Analysis
- 13.4. List of Potential Customers
- 14. Research Methodology
List of Figures
- Figure 1: Global Additive Manufacturing Industry Revenue Breakdown (Million, %) by Region 2025 & 2033
- Figure 2: North America Additive Manufacturing Industry Revenue (Million), by Technology 2025 & 2033
- Figure 3: North America Additive Manufacturing Industry Revenue Share (%), by Technology 2025 & 2033
- Figure 4: North America Additive Manufacturing Industry Revenue (Million), by End User 2025 & 2033
- Figure 5: North America Additive Manufacturing Industry Revenue Share (%), by End User 2025 & 2033
- Figure 6: North America Additive Manufacturing Industry Revenue (Million), by Material 2025 & 2033
- Figure 7: North America Additive Manufacturing Industry Revenue Share (%), by Material 2025 & 2033
- Figure 8: North America Additive Manufacturing Industry Revenue (Million), by Country 2025 & 2033
- Figure 9: North America Additive Manufacturing Industry Revenue Share (%), by Country 2025 & 2033
- Figure 10: Europe Additive Manufacturing Industry Revenue (Million), by Technology 2025 & 2033
- Figure 11: Europe Additive Manufacturing Industry Revenue Share (%), by Technology 2025 & 2033
- Figure 12: Europe Additive Manufacturing Industry Revenue (Million), by End User 2025 & 2033
- Figure 13: Europe Additive Manufacturing Industry Revenue Share (%), by End User 2025 & 2033
- Figure 14: Europe Additive Manufacturing Industry Revenue (Million), by Material 2025 & 2033
- Figure 15: Europe Additive Manufacturing Industry Revenue Share (%), by Material 2025 & 2033
- Figure 16: Europe Additive Manufacturing Industry Revenue (Million), by Country 2025 & 2033
- Figure 17: Europe Additive Manufacturing Industry Revenue Share (%), by Country 2025 & 2033
- Figure 18: Asia Pacific Additive Manufacturing Industry Revenue (Million), by Technology 2025 & 2033
- Figure 19: Asia Pacific Additive Manufacturing Industry Revenue Share (%), by Technology 2025 & 2033
- Figure 20: Asia Pacific Additive Manufacturing Industry Revenue (Million), by End User 2025 & 2033
- Figure 21: Asia Pacific Additive Manufacturing Industry Revenue Share (%), by End User 2025 & 2033
- Figure 22: Asia Pacific Additive Manufacturing Industry Revenue (Million), by Material 2025 & 2033
- Figure 23: Asia Pacific Additive Manufacturing Industry Revenue Share (%), by Material 2025 & 2033
- Figure 24: Asia Pacific Additive Manufacturing Industry Revenue (Million), by Country 2025 & 2033
- Figure 25: Asia Pacific Additive Manufacturing Industry Revenue Share (%), by Country 2025 & 2033
- Figure 26: Latin America Additive Manufacturing Industry Revenue (Million), by Technology 2025 & 2033
- Figure 27: Latin America Additive Manufacturing Industry Revenue Share (%), by Technology 2025 & 2033
- Figure 28: Latin America Additive Manufacturing Industry Revenue (Million), by End User 2025 & 2033
- Figure 29: Latin America Additive Manufacturing Industry Revenue Share (%), by End User 2025 & 2033
- Figure 30: Latin America Additive Manufacturing Industry Revenue (Million), by Material 2025 & 2033
- Figure 31: Latin America Additive Manufacturing Industry Revenue Share (%), by Material 2025 & 2033
- Figure 32: Latin America Additive Manufacturing Industry Revenue (Million), by Country 2025 & 2033
- Figure 33: Latin America Additive Manufacturing Industry Revenue Share (%), by Country 2025 & 2033
- Figure 34: Middle East Additive Manufacturing Industry Revenue (Million), by Technology 2025 & 2033
- Figure 35: Middle East Additive Manufacturing Industry Revenue Share (%), by Technology 2025 & 2033
- Figure 36: Middle East Additive Manufacturing Industry Revenue (Million), by End User 2025 & 2033
- Figure 37: Middle East Additive Manufacturing Industry Revenue Share (%), by End User 2025 & 2033
- Figure 38: Middle East Additive Manufacturing Industry Revenue (Million), by Material 2025 & 2033
- Figure 39: Middle East Additive Manufacturing Industry Revenue Share (%), by Material 2025 & 2033
- Figure 40: Middle East Additive Manufacturing Industry Revenue (Million), by Country 2025 & 2033
- Figure 41: Middle East Additive Manufacturing Industry Revenue Share (%), by Country 2025 & 2033
- Figure 42: UAE Additive Manufacturing Industry Revenue (Million), by Technology 2025 & 2033
- Figure 43: UAE Additive Manufacturing Industry Revenue Share (%), by Technology 2025 & 2033
- Figure 44: UAE Additive Manufacturing Industry Revenue (Million), by End User 2025 & 2033
- Figure 45: UAE Additive Manufacturing Industry Revenue Share (%), by End User 2025 & 2033
- Figure 46: UAE Additive Manufacturing Industry Revenue (Million), by Material 2025 & 2033
- Figure 47: UAE Additive Manufacturing Industry Revenue Share (%), by Material 2025 & 2033
- Figure 48: UAE Additive Manufacturing Industry Revenue (Million), by Country 2025 & 2033
- Figure 49: UAE Additive Manufacturing Industry Revenue Share (%), by Country 2025 & 2033
List of Tables
- Table 1: Global Additive Manufacturing Industry Revenue Million Forecast, by Technology 2020 & 2033
- Table 2: Global Additive Manufacturing Industry Revenue Million Forecast, by End User 2020 & 2033
- Table 3: Global Additive Manufacturing Industry Revenue Million Forecast, by Material 2020 & 2033
- Table 4: Global Additive Manufacturing Industry Revenue Million Forecast, by Region 2020 & 2033
- Table 5: Global Additive Manufacturing Industry Revenue Million Forecast, by Technology 2020 & 2033
- Table 6: Global Additive Manufacturing Industry Revenue Million Forecast, by End User 2020 & 2033
- Table 7: Global Additive Manufacturing Industry Revenue Million Forecast, by Material 2020 & 2033
- Table 8: Global Additive Manufacturing Industry Revenue Million Forecast, by Country 2020 & 2033
- Table 9: United States Additive Manufacturing Industry Revenue (Million) Forecast, by Application 2020 & 2033
- Table 10: Canada Additive Manufacturing Industry Revenue (Million) Forecast, by Application 2020 & 2033
- Table 11: Global Additive Manufacturing Industry Revenue Million Forecast, by Technology 2020 & 2033
- Table 12: Global Additive Manufacturing Industry Revenue Million Forecast, by End User 2020 & 2033
- Table 13: Global Additive Manufacturing Industry Revenue Million Forecast, by Material 2020 & 2033
- Table 14: Global Additive Manufacturing Industry Revenue Million Forecast, by Country 2020 & 2033
- Table 15: United Kingdom Additive Manufacturing Industry Revenue (Million) Forecast, by Application 2020 & 2033
- Table 16: Germany Additive Manufacturing Industry Revenue (Million) Forecast, by Application 2020 & 2033
- Table 17: France Additive Manufacturing Industry Revenue (Million) Forecast, by Application 2020 & 2033
- Table 18: Rest of Europe Additive Manufacturing Industry Revenue (Million) Forecast, by Application 2020 & 2033
- Table 19: Global Additive Manufacturing Industry Revenue Million Forecast, by Technology 2020 & 2033
- Table 20: Global Additive Manufacturing Industry Revenue Million Forecast, by End User 2020 & 2033
- Table 21: Global Additive Manufacturing Industry Revenue Million Forecast, by Material 2020 & 2033
- Table 22: Global Additive Manufacturing Industry Revenue Million Forecast, by Country 2020 & 2033
- Table 23: China Additive Manufacturing Industry Revenue (Million) Forecast, by Application 2020 & 2033
- Table 24: Japan Additive Manufacturing Industry Revenue (Million) Forecast, by Application 2020 & 2033
- Table 25: India Additive Manufacturing Industry Revenue (Million) Forecast, by Application 2020 & 2033
- Table 26: Rest of Asia Pacific Additive Manufacturing Industry Revenue (Million) Forecast, by Application 2020 & 2033
- Table 27: Global Additive Manufacturing Industry Revenue Million Forecast, by Technology 2020 & 2033
- Table 28: Global Additive Manufacturing Industry Revenue Million Forecast, by End User 2020 & 2033
- Table 29: Global Additive Manufacturing Industry Revenue Million Forecast, by Material 2020 & 2033
- Table 30: Global Additive Manufacturing Industry Revenue Million Forecast, by Country 2020 & 2033
- Table 31: Brazil Additive Manufacturing Industry Revenue (Million) Forecast, by Application 2020 & 2033
- Table 32: Mexico Additive Manufacturing Industry Revenue (Million) Forecast, by Application 2020 & 2033
- Table 33: Argentina Additive Manufacturing Industry Revenue (Million) Forecast, by Application 2020 & 2033
- Table 34: Rest of Latin America Additive Manufacturing Industry Revenue (Million) Forecast, by Application 2020 & 2033
- Table 35: Global Additive Manufacturing Industry Revenue Million Forecast, by Technology 2020 & 2033
- Table 36: Global Additive Manufacturing Industry Revenue Million Forecast, by End User 2020 & 2033
- Table 37: Global Additive Manufacturing Industry Revenue Million Forecast, by Material 2020 & 2033
- Table 38: Global Additive Manufacturing Industry Revenue Million Forecast, by Country 2020 & 2033
- Table 39: Global Additive Manufacturing Industry Revenue Million Forecast, by Technology 2020 & 2033
- Table 40: Global Additive Manufacturing Industry Revenue Million Forecast, by End User 2020 & 2033
- Table 41: Global Additive Manufacturing Industry Revenue Million Forecast, by Material 2020 & 2033
- Table 42: Global Additive Manufacturing Industry Revenue Million Forecast, by Country 2020 & 2033
- Table 43: Saudi Arabia Additive Manufacturing Industry Revenue (Million) Forecast, by Application 2020 & 2033
- Table 44: Israel Additive Manufacturing Industry Revenue (Million) Forecast, by Application 2020 & 2033
- Table 45: South Africa Additive Manufacturing Industry Revenue (Million) Forecast, by Application 2020 & 2033
- Table 46: Rest of Middle East Additive Manufacturing Industry Revenue (Million) Forecast, by Application 2020 & 2033
Frequently Asked Questions
1. What is the projected Compound Annual Growth Rate (CAGR) of the Additive Manufacturing Industry?
The projected CAGR is approximately 20.70%.
2. Which companies are prominent players in the Additive Manufacturing Industry?
Key companies in the market include Mcor Technologies Ltd, General Electric Company (GE Additive), Optomec Inc, 3D Systems Corporation, Exone Company, SLM Solutions Group AG*List Not Exhaustive, EOS GmbH, Materialise NV, Stratasys Ltd, EnvisionTEC GmbH.
3. What are the main segments of the Additive Manufacturing Industry?
The market segments include Technology, End User, Material.
4. Can you provide details about the market size?
The market size is estimated to be USD 78.93 Million as of 2022.
5. What are some drivers contributing to market growth?
New and Improved Technologies to Drive Product Customization; Demand for Lightweight Construction in Automotive and Aerospace Industries.
6. What are the notable trends driving market growth?
Automotive to is expected Hold a Significant Share.
7. Are there any restraints impacting market growth?
Concerns over Intellectual Property Protection.
8. Can you provide examples of recent developments in the market?
March 2023 - Merz Dental, a digital dentistry company, partnered with Nexa 3D, the polymer 3D printing leader. The partnership will support the consumers of Nexa 3D throughout Germany. The 3D printing platform is fast and accurate to increase professional and dental desktop 3D printing use. The desktop 3D printer serves a wide variety of engineering and dental applications, including orthodontic models, splints, and surgical guides
9. What pricing options are available for accessing the report?
Pricing options include single-user, multi-user, and enterprise licenses priced at USD 4750, USD 5250, and USD 8750 respectively.
10. Is the market size provided in terms of value or volume?
The market size is provided in terms of value, measured in Million.
11. Are there any specific market keywords associated with the report?
Yes, the market keyword associated with the report is "Additive Manufacturing Industry," which aids in identifying and referencing the specific market segment covered.
12. How do I determine which pricing option suits my needs best?
The pricing options vary based on user requirements and access needs. Individual users may opt for single-user licenses, while businesses requiring broader access may choose multi-user or enterprise licenses for cost-effective access to the report.
13. Are there any additional resources or data provided in the Additive Manufacturing Industry report?
While the report offers comprehensive insights, it's advisable to review the specific contents or supplementary materials provided to ascertain if additional resources or data are available.
14. How can I stay updated on further developments or reports in the Additive Manufacturing Industry?
To stay informed about further developments, trends, and reports in the Additive Manufacturing Industry, consider subscribing to industry newsletters, following relevant companies and organizations, or regularly checking reputable industry news sources and publications.
Methodology
Step 1 - Identification of Relevant Samples Size from Population Database


Step 2 - Approaches for Defining Global Market Size (Value, Volume* & Price*)

Note*: In applicable scenarios
Step 3 - Data Sources
Primary Research
- Web Analytics
- Survey Reports
- Research Institute
- Latest Research Reports
- Opinion Leaders
Secondary Research
- Annual Reports
- White Paper
- Latest Press Release
- Industry Association
- Paid Database
- Investor Presentations

Step 4 - Data Triangulation
Involves using different sources of information in order to increase the validity of a study
These sources are likely to be stakeholders in a program - participants, other researchers, program staff, other community members, and so on.
Then we put all data in single framework & apply various statistical tools to find out the dynamic on the market.
During the analysis stage, feedback from the stakeholder groups would be compared to determine areas of agreement as well as areas of divergence