

Key Insights
The 5G RedCap Chip Market is poised for exponential growth, driven by the escalating demand for power-efficient, cost-optimized 5G connectivity solutions for a diverse range of Internet of Things (IoT) applications. Valued at an estimated $500 million in 2025, the market is projected to skyrocket to approximately $6,955.5 million by 2034, exhibiting a remarkable Compound Annual Growth Rate (CAGR) of 35% during the forecast period. This rapid expansion is underpinned by several key demand drivers and macro tailwinds.
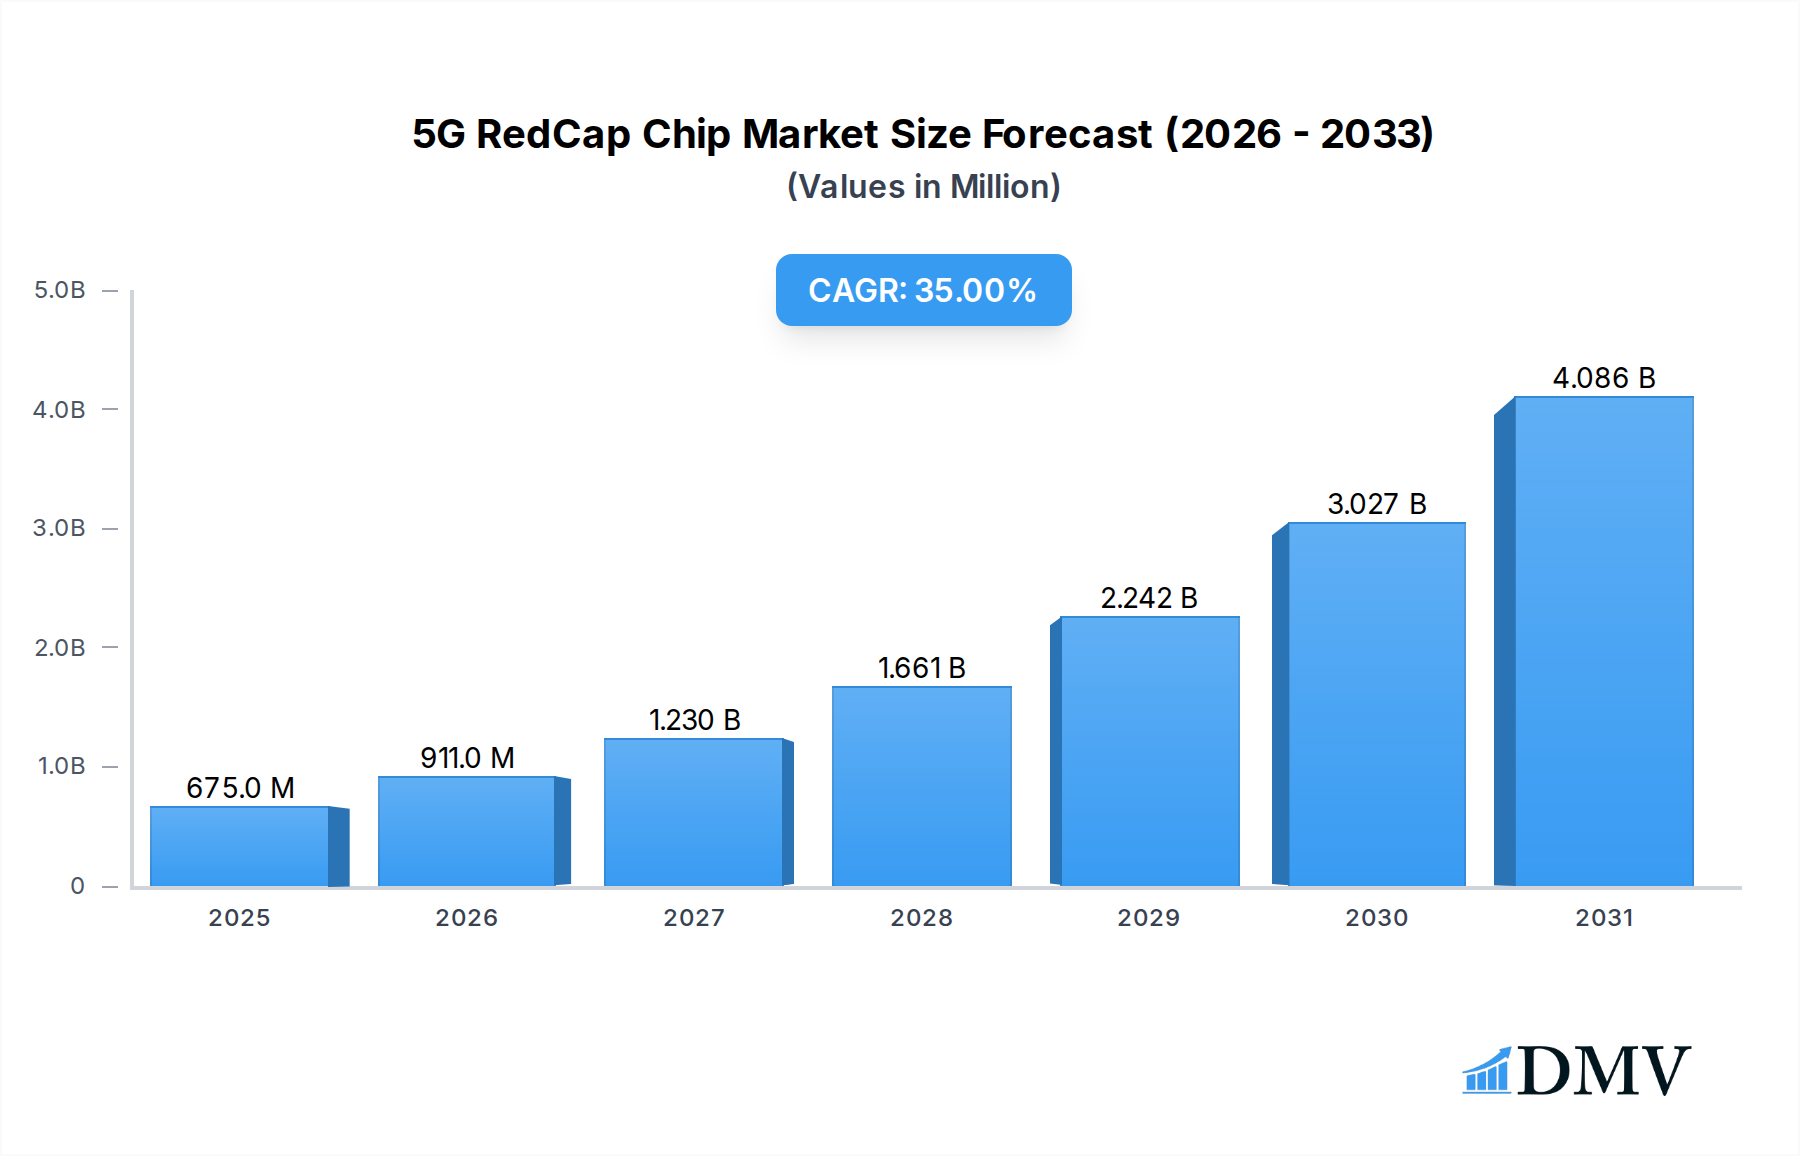
5G RedCap Chip Market Size (In Million)
The primary impetus for this growth stems from RedCap (Reduced Capability) 5G's ability to bridge the gap between traditional LTE-M/NB-IoT and full-fledged 5G eMBB (enhanced Mobile Broadband), offering a sweet spot for medium-speed, low-complexity, and power-sensitive devices. Industries are increasingly seeking to upgrade their legacy IoT infrastructure to leverage 5G's benefits, without incurring the cost and complexity associated with high-bandwidth 5G modules. This makes the 5G RedCap Chip Market a critical enabler for the next generation of industrial IoT, smart city deployments, and connected consumer electronics.

5G RedCap Chip Company Market Share
Macro tailwinds include the global proliferation of 5G networks, supportive regulatory frameworks for IoT spectrum, and increasing enterprise investment in digital transformation initiatives. The expanding Cellular IoT Chipset Market is a direct beneficiary of RedCap's emergence, as it provides a standardized, future-proof pathway for massive IoT deployments. Furthermore, the burgeoning ecosystem of IoT Devices Market across various verticals, from wearables to industrial sensors, necessitates chipsets that can deliver optimized performance in terms of power consumption, latency, and throughput. This creates a fertile ground for RedCap adoption, particularly in applications where devices are battery-powered and require long operational lifespans. The forward-looking outlook indicates that the 5G RedCap Chip Market will be pivotal in accelerating 5G's penetration into new verticals, driving innovation, and fostering a more connected and intelligent world.
Telematics & Automotive Application Segment Dominance in 5G RedCap Chip Market
Within the diverse application landscape of the 5G RedCap Chip Market, the Telematics & Automotive segment is identified as a significant and potentially dominant force by revenue share. This assertion is based on the intrinsic requirements of modern automotive and transportation systems for highly reliable, low-latency, and energy-efficient cellular connectivity, which RedCap is uniquely positioned to address. While precise revenue share data for individual segments is proprietary and dynamic, the strategic importance and high-value nature of automotive applications consistently position them at the forefront of advanced connectivity technology adoption.
Connected vehicles, including autonomous driving systems, advanced driver-assistance systems (ADAS), in-car infotainment, and vehicle-to-everything (V2X) communication, demand robust wireless links. RedCap offers a compelling alternative to full 5G modules by providing sufficient bandwidth for many telematics functions, such as real-time diagnostics, over-the-air (OTA) updates, and precise navigation, while significantly reducing power consumption and hardware costs. This makes it ideal for a vast array of embedded modules within vehicles that don't require multi-gigabit speeds but critically depend on network reliability and responsiveness. The growth of the broader Automotive Electronics Market further underpins the dominance of this application area, as manufacturers integrate more sophisticated connectivity features into vehicles across all price points.
Key players in the 5G RedCap Chip Market, such as Qualcomm Technologies, Inc. and MediaTek Inc., are actively developing and promoting solutions tailored for automotive use cases, understanding the stringent requirements for quality, longevity, and security in this sector. For instance, RedCap chipsets can facilitate efficient data exchange for fleet management, logistics, and public transportation, enabling smarter infrastructure and improved operational efficiency. The integration of 5G RedCap into vehicles offers a pathway for enhanced safety features, more efficient traffic management, and new mobility services. While the Single Mode Chip Market and Dual Mode Chip Market segments exist across various applications, the specific demands of the automotive sector for dedicated, purpose-built solutions often translate into higher average selling prices and dedicated development cycles, contributing disproportionately to revenue.
This segment's share is anticipated to grow, driven by mandates for connected safety features, the proliferation of electric vehicles (EVs) requiring smart charging and remote management, and the ongoing evolution towards autonomous driving. The consolidation of share might occur as automotive-grade certified chipsets become standard, favoring vendors with proven track records in reliability and long-term support. The cost-effectiveness and optimized performance profile of RedCap make it a critical technology for widespread adoption in both passenger and commercial vehicles, solidifying the Telematics & Automotive application segment's pivotal role in the overall 5G RedCap Chip Market.
Technological Drivers & Market Constraints in 5G RedCap Chip Market
The 5G RedCap Chip Market's trajectory is primarily shaped by a confluence of potent technological drivers and inherent market constraints. A pivotal driver is RedCap's optimized balance of capabilities, offering 5G efficiency for devices that don't require extreme bandwidth. This addresses a significant market gap by providing higher throughput and lower latency than LTE-M or NB-IoT, yet with reduced complexity, power consumption, and cost compared to full 5G NR modules. This makes it highly attractive for various industrial and consumer IoT Devices Market applications, where battery life and economic deployment are critical.
Another significant driver is the global build-out of 5G infrastructure. As 5G networks become more pervasive, the demand for devices that can efficiently utilize this infrastructure grows. RedCap chips, particularly those operating in the Sub-6 GHz Chipset Market, benefit from the widespread deployment of FR1 frequencies, ensuring broad coverage and relatively straightforward integration. The ongoing evolution of the Telecommunications Equipment Market to support RedCap functionality further accelerates its adoption. The promise of enhanced connectivity density, supporting millions of devices per square kilometer, positions RedCap as a foundational technology for smart cities and massive industrial IoT deployments, offering granular control and real-time data acquisition.
However, several constraints temper this growth. Firstly, the nascent stage of the RedCap ecosystem poses a challenge. While the standard is defined (3GPP Release 17), the full spectrum of interoperable devices, network optimizations, and development tools is still maturing. This can lead to slower adoption rates as enterprises await a more robust and proven ecosystem. Secondly, awareness and education remain critical. Many potential adopters are still evaluating the precise benefits of RedCap over established 4G IoT technologies or the trade-offs against full 5G, leading to a prolonged decision cycle. Lastly, security concerns surrounding the massive deployment of connected devices, including RedCap-enabled ones, present a notable constraint. Ensuring robust security from chip to cloud for millions of devices is a complex undertaking, requiring continuous innovation and standardized protocols to mitigate cyber threats.
Competitive Ecosystem of 5G RedCap Chip Market
The 5G RedCap Chip Market is characterized by a dynamic competitive landscape, with established semiconductor giants and specialized cellular IoT chip vendors vying for market share. The strategies often revolve around comprehensive product portfolios, early integration with network operators, and focused R&D on power efficiency and cost reduction:
- Qualcomm Technologies, Inc.: A dominant force in the broader mobile chipset industry, Qualcomm is leveraging its extensive 5G IP and modem expertise to offer RedCap solutions, aiming to extend its leadership from smartphones to the burgeoning IoT sector with integrated platforms that cover a wide range of use cases.
- MediaTek Inc.: Known for its competitive and high-volume chipsets across various consumer electronics, MediaTek is positioning itself as a strong contender in the RedCap space, focusing on cost-effective, power-efficient designs to capture significant share in wearables, smart home, and industrial IoT applications.
- Samsung Electronics Co., Ltd.: As a global technology conglomerate, Samsung is active in the development of 5G RedCap solutions, leveraging its semiconductor manufacturing capabilities and strong position in consumer electronics and network infrastructure to offer integrated device-to-network propositions.
- UNISOC Communications Inc.: A leading Chinese semiconductor design company, UNISOC is expanding its 5G portfolio to include RedCap chipsets, targeting the massive IoT market with cost-competitive solutions primarily within the Asia Pacific region and emerging markets.
- Sequans Communications S.A.: Specializing in LTE-M/NB-IoT, Sequans is naturally extending its expertise to 5G RedCap, focusing on providing highly optimized and ultra-low-power solutions for critical IoT applications, emphasizing their long-standing experience in narrowband cellular technologies.
- ASR Microelectronics Co., Ltd.: An emerging Chinese fabless semiconductor company, ASR Microelectronics is a rising player in the cellular IoT segment, developing RedCap chipsets that aim to offer a balance of performance and cost-efficiency for a wide range of IoT devices, particularly in their home market.
- Huawei Technologies Co., Ltd.: Despite geopolitical challenges, Huawei remains a significant innovator in 5G technology, including RedCap, focusing on end-to-end solutions that span network equipment, modules, and chipsets, particularly in markets where its network infrastructure is prevalent.
- Intel Corporation: While primarily known for its PC and data center processors, Intel maintains a presence in networking and connectivity, potentially contributing to the RedCap ecosystem through partnerships or specialized modules, leveraging its expertise in industrial and enterprise IoT solutions.
- Nokia Corporation: Primarily a telecommunications equipment vendor, Nokia's involvement in the 5G RedCap Chip Market is more indirect, focusing on enabling RedCap functionality within its network infrastructure to support the proliferation of RedCap-enabled devices.
- Telefonaktiebolaget LM Ericsson: Similar to Nokia, Ericsson is a major provider of telecommunications infrastructure, actively ensuring its 5G network solutions are fully compatible with RedCap devices, thereby supporting the ecosystem's expansion rather than directly manufacturing chips.
Recent Developments & Milestones in 5G RedCap Chip Market
The 5G RedCap Chip Market has seen a flurry of foundational and developmental milestones since the standardization of the technology, reflecting its strategic importance for the next phase of 5G deployment:
- July 2022: The 3GPP completed Release 17, formally standardizing 5G NR-Light, now commonly known as RedCap (Reduced Capability). This crucial milestone established the technical specifications for a new class of 5G devices optimized for cost, complexity, and power consumption, laying the groundwork for chip development.
- October 2023: Several leading chipset manufacturers, including Qualcomm and MediaTek, announced the successful completion of initial interoperability tests (IOTs) for their RedCap modules with major 5G infrastructure providers. These tests demonstrated the readiness of early RedCap chip designs for commercial deployment.
- February 2024: The first wave of commercial 5G RedCap chipsets began sampling to device manufacturers, with a focus on target applications such as wearables, industrial sensors, and smart metering. These early samples were critical for product development and integration by original equipment manufacturers (OEMs).
- June 2024: Multiple network operators in key regions, including China and parts of Europe, initiated pilot programs and trials for 5G RedCap network support. These trials aimed to validate network performance, device compatibility, and the overall end-to-end ecosystem readiness for broader commercial launches.
- September 2024: The first set of enterprise-grade 5G RedCap modules, integrated into industrial gateways and routers, were showcased at major industry events. These demonstrated the practical application of RedCap in real-world industrial IoT scenarios, highlighting its potential for asset tracking and smart factory solutions.
- January 2025: Regulatory bodies in various countries started to update spectrum allocation and device certification processes to specifically accommodate 5G RedCap devices, streamlining the path for market entry and ensuring compliance with regional communication standards.
Regional Market Breakdown for 5G RedCap Chip Market
The global 5G RedCap Chip Market exhibits distinct regional dynamics, influenced by varying rates of 5G infrastructure deployment, industrial IoT adoption, and government initiatives. While specific regional market values for 2025 are not provided, an analysis of macro trends allows for a comparative breakdown, reflecting growth drivers and market maturity.
Asia Pacific is anticipated to be the largest and fastest-growing region in the 5G RedCap Chip Market, potentially accounting for an estimated 40-45% revenue share and poised for a CAGR exceeding 40%. This dominance is driven by aggressive 5G network rollouts, strong government support for digital transformation (e.g., smart cities in China, industrial IoT in South Korea and Japan), and a vast manufacturing base for consumer electronics and industrial equipment. Countries like China, India, and South Korea are at the forefront of RedCap adoption, given their robust Telecommunications Equipment Market and high volume of IoT Devices Market production and consumption.
North America is expected to hold a significant revenue share, estimated at 25-30%, with a strong CAGR of approximately 33%. The region benefits from early adoption of advanced technologies, substantial enterprise investment in IoT solutions across healthcare, automotive, and logistics, and a mature ecosystem of technology developers and service providers. The demand for RedCap chips in the Automotive Electronics Market, particularly for telematics and V2X applications, is a key driver in the United States and Canada. The region also leads in developing the mmWave Chip Market, though RedCap focuses predominantly on Sub-6 GHz initially.
Europe represents a substantial market, likely holding around 20% of the global revenue share, with a projected CAGR of about 30%. Growth is propelled by strong industrial IoT initiatives (Industry 4.0), particularly in Germany and the Nordics, coupled with a focus on smart energy and utility applications where RedCap's power efficiency is highly valued. The region's emphasis on data privacy and security also drives demand for secure and robust RedCap solutions. The Sub-6 GHz Chipset Market is particularly strong here, aligning with RedCap's primary frequency band.
Middle East & Africa and South America are emerging markets, currently holding smaller revenue shares but exhibiting high growth potential. These regions are experiencing rapid 5G network expansion and increasing investment in smart infrastructure projects, creating new opportunities for RedCap deployment in sectors like smart metering, logistics, and public safety. While starting from a lower base, the relative immaturity of existing IoT infrastructure allows for direct leapfrogging to 5G RedCap solutions, potentially leading to impressive percentage growth rates in the long term, albeit with smaller absolute values.
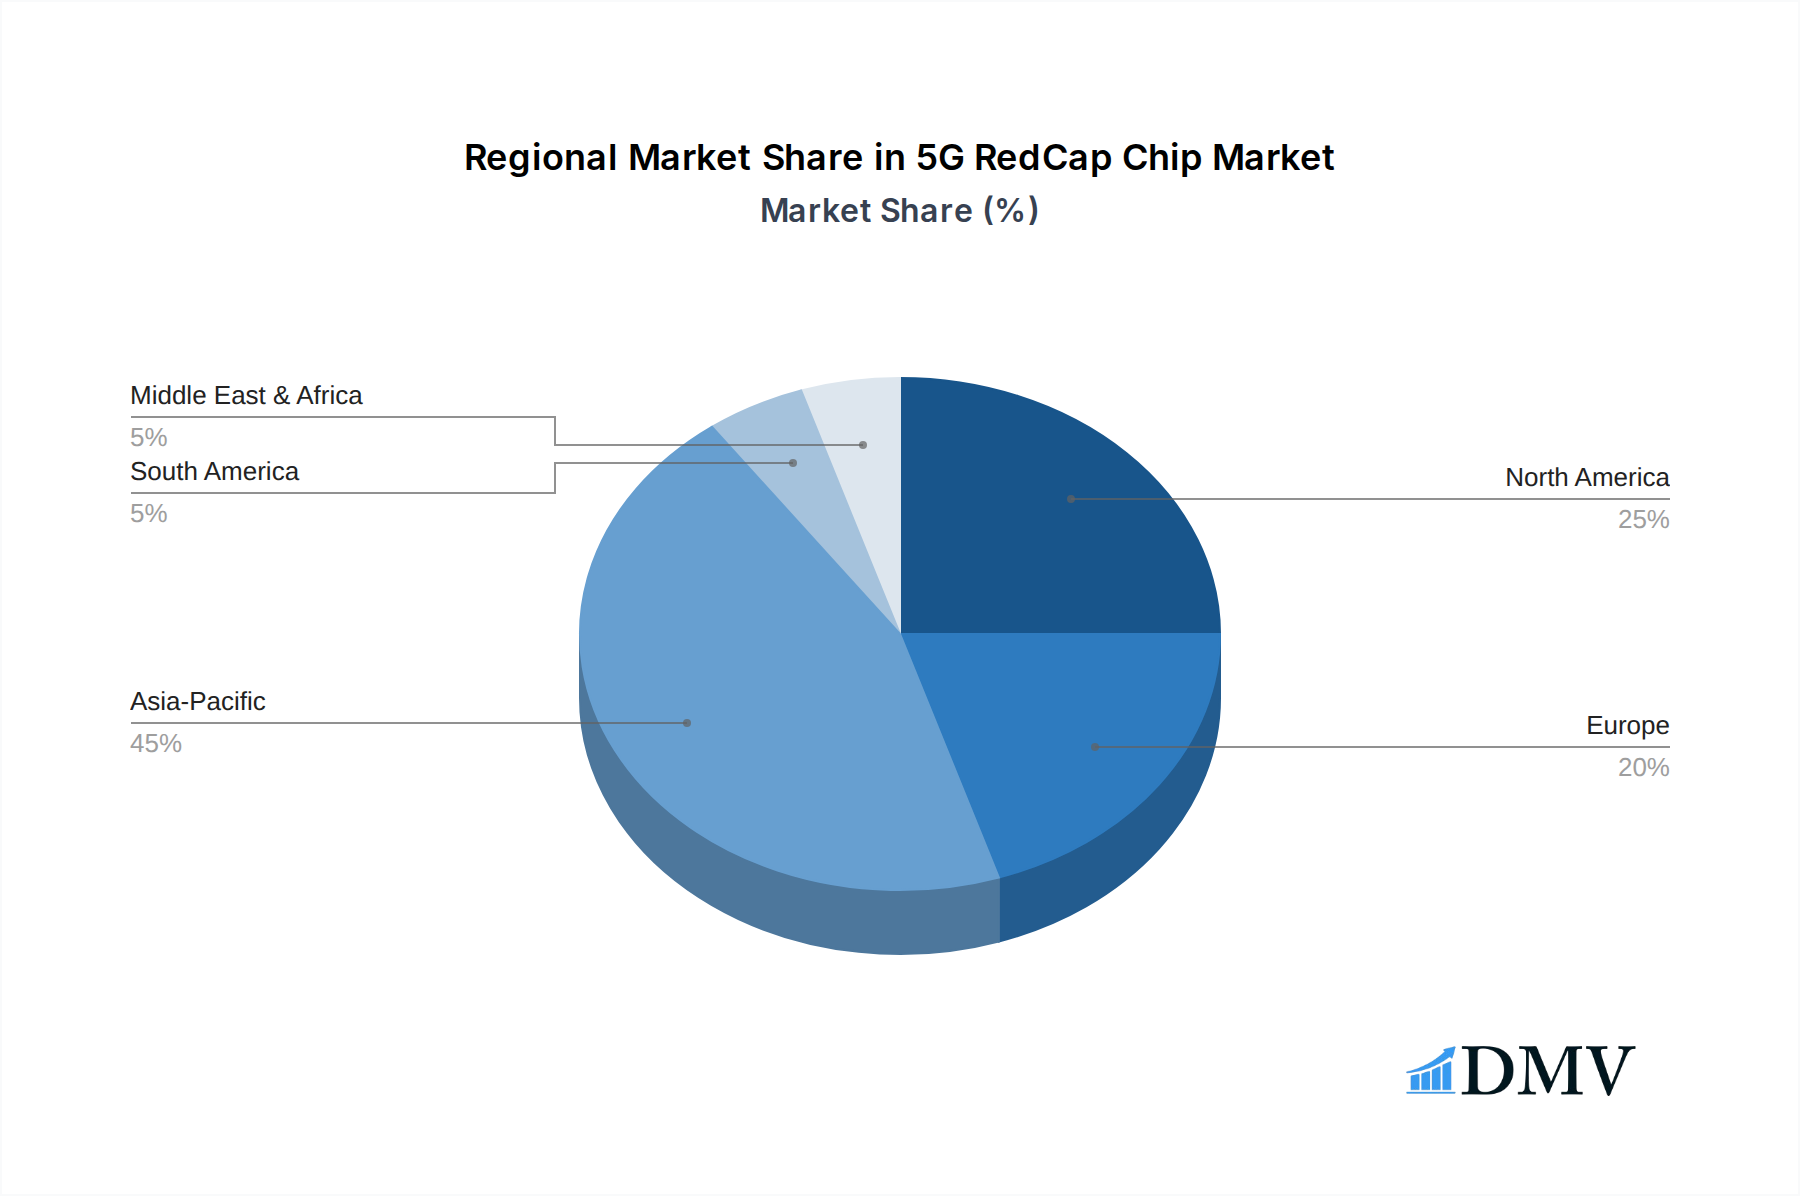
5G RedCap Chip Regional Market Share
Pricing Dynamics & Margin Pressure in 5G RedCap Chip Market
The pricing dynamics within the 5G RedCap Chip Market are a complex interplay of technological innovation, manufacturing scale, and competitive intensity. Initially, average selling prices (ASPs) for early RedCap chipsets are expected to be higher, reflecting the R&D investment and early adopter premium. However, a consistent downward pressure on ASPs is anticipated as the market matures and volume production scales up. The very essence of RedCap, which is to offer a cost-optimized 5G solution for IoT, dictates that its price point must be significantly lower than full 5G eMBB chipsets to achieve mass adoption. This cost-efficiency is crucial for widespread integration into the diverse IoT Devices Market.
Margin structures across the value chain will vary. Chipset manufacturers initially enjoy healthier margins due to intellectual property and design complexity. However, as more players enter the Semiconductor Chip Market with RedCap offerings, competitive intensity will increase, leading to margin compression. This pressure will be particularly acute in the Single Mode Chip Market, which is simpler and easier to commoditize compared to more complex Dual Mode Chip Market solutions that might offer more versatility. Fabricators (fabs) and assembly, test, and packaging (ATP) providers operate on generally thinner margins, heavily dependent on capacity utilization and process efficiency.
Key cost levers for manufacturers include semiconductor wafer costs, packaging materials, and R&D expenditure. The reliance on advanced fabrication nodes (e.g., 7nm, 5nm) can be a significant cost driver, though RedCap's reduced complexity may allow for more cost-effective older nodes in some implementations. Strategic partnerships with foundries and vertical integration can help control manufacturing costs. Furthermore, the ability to integrate multiple functionalities onto a single chip (System-on-Chip, SoC) can reduce bill-of-materials (BOM) for device makers, indirectly influencing demand and pricing. Geopolitical factors affecting the Sub-6 GHz Chipset Market and mmWave Chip Market component supply chains can also introduce volatility, impacting input costs and, subsequently, chip pricing and overall margins.
Export, Trade Flow & Tariff Impact on 5G RedCap Chip Market
The 5G RedCap Chip Market, as an integral component of the global Semiconductor Chip Market, is highly susceptible to international export, trade flow dynamics, and tariff impacts. Major trade corridors for these specialized chipsets primarily run from Asia-Pacific, particularly from manufacturing hubs like Taiwan (for foundries), South Korea, and China (for design and assembly), towards key importing regions such as North America, Europe, and other parts of Asia-Pacific where end-device manufacturing and deployment are robust. Leading exporting nations are typically those with advanced semiconductor ecosystems, while importing nations are often those with large consumer electronics industries, significant industrial IoT deployments, or strong Automotive Electronics Market production.
Recent trade policies and geopolitical tensions, particularly between the United States and China, have had a measurable impact on cross-border volume and supply chain strategies. Tariffs imposed on goods originating from specific countries have directly increased the cost of importing certain chipsets, forcing device manufacturers to re-evaluate their sourcing strategies. This has led to efforts to diversify supply chains, regionalize manufacturing, and explore alternative vendors, impacting the efficiency and cost-effectiveness of the global RedCap chip supply. Non-tariff barriers, such as export controls on advanced technology, security certifications, and compliance with varying regional communication standards (e.g., those governing the Sub-6 GHz Chipset Market vs. mmWave Chip Market), also significantly influence trade flows by adding layers of complexity and cost to cross-border transactions.
For instance, an increase in tariffs on RedCap chips or related components originating from a major producing nation could directly inflate the final product cost for IoT Devices Market in the importing region, potentially dampening demand or accelerating the shift to local manufacturing where feasible. Furthermore, government subsidies and incentives for domestic chip production in regions like the U.S. and Europe aim to reduce reliance on external supply chains, fostering new regional trade flows and potentially altering existing corridors over the long term. These macro-level trade dynamics are critical for manufacturers operating in the 5G RedCap Chip Market, requiring agile supply chain management and proactive engagement with trade policy developments to mitigate risks and capitalize on emerging opportunities.
5G RedCap Chip Segmentation
-
1. Product Type
- 1.1. Single Mode Chip
- 1.2. Dual Mode Chip
-
2. Frequency Band
- 2.1. Sub-6 GHz (FR1)
- 2.2. mmWave (FR2)
-
3. Application
- 3.1. Routers & Gateways
- 3.2. Cameras
- 3.3. Customer Premises Equipment (CPE)
- 3.4. Telematics & Automotive
- 3.5. Wearables
- 3.6. Smart Metering
- 3.7. Others
-
4. Distribution Channel
- 4.1. Direct Sales
- 4.2. Distributors and Wholesalers
- 4.3. Online
-
5. End User Industry
- 5.1. Consumer Electronics
- 5.2. Telecommunications
- 5.3. Manufacturing
- 5.4. Automotive & Transportation
- 5.5. Healthcare
- 5.6. Energy & Utilities
- 5.7. Retail
- 5.8. Others
5G RedCap Chip Segmentation By Geography
-
1. North America
- 1.1. United States
- 1.2. Canada
- 1.3. Mexico
-
2. South America
- 2.1. Brazil
- 2.2. Argentina
- 2.3. Rest of South America
-
3. Europe
- 3.1. United Kingdom
- 3.2. Germany
- 3.3. France
- 3.4. Italy
- 3.5. Spain
- 3.6. Russia
- 3.7. Benelux
- 3.8. Nordics
- 3.9. Rest of Europe
-
4. Middle East & Africa
- 4.1. Turkey
- 4.2. Israel
- 4.3. GCC
- 4.4. North Africa
- 4.5. South Africa
- 4.6. Rest of Middle East & Africa
-
5. Asia Pacific
- 5.1. China
- 5.2. India
- 5.3. Japan
- 5.4. South Korea
- 5.5. ASEAN
- 5.6. Oceania
- 5.7. Rest of Asia Pacific
5G RedCap Chip Regional Market Share
Geographic Coverage of 5G RedCap Chip
5G RedCap Chip REPORT HIGHLIGHTS
| Aspects | Details |
|---|---|
| Study Period | 2020-2034 |
| Base Year | 2025 |
| Estimated Year | 2026 |
| Forecast Period | 2026-2034 |
| Historical Period | 2020-2025 |
| Growth Rate | CAGR of 35% from 2020-2034 |
| Segmentation |
|
Table of Contents
- 1. Introduction
- 1.1. Research Scope
- 1.2. Market Segmentation
- 1.3. Research Objective
- 1.4. Definitions and Assumptions
- 2. Executive Summary
- 2.1. Market Snapshot
- 3. Market Dynamics
- 3.1. Market Drivers
- 3.2. Market Restrains
- 3.3. Market Trends
- 3.4. Market Opportunities
- 4. Market Factor Analysis
- 4.1. Porters Five Forces
- 4.1.1. Bargaining Power of Suppliers
- 4.1.2. Bargaining Power of Buyers
- 4.1.3. Threat of New Entrants
- 4.1.4. Threat of Substitutes
- 4.1.5. Competitive Rivalry
- 4.2. PESTEL analysis
- 4.3. BCG Analysis
- 4.3.1. Stars (High Growth, High Market Share)
- 4.3.2. Cash Cows (Low Growth, High Market Share)
- 4.3.3. Question Mark (High Growth, Low Market Share)
- 4.3.4. Dogs (Low Growth, Low Market Share)
- 4.4. Ansoff Matrix Analysis
- 4.5. Supply Chain Analysis
- 4.6. Regulatory Landscape
- 4.7. Current Market Potential and Opportunity Assessment (TAM–SAM–SOM Framework)
- 4.8. DMV Analyst Note
- 4.1. Porters Five Forces
- 5. Market Analysis, Insights and Forecast 2021-2033
- 5.1. Market Analysis, Insights and Forecast - by Product Type
- 5.1.1. Single Mode Chip
- 5.1.2. Dual Mode Chip
- 5.2. Market Analysis, Insights and Forecast - by Frequency Band
- 5.2.1. Sub-6 GHz (FR1)
- 5.2.2. mmWave (FR2)
- 5.3. Market Analysis, Insights and Forecast - by Application
- 5.3.1. Routers & Gateways
- 5.3.2. Cameras
- 5.3.3. Customer Premises Equipment (CPE)
- 5.3.4. Telematics & Automotive
- 5.3.5. Wearables
- 5.3.6. Smart Metering
- 5.3.7. Others
- 5.4. Market Analysis, Insights and Forecast - by Distribution Channel
- 5.4.1. Direct Sales
- 5.4.2. Distributors and Wholesalers
- 5.4.3. Online
- 5.5. Market Analysis, Insights and Forecast - by End User Industry
- 5.5.1. Consumer Electronics
- 5.5.2. Telecommunications
- 5.5.3. Manufacturing
- 5.5.4. Automotive & Transportation
- 5.5.5. Healthcare
- 5.5.6. Energy & Utilities
- 5.5.7. Retail
- 5.5.8. Others
- 5.6. Market Analysis, Insights and Forecast - by Region
- 5.6.1. North America
- 5.6.2. South America
- 5.6.3. Europe
- 5.6.4. Middle East & Africa
- 5.6.5. Asia Pacific
- 5.1. Market Analysis, Insights and Forecast - by Product Type
- 6. Global 5G RedCap Chip Analysis, Insights and Forecast, 2021-2033
- 6.1. Market Analysis, Insights and Forecast - by Product Type
- 6.1.1. Single Mode Chip
- 6.1.2. Dual Mode Chip
- 6.2. Market Analysis, Insights and Forecast - by Frequency Band
- 6.2.1. Sub-6 GHz (FR1)
- 6.2.2. mmWave (FR2)
- 6.3. Market Analysis, Insights and Forecast - by Application
- 6.3.1. Routers & Gateways
- 6.3.2. Cameras
- 6.3.3. Customer Premises Equipment (CPE)
- 6.3.4. Telematics & Automotive
- 6.3.5. Wearables
- 6.3.6. Smart Metering
- 6.3.7. Others
- 6.4. Market Analysis, Insights and Forecast - by Distribution Channel
- 6.4.1. Direct Sales
- 6.4.2. Distributors and Wholesalers
- 6.4.3. Online
- 6.5. Market Analysis, Insights and Forecast - by End User Industry
- 6.5.1. Consumer Electronics
- 6.5.2. Telecommunications
- 6.5.3. Manufacturing
- 6.5.4. Automotive & Transportation
- 6.5.5. Healthcare
- 6.5.6. Energy & Utilities
- 6.5.7. Retail
- 6.5.8. Others
- 6.1. Market Analysis, Insights and Forecast - by Product Type
- 7. North America 5G RedCap Chip Analysis, Insights and Forecast, 2020-2032
- 7.1. Market Analysis, Insights and Forecast - by Product Type
- 7.1.1. Single Mode Chip
- 7.1.2. Dual Mode Chip
- 7.2. Market Analysis, Insights and Forecast - by Frequency Band
- 7.2.1. Sub-6 GHz (FR1)
- 7.2.2. mmWave (FR2)
- 7.3. Market Analysis, Insights and Forecast - by Application
- 7.3.1. Routers & Gateways
- 7.3.2. Cameras
- 7.3.3. Customer Premises Equipment (CPE)
- 7.3.4. Telematics & Automotive
- 7.3.5. Wearables
- 7.3.6. Smart Metering
- 7.3.7. Others
- 7.4. Market Analysis, Insights and Forecast - by Distribution Channel
- 7.4.1. Direct Sales
- 7.4.2. Distributors and Wholesalers
- 7.4.3. Online
- 7.5. Market Analysis, Insights and Forecast - by End User Industry
- 7.5.1. Consumer Electronics
- 7.5.2. Telecommunications
- 7.5.3. Manufacturing
- 7.5.4. Automotive & Transportation
- 7.5.5. Healthcare
- 7.5.6. Energy & Utilities
- 7.5.7. Retail
- 7.5.8. Others
- 7.1. Market Analysis, Insights and Forecast - by Product Type
- 8. South America 5G RedCap Chip Analysis, Insights and Forecast, 2020-2032
- 8.1. Market Analysis, Insights and Forecast - by Product Type
- 8.1.1. Single Mode Chip
- 8.1.2. Dual Mode Chip
- 8.2. Market Analysis, Insights and Forecast - by Frequency Band
- 8.2.1. Sub-6 GHz (FR1)
- 8.2.2. mmWave (FR2)
- 8.3. Market Analysis, Insights and Forecast - by Application
- 8.3.1. Routers & Gateways
- 8.3.2. Cameras
- 8.3.3. Customer Premises Equipment (CPE)
- 8.3.4. Telematics & Automotive
- 8.3.5. Wearables
- 8.3.6. Smart Metering
- 8.3.7. Others
- 8.4. Market Analysis, Insights and Forecast - by Distribution Channel
- 8.4.1. Direct Sales
- 8.4.2. Distributors and Wholesalers
- 8.4.3. Online
- 8.5. Market Analysis, Insights and Forecast - by End User Industry
- 8.5.1. Consumer Electronics
- 8.5.2. Telecommunications
- 8.5.3. Manufacturing
- 8.5.4. Automotive & Transportation
- 8.5.5. Healthcare
- 8.5.6. Energy & Utilities
- 8.5.7. Retail
- 8.5.8. Others
- 8.1. Market Analysis, Insights and Forecast - by Product Type
- 9. Europe 5G RedCap Chip Analysis, Insights and Forecast, 2020-2032
- 9.1. Market Analysis, Insights and Forecast - by Product Type
- 9.1.1. Single Mode Chip
- 9.1.2. Dual Mode Chip
- 9.2. Market Analysis, Insights and Forecast - by Frequency Band
- 9.2.1. Sub-6 GHz (FR1)
- 9.2.2. mmWave (FR2)
- 9.3. Market Analysis, Insights and Forecast - by Application
- 9.3.1. Routers & Gateways
- 9.3.2. Cameras
- 9.3.3. Customer Premises Equipment (CPE)
- 9.3.4. Telematics & Automotive
- 9.3.5. Wearables
- 9.3.6. Smart Metering
- 9.3.7. Others
- 9.4. Market Analysis, Insights and Forecast - by Distribution Channel
- 9.4.1. Direct Sales
- 9.4.2. Distributors and Wholesalers
- 9.4.3. Online
- 9.5. Market Analysis, Insights and Forecast - by End User Industry
- 9.5.1. Consumer Electronics
- 9.5.2. Telecommunications
- 9.5.3. Manufacturing
- 9.5.4. Automotive & Transportation
- 9.5.5. Healthcare
- 9.5.6. Energy & Utilities
- 9.5.7. Retail
- 9.5.8. Others
- 9.1. Market Analysis, Insights and Forecast - by Product Type
- 10. Middle East & Africa 5G RedCap Chip Analysis, Insights and Forecast, 2020-2032
- 10.1. Market Analysis, Insights and Forecast - by Product Type
- 10.1.1. Single Mode Chip
- 10.1.2. Dual Mode Chip
- 10.2. Market Analysis, Insights and Forecast - by Frequency Band
- 10.2.1. Sub-6 GHz (FR1)
- 10.2.2. mmWave (FR2)
- 10.3. Market Analysis, Insights and Forecast - by Application
- 10.3.1. Routers & Gateways
- 10.3.2. Cameras
- 10.3.3. Customer Premises Equipment (CPE)
- 10.3.4. Telematics & Automotive
- 10.3.5. Wearables
- 10.3.6. Smart Metering
- 10.3.7. Others
- 10.4. Market Analysis, Insights and Forecast - by Distribution Channel
- 10.4.1. Direct Sales
- 10.4.2. Distributors and Wholesalers
- 10.4.3. Online
- 10.5. Market Analysis, Insights and Forecast - by End User Industry
- 10.5.1. Consumer Electronics
- 10.5.2. Telecommunications
- 10.5.3. Manufacturing
- 10.5.4. Automotive & Transportation
- 10.5.5. Healthcare
- 10.5.6. Energy & Utilities
- 10.5.7. Retail
- 10.5.8. Others
- 10.1. Market Analysis, Insights and Forecast - by Product Type
- 11. Asia Pacific 5G RedCap Chip Analysis, Insights and Forecast, 2020-2032
- 11.1. Market Analysis, Insights and Forecast - by Product Type
- 11.1.1. Single Mode Chip
- 11.1.2. Dual Mode Chip
- 11.2. Market Analysis, Insights and Forecast - by Frequency Band
- 11.2.1. Sub-6 GHz (FR1)
- 11.2.2. mmWave (FR2)
- 11.3. Market Analysis, Insights and Forecast - by Application
- 11.3.1. Routers & Gateways
- 11.3.2. Cameras
- 11.3.3. Customer Premises Equipment (CPE)
- 11.3.4. Telematics & Automotive
- 11.3.5. Wearables
- 11.3.6. Smart Metering
- 11.3.7. Others
- 11.4. Market Analysis, Insights and Forecast - by Distribution Channel
- 11.4.1. Direct Sales
- 11.4.2. Distributors and Wholesalers
- 11.4.3. Online
- 11.5. Market Analysis, Insights and Forecast - by End User Industry
- 11.5.1. Consumer Electronics
- 11.5.2. Telecommunications
- 11.5.3. Manufacturing
- 11.5.4. Automotive & Transportation
- 11.5.5. Healthcare
- 11.5.6. Energy & Utilities
- 11.5.7. Retail
- 11.5.8. Others
- 11.1. Market Analysis, Insights and Forecast - by Product Type
- 12. Competitive Analysis
- 12.1. Company Profiles
- 12.1.1 Qualcomm Technologies Inc.
- 12.1.1.1. Company Overview
- 12.1.1.2. Products
- 12.1.1.3. Company Financials
- 12.1.1.4. SWOT Analysis
- 12.1.2 MediaTek Inc.
- 12.1.2.1. Company Overview
- 12.1.2.2. Products
- 12.1.2.3. Company Financials
- 12.1.2.4. SWOT Analysis
- 12.1.3 Samsung Electronics Co. Ltd.
- 12.1.3.1. Company Overview
- 12.1.3.2. Products
- 12.1.3.3. Company Financials
- 12.1.3.4. SWOT Analysis
- 12.1.4 UNISOC Communications Inc.
- 12.1.4.1. Company Overview
- 12.1.4.2. Products
- 12.1.4.3. Company Financials
- 12.1.4.4. SWOT Analysis
- 12.1.5 Sequans Communications S.A.
- 12.1.5.1. Company Overview
- 12.1.5.2. Products
- 12.1.5.3. Company Financials
- 12.1.5.4. SWOT Analysis
- 12.1.6 ASR Microelectronics Co. Ltd.
- 12.1.6.1. Company Overview
- 12.1.6.2. Products
- 12.1.6.3. Company Financials
- 12.1.6.4. SWOT Analysis
- 12.1.7 Huawei Technologies Co. Ltd.
- 12.1.7.1. Company Overview
- 12.1.7.2. Products
- 12.1.7.3. Company Financials
- 12.1.7.4. SWOT Analysis
- 12.1.8 Intel Corporation
- 12.1.8.1. Company Overview
- 12.1.8.2. Products
- 12.1.8.3. Company Financials
- 12.1.8.4. SWOT Analysis
- 12.1.9 Nokia Corporation
- 12.1.9.1. Company Overview
- 12.1.9.2. Products
- 12.1.9.3. Company Financials
- 12.1.9.4. SWOT Analysis
- 12.1.10 Telefonaktiebolaget LM Ericsson
- 12.1.10.1. Company Overview
- 12.1.10.2. Products
- 12.1.10.3. Company Financials
- 12.1.10.4. SWOT Analysis
- 12.1.11 Others
- 12.1.11.1. Company Overview
- 12.1.11.2. Products
- 12.1.11.3. Company Financials
- 12.1.11.4. SWOT Analysis
- 12.1.1 Qualcomm Technologies Inc.
- 12.2. Market Entropy
- 12.2.1 Company's Key Areas Served
- 12.2.2 Recent Developments
- 12.3. Company Market Share Analysis 2025
- 12.3.1 Top 5 Companies Market Share Analysis
- 12.3.2 Top 3 Companies Market Share Analysis
- 12.4. List of Potential Customers
- 13. Research Methodology
List of Figures
- Figure 1: Global 5G RedCap Chip Revenue Breakdown (million, %) by Region 2025 & 2033
- Figure 2: North America 5G RedCap Chip Revenue (million), by Product Type 2025 & 2033
- Figure 3: North America 5G RedCap Chip Revenue Share (%), by Product Type 2025 & 2033
- Figure 4: North America 5G RedCap Chip Revenue (million), by Frequency Band 2025 & 2033
- Figure 5: North America 5G RedCap Chip Revenue Share (%), by Frequency Band 2025 & 2033
- Figure 6: North America 5G RedCap Chip Revenue (million), by Application 2025 & 2033
- Figure 7: North America 5G RedCap Chip Revenue Share (%), by Application 2025 & 2033
- Figure 8: North America 5G RedCap Chip Revenue (million), by Distribution Channel 2025 & 2033
- Figure 9: North America 5G RedCap Chip Revenue Share (%), by Distribution Channel 2025 & 2033
- Figure 10: North America 5G RedCap Chip Revenue (million), by End User Industry 2025 & 2033
- Figure 11: North America 5G RedCap Chip Revenue Share (%), by End User Industry 2025 & 2033
- Figure 12: North America 5G RedCap Chip Revenue (million), by Country 2025 & 2033
- Figure 13: North America 5G RedCap Chip Revenue Share (%), by Country 2025 & 2033
- Figure 14: South America 5G RedCap Chip Revenue (million), by Product Type 2025 & 2033
- Figure 15: South America 5G RedCap Chip Revenue Share (%), by Product Type 2025 & 2033
- Figure 16: South America 5G RedCap Chip Revenue (million), by Frequency Band 2025 & 2033
- Figure 17: South America 5G RedCap Chip Revenue Share (%), by Frequency Band 2025 & 2033
- Figure 18: South America 5G RedCap Chip Revenue (million), by Application 2025 & 2033
- Figure 19: South America 5G RedCap Chip Revenue Share (%), by Application 2025 & 2033
- Figure 20: South America 5G RedCap Chip Revenue (million), by Distribution Channel 2025 & 2033
- Figure 21: South America 5G RedCap Chip Revenue Share (%), by Distribution Channel 2025 & 2033
- Figure 22: South America 5G RedCap Chip Revenue (million), by End User Industry 2025 & 2033
- Figure 23: South America 5G RedCap Chip Revenue Share (%), by End User Industry 2025 & 2033
- Figure 24: South America 5G RedCap Chip Revenue (million), by Country 2025 & 2033
- Figure 25: South America 5G RedCap Chip Revenue Share (%), by Country 2025 & 2033
- Figure 26: Europe 5G RedCap Chip Revenue (million), by Product Type 2025 & 2033
- Figure 27: Europe 5G RedCap Chip Revenue Share (%), by Product Type 2025 & 2033
- Figure 28: Europe 5G RedCap Chip Revenue (million), by Frequency Band 2025 & 2033
- Figure 29: Europe 5G RedCap Chip Revenue Share (%), by Frequency Band 2025 & 2033
- Figure 30: Europe 5G RedCap Chip Revenue (million), by Application 2025 & 2033
- Figure 31: Europe 5G RedCap Chip Revenue Share (%), by Application 2025 & 2033
- Figure 32: Europe 5G RedCap Chip Revenue (million), by Distribution Channel 2025 & 2033
- Figure 33: Europe 5G RedCap Chip Revenue Share (%), by Distribution Channel 2025 & 2033
- Figure 34: Europe 5G RedCap Chip Revenue (million), by End User Industry 2025 & 2033
- Figure 35: Europe 5G RedCap Chip Revenue Share (%), by End User Industry 2025 & 2033
- Figure 36: Europe 5G RedCap Chip Revenue (million), by Country 2025 & 2033
- Figure 37: Europe 5G RedCap Chip Revenue Share (%), by Country 2025 & 2033
- Figure 38: Middle East & Africa 5G RedCap Chip Revenue (million), by Product Type 2025 & 2033
- Figure 39: Middle East & Africa 5G RedCap Chip Revenue Share (%), by Product Type 2025 & 2033
- Figure 40: Middle East & Africa 5G RedCap Chip Revenue (million), by Frequency Band 2025 & 2033
- Figure 41: Middle East & Africa 5G RedCap Chip Revenue Share (%), by Frequency Band 2025 & 2033
- Figure 42: Middle East & Africa 5G RedCap Chip Revenue (million), by Application 2025 & 2033
- Figure 43: Middle East & Africa 5G RedCap Chip Revenue Share (%), by Application 2025 & 2033
- Figure 44: Middle East & Africa 5G RedCap Chip Revenue (million), by Distribution Channel 2025 & 2033
- Figure 45: Middle East & Africa 5G RedCap Chip Revenue Share (%), by Distribution Channel 2025 & 2033
- Figure 46: Middle East & Africa 5G RedCap Chip Revenue (million), by End User Industry 2025 & 2033
- Figure 47: Middle East & Africa 5G RedCap Chip Revenue Share (%), by End User Industry 2025 & 2033
- Figure 48: Middle East & Africa 5G RedCap Chip Revenue (million), by Country 2025 & 2033
- Figure 49: Middle East & Africa 5G RedCap Chip Revenue Share (%), by Country 2025 & 2033
- Figure 50: Asia Pacific 5G RedCap Chip Revenue (million), by Product Type 2025 & 2033
- Figure 51: Asia Pacific 5G RedCap Chip Revenue Share (%), by Product Type 2025 & 2033
- Figure 52: Asia Pacific 5G RedCap Chip Revenue (million), by Frequency Band 2025 & 2033
- Figure 53: Asia Pacific 5G RedCap Chip Revenue Share (%), by Frequency Band 2025 & 2033
- Figure 54: Asia Pacific 5G RedCap Chip Revenue (million), by Application 2025 & 2033
- Figure 55: Asia Pacific 5G RedCap Chip Revenue Share (%), by Application 2025 & 2033
- Figure 56: Asia Pacific 5G RedCap Chip Revenue (million), by Distribution Channel 2025 & 2033
- Figure 57: Asia Pacific 5G RedCap Chip Revenue Share (%), by Distribution Channel 2025 & 2033
- Figure 58: Asia Pacific 5G RedCap Chip Revenue (million), by End User Industry 2025 & 2033
- Figure 59: Asia Pacific 5G RedCap Chip Revenue Share (%), by End User Industry 2025 & 2033
- Figure 60: Asia Pacific 5G RedCap Chip Revenue (million), by Country 2025 & 2033
- Figure 61: Asia Pacific 5G RedCap Chip Revenue Share (%), by Country 2025 & 2033
List of Tables
- Table 1: Global 5G RedCap Chip Revenue million Forecast, by Product Type 2020 & 2033
- Table 2: Global 5G RedCap Chip Revenue million Forecast, by Frequency Band 2020 & 2033
- Table 3: Global 5G RedCap Chip Revenue million Forecast, by Application 2020 & 2033
- Table 4: Global 5G RedCap Chip Revenue million Forecast, by Distribution Channel 2020 & 2033
- Table 5: Global 5G RedCap Chip Revenue million Forecast, by End User Industry 2020 & 2033
- Table 6: Global 5G RedCap Chip Revenue million Forecast, by Region 2020 & 2033
- Table 7: Global 5G RedCap Chip Revenue million Forecast, by Product Type 2020 & 2033
- Table 8: Global 5G RedCap Chip Revenue million Forecast, by Frequency Band 2020 & 2033
- Table 9: Global 5G RedCap Chip Revenue million Forecast, by Application 2020 & 2033
- Table 10: Global 5G RedCap Chip Revenue million Forecast, by Distribution Channel 2020 & 2033
- Table 11: Global 5G RedCap Chip Revenue million Forecast, by End User Industry 2020 & 2033
- Table 12: Global 5G RedCap Chip Revenue million Forecast, by Country 2020 & 2033
- Table 13: United States 5G RedCap Chip Revenue (million) Forecast, by Application 2020 & 2033
- Table 14: Canada 5G RedCap Chip Revenue (million) Forecast, by Application 2020 & 2033
- Table 15: Mexico 5G RedCap Chip Revenue (million) Forecast, by Application 2020 & 2033
- Table 16: Global 5G RedCap Chip Revenue million Forecast, by Product Type 2020 & 2033
- Table 17: Global 5G RedCap Chip Revenue million Forecast, by Frequency Band 2020 & 2033
- Table 18: Global 5G RedCap Chip Revenue million Forecast, by Application 2020 & 2033
- Table 19: Global 5G RedCap Chip Revenue million Forecast, by Distribution Channel 2020 & 2033
- Table 20: Global 5G RedCap Chip Revenue million Forecast, by End User Industry 2020 & 2033
- Table 21: Global 5G RedCap Chip Revenue million Forecast, by Country 2020 & 2033
- Table 22: Brazil 5G RedCap Chip Revenue (million) Forecast, by Application 2020 & 2033
- Table 23: Argentina 5G RedCap Chip Revenue (million) Forecast, by Application 2020 & 2033
- Table 24: Rest of South America 5G RedCap Chip Revenue (million) Forecast, by Application 2020 & 2033
- Table 25: Global 5G RedCap Chip Revenue million Forecast, by Product Type 2020 & 2033
- Table 26: Global 5G RedCap Chip Revenue million Forecast, by Frequency Band 2020 & 2033
- Table 27: Global 5G RedCap Chip Revenue million Forecast, by Application 2020 & 2033
- Table 28: Global 5G RedCap Chip Revenue million Forecast, by Distribution Channel 2020 & 2033
- Table 29: Global 5G RedCap Chip Revenue million Forecast, by End User Industry 2020 & 2033
- Table 30: Global 5G RedCap Chip Revenue million Forecast, by Country 2020 & 2033
- Table 31: United Kingdom 5G RedCap Chip Revenue (million) Forecast, by Application 2020 & 2033
- Table 32: Germany 5G RedCap Chip Revenue (million) Forecast, by Application 2020 & 2033
- Table 33: France 5G RedCap Chip Revenue (million) Forecast, by Application 2020 & 2033
- Table 34: Italy 5G RedCap Chip Revenue (million) Forecast, by Application 2020 & 2033
- Table 35: Spain 5G RedCap Chip Revenue (million) Forecast, by Application 2020 & 2033
- Table 36: Russia 5G RedCap Chip Revenue (million) Forecast, by Application 2020 & 2033
- Table 37: Benelux 5G RedCap Chip Revenue (million) Forecast, by Application 2020 & 2033
- Table 38: Nordics 5G RedCap Chip Revenue (million) Forecast, by Application 2020 & 2033
- Table 39: Rest of Europe 5G RedCap Chip Revenue (million) Forecast, by Application 2020 & 2033
- Table 40: Global 5G RedCap Chip Revenue million Forecast, by Product Type 2020 & 2033
- Table 41: Global 5G RedCap Chip Revenue million Forecast, by Frequency Band 2020 & 2033
- Table 42: Global 5G RedCap Chip Revenue million Forecast, by Application 2020 & 2033
- Table 43: Global 5G RedCap Chip Revenue million Forecast, by Distribution Channel 2020 & 2033
- Table 44: Global 5G RedCap Chip Revenue million Forecast, by End User Industry 2020 & 2033
- Table 45: Global 5G RedCap Chip Revenue million Forecast, by Country 2020 & 2033
- Table 46: Turkey 5G RedCap Chip Revenue (million) Forecast, by Application 2020 & 2033
- Table 47: Israel 5G RedCap Chip Revenue (million) Forecast, by Application 2020 & 2033
- Table 48: GCC 5G RedCap Chip Revenue (million) Forecast, by Application 2020 & 2033
- Table 49: North Africa 5G RedCap Chip Revenue (million) Forecast, by Application 2020 & 2033
- Table 50: South Africa 5G RedCap Chip Revenue (million) Forecast, by Application 2020 & 2033
- Table 51: Rest of Middle East & Africa 5G RedCap Chip Revenue (million) Forecast, by Application 2020 & 2033
- Table 52: Global 5G RedCap Chip Revenue million Forecast, by Product Type 2020 & 2033
- Table 53: Global 5G RedCap Chip Revenue million Forecast, by Frequency Band 2020 & 2033
- Table 54: Global 5G RedCap Chip Revenue million Forecast, by Application 2020 & 2033
- Table 55: Global 5G RedCap Chip Revenue million Forecast, by Distribution Channel 2020 & 2033
- Table 56: Global 5G RedCap Chip Revenue million Forecast, by End User Industry 2020 & 2033
- Table 57: Global 5G RedCap Chip Revenue million Forecast, by Country 2020 & 2033
- Table 58: China 5G RedCap Chip Revenue (million) Forecast, by Application 2020 & 2033
- Table 59: India 5G RedCap Chip Revenue (million) Forecast, by Application 2020 & 2033
- Table 60: Japan 5G RedCap Chip Revenue (million) Forecast, by Application 2020 & 2033
- Table 61: South Korea 5G RedCap Chip Revenue (million) Forecast, by Application 2020 & 2033
- Table 62: ASEAN 5G RedCap Chip Revenue (million) Forecast, by Application 2020 & 2033
- Table 63: Oceania 5G RedCap Chip Revenue (million) Forecast, by Application 2020 & 2033
- Table 64: Rest of Asia Pacific 5G RedCap Chip Revenue (million) Forecast, by Application 2020 & 2033
Frequently Asked Questions
1. What is the projected Compound Annual Growth Rate (CAGR) of the 5G RedCap Chip?
The projected CAGR is approximately 35%.
2. Which companies are prominent players in the 5G RedCap Chip?
Key companies in the market include Qualcomm Technologies, Inc., MediaTek Inc., Samsung Electronics Co., Ltd., UNISOC Communications Inc., Sequans Communications S.A., ASR Microelectronics Co., Ltd., Huawei Technologies Co., Ltd., Intel Corporation, Nokia Corporation, Telefonaktiebolaget LM Ericsson, Others.
3. What are the main segments of the 5G RedCap Chip?
The market segments include Product Type, Frequency Band, Application, Distribution Channel, End User Industry.
4. Can you provide details about the market size?
The market size is estimated to be USD 500 million as of 2022.
5. What are some drivers contributing to market growth?
N/A
6. What are the notable trends driving market growth?
N/A
7. Are there any restraints impacting market growth?
N/A
8. Can you provide examples of recent developments in the market?
N/A
9. What pricing options are available for accessing the report?
Pricing options include single-user, multi-user, and enterprise licenses priced at USD 4900.00, USD 7350.00, and USD 9800.00 respectively.
10. Is the market size provided in terms of value or volume?
The market size is provided in terms of value, measured in million.
11. Are there any specific market keywords associated with the report?
Yes, the market keyword associated with the report is "5G RedCap Chip," which aids in identifying and referencing the specific market segment covered.
12. How do I determine which pricing option suits my needs best?
The pricing options vary based on user requirements and access needs. Individual users may opt for single-user licenses, while businesses requiring broader access may choose multi-user or enterprise licenses for cost-effective access to the report.
13. Are there any additional resources or data provided in the 5G RedCap Chip report?
While the report offers comprehensive insights, it's advisable to review the specific contents or supplementary materials provided to ascertain if additional resources or data are available.
14. How can I stay updated on further developments or reports in the 5G RedCap Chip?
To stay informed about further developments, trends, and reports in the 5G RedCap Chip, consider subscribing to industry newsletters, following relevant companies and organizations, or regularly checking reputable industry news sources and publications.
Methodology
Step 1 - Identification of Relevant Samples Size from Population Database


Step 2 - Approaches for Defining Global Market Size (Value, Volume* & Price*)

Note*: In applicable scenarios
Step 3 - Data Sources
Primary Research
- Web Analytics
- Survey Reports
- Research Institute
- Latest Research Reports
- Opinion Leaders
Secondary Research
- Annual Reports
- White Paper
- Latest Press Release
- Industry Association
- Paid Database
- Investor Presentations

Step 4 - Data Triangulation
Involves using different sources of information in order to increase the validity of a study
These sources are likely to be stakeholders in a program - participants, other researchers, program staff, other community members, and so on.
Then we put all data in single framework & apply various statistical tools to find out the dynamic on the market.
During the analysis stage, feedback from the stakeholder groups would be compared to determine areas of agreement as well as areas of divergence