

Key Insights
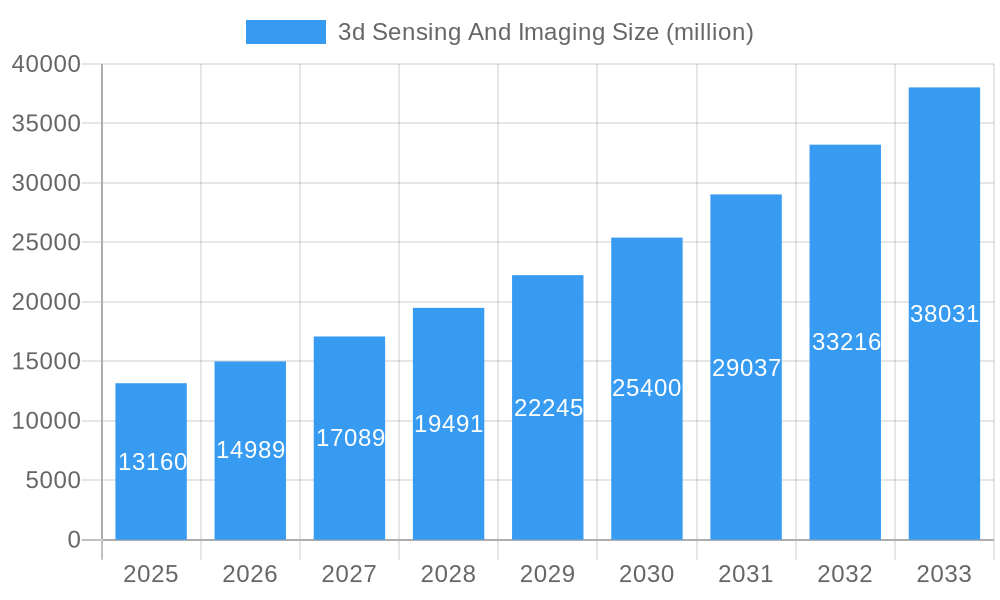
The global 3D Sensing and Imaging market is poised for substantial expansion, projected to reach $13.16 billion by 2025, driven by an impressive Compound Annual Growth Rate (CAGR) of 14.02% during the forecast period of 2025-2033. This robust growth is fueled by the increasing integration of 3D sensing technologies across a diverse range of applications, most notably in consumer electronics for enhanced user experiences, and in the automotive sector for advanced driver-assistance systems (ADAS) and autonomous driving capabilities. The healthcare industry's adoption of 3D imaging for surgical planning, diagnostics, and patient monitoring, alongside its growing use in security, surveillance, and media and entertainment for immersive content creation, are significant contributors to this upward trajectory. Advancements in sensor technology, including miniaturization and improved accuracy, coupled with the declining cost of components, are making 3D sensing more accessible and practical for widespread implementation.
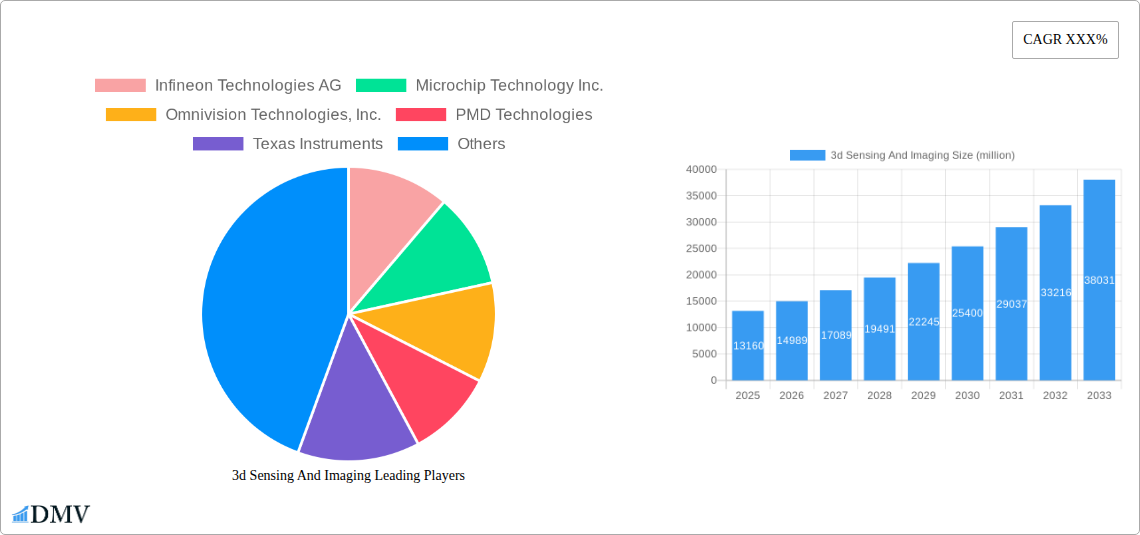
3d Sensing And Imaging Market Size (In Billion)
Key trends shaping the market include the proliferation of depth-sensing cameras in smartphones, tablets, and augmented reality (AR)/virtual reality (VR) devices, creating new avenues for interactive content and gaming. The automotive industry's relentless pursuit of safety and convenience is a major catalyst, with 3D sensing crucial for object detection, lane keeping, and parking assistance. Furthermore, the demand for sophisticated security and surveillance systems capable of detailed environmental mapping and threat detection is on the rise. While the market experiences strong growth, potential restraints include the complexity of data processing, privacy concerns associated with pervasive sensing, and the need for standardization across different platforms and technologies. However, ongoing research and development, particularly in areas like AI-powered 3D data analysis, are expected to mitigate these challenges and unlock new market opportunities.
3d Sensing And Imaging Company Market Share
3D Sensing and Imaging Market Report: Unlocking Next-Generation Insights and Opportunities
This comprehensive report dives deep into the dynamic 3D sensing and imaging market, providing critical analysis and strategic foresight for stakeholders. Covering the period from 2019–2033, with a base year of 2025 and a forecast period of 2025–2033, this research equips you with actionable intelligence on market size, segmentation, technological advancements, and key player strategies within this rapidly evolving industry. Expect to discover the potential market value projected to reach billions of dollars by 2033.
3D Sensing And Imaging Market Composition & Trends
The 3D sensing and imaging market is characterized by a moderate to high level of concentration, driven by significant investment from established technology giants and specialized innovators. Key innovation catalysts include the relentless pursuit of enhanced user experiences in consumer electronics, the demand for advanced driver-assistance systems (ADAS) in the automotive sector, and critical applications in healthcare and security. Regulatory landscapes are evolving, with a growing emphasis on data privacy and standardization for 3D data capture and utilization. Substitute products, while present in certain niche applications, are increasingly being outpaced by the superior capabilities and growing affordability of 3D sensing solutions. End-user profiles are diverse, ranging from individual consumers seeking immersive entertainment to industrial enterprises optimizing manufacturing processes and healthcare professionals improving diagnostic accuracy. Mergers & Acquisition (M&A) activities are notable, reflecting strategic consolidation and the acquisition of cutting-edge technologies. For instance, M&A deal values are projected to reach an aggregate of over $XXX billion during the forecast period, signifying robust industry consolidation and expansion. Market share distribution is influenced by patent portfolios, technological leadership, and strategic partnerships.
3D Sensing And Imaging Industry Evolution
The 3D sensing and imaging industry is poised for exponential growth, driven by a confluence of accelerating technological advancements and burgeoning consumer and industrial demands. Over the historical period of 2019–2024, we witnessed the foundational development and early adoption of various 3D sensing technologies, including Time-of-Flight (ToF), Structured Light, and Stereo Vision, particularly in premium consumer devices and automotive applications. The base year of 2025 represents a crucial inflection point, where these technologies are becoming more democratized and integrated across a wider spectrum of applications. The forecast period of 2025–2033 is anticipated to see an unprecedented surge in market expansion, with a Compound Annual Growth Rate (CAGR) projected to exceed XX%. This growth trajectory is fueled by continuous innovation in sensor resolution, depth accuracy, processing power, and the development of novel algorithms for data interpretation. Consumer demand for more intuitive and immersive interactions, whether in gaming, augmented reality (AR), or virtual reality (VR), is a primary engine. Simultaneously, the automotive sector's drive towards autonomous driving and enhanced safety features, the healthcare industry's need for advanced diagnostics and robotic surgery, and the aerospace and defense sector's requirements for sophisticated surveillance and navigation systems are creating significant market pull. Adoption metrics are expected to skyrocket, with 3D sensing modules becoming a standard component in an increasing number of devices, moving beyond niche applications to mainstream integration. The industry's evolution is marked by a shift from specialized, high-cost solutions to more affordable, high-performance modules capable of real-time 3D data acquisition and processing.
Leading Regions, Countries, or Segments in 3D Sensing And Imaging
The 3D sensing and imaging market is currently witnessing significant dominance and rapid expansion within specific regions, countries, and application segments. In terms of geographical dominance, North America and Asia-Pacific are emerging as key powerhouses.
Key Drivers in North America:
- Technological Innovation Hubs: Presence of leading technology companies and research institutions fostering rapid R&D in 3D sensing.
- Automotive Advancement: Strong adoption of ADAS and autonomous driving technologies, driving demand for automotive-grade 3D sensors.
- Consumer Electronics Penetration: High consumer spending power and early adoption of smart devices integrating 3D capabilities.
- Healthcare Investments: Substantial investment in medical imaging and robotic surgery, reliant on accurate 3D data.
Key Drivers in Asia-Pacific:
- Manufacturing Prowess: Dominance in electronics manufacturing, leading to high production volumes of devices incorporating 3D sensing.
- Growing Automotive Market: Rapid expansion of the automotive industry, with increasing integration of advanced safety and infotainment features.
- Smart City Initiatives: Government-led smart city projects are driving demand for 3D sensing in security, surveillance, and infrastructure monitoring.
- Consumer Demand Surge: A vast and growing consumer base for smartphones, AR/VR devices, and smart home technologies.
Dominant Application Segments:
- Consumer Electronics: This segment remains a primary driver, with smartphones, AR/VR headsets, and smart home devices increasingly incorporating 3D sensing for facial recognition, gesture control, and immersive experiences. The adoption of 3D depth cameras for improved photography and personalized user interfaces is significant.
- Automotive: The automotive industry is a crucial growth engine, with 3D sensing essential for ADAS, in-cabin monitoring, and the eventual realization of autonomous driving. Applications include adaptive cruise control, pedestrian detection, and driver fatigue monitoring.
- Security & Surveillance: The need for enhanced threat detection, anomaly identification, and crowd analysis is propelling the adoption of 3D sensing in surveillance systems. This includes applications in public safety, retail analytics, and industrial security.
The Wired segment, particularly in industrial and specialized applications requiring high bandwidth and low latency, continues to hold its ground. However, the Wireless segment is experiencing more rapid growth due to the increasing demand for untethered user experiences in consumer electronics and the flexibility offered in automotive and industrial automation. The shift towards advanced 3D sensing technologies, such as LiDAR and advanced ToF, is creating new market opportunities and reshaping the competitive landscape across all these segments.
3D Sensing And Imaging Product Innovations
Product innovation in 3D sensing and imaging is characterized by miniaturization, increased accuracy, enhanced speed, and reduced power consumption. Companies are developing compact, high-resolution LiDAR sensors for automotive and robotics applications, achieving a detection range of over XXX meters with accuracy of +/- XX centimeters. Advances in structured light technology enable robust object recognition and metrology, with systems capable of capturing detailed surface information in sub-XX milliseconds. Time-of-Flight (ToF) sensors are evolving with larger pixel counts and improved ambient light immunity, making them ideal for facial recognition in consumer electronics and gesture control in AR/VR. The unique selling proposition of these innovations lies in their ability to provide rich, contextual 3D data, enabling more intelligent and interactive applications across diverse industries.
Propelling Factors for 3D Sensing And Imaging Growth
Several key factors are propelling the 3D sensing and imaging market forward. Technologically, the continuous miniaturization and cost reduction of LiDAR, Time-of-Flight (ToF), and structured light sensors are making them more accessible for a wider range of applications. Economic factors include the increasing demand for automation in manufacturing, the growing adoption of ADAS in vehicles to enhance safety and driver convenience, and the rising popularity of immersive technologies like AR and VR in consumer electronics. Regulatory influences, such as stringent automotive safety standards and evolving smart city initiatives, also mandate the integration of advanced sensing capabilities.
Obstacles in the 3D Sensing And Imaging Market
Despite robust growth, the 3D sensing and imaging market faces several obstacles. Regulatory challenges, particularly concerning data privacy and the standardization of 3D data formats, can slow down adoption in certain sensitive applications. Supply chain disruptions, as witnessed in recent years, can impact the availability and cost of critical components, leading to production delays and increased expenses. Competitive pressures from numerous players vying for market share can lead to price wars and reduced profit margins for some manufacturers. Furthermore, the complexity of integrating 3D sensing systems and the need for specialized software for data processing can present adoption barriers for smaller enterprises.
Future Opportunities in 3D Sensing And Imaging
Emerging opportunities in the 3D sensing and imaging market are vast and multifaceted. The expansion of the metaverse and the increasing demand for realistic virtual experiences will drive growth in AR/VR hardware. The continued evolution of autonomous driving will necessitate more sophisticated and cost-effective 3D sensing solutions for perception and navigation. In healthcare, the adoption of 3D imaging for surgical planning, patient monitoring, and personalized medicine presents a significant growth avenue. The industrial sector's drive for Industry 4.0, with its focus on smart manufacturing, predictive maintenance, and robotic automation, will also create substantial demand. Emerging consumer trends like personalized retail experiences and advanced smart home functionalities will further fuel innovation and adoption.
Major Players in the 3D Sensing And Imaging Ecosystem
- Infineon Technologies AG
- Microchip Technology Inc.
- Omnivision Technologies, Inc.
- PMD Technologies
- Texas Instruments
- STMicroelectronics
- Softkinetic
- Asustek Computer
- Cognex Corporation
- IFM Electronic GmbH
- Intel Corporation
- LMI Technologies
- Microsoft Corporation
- Sony
- Ams AG
- Melexis
- Panasonic
- TDK Corporation
- Silicon Integrated
- OPNOUS
Key Developments in 3D Sensing And Imaging Industry
- 2023/10: Infineon Technologies AG announces a new generation of LiDAR chips offering improved range and accuracy for automotive applications.
- 2023/11: Sony unveils advanced image sensors with integrated 3D depth capabilities for smartphones and consumer electronics.
- 2024/01: Microsoft Corporation expands its Azure Mixed Reality offerings, integrating enhanced 3D scanning and rendering capabilities.
- 2024/02: STMicroelectronics introduces a new family of ToF sensors designed for enhanced gesture recognition and presence detection.
- 2024/03: Texas Instruments showcases innovative embedded processing solutions for real-time 3D data analysis in industrial automation.
- 2024/04: PMD Technologies announces strategic partnerships to accelerate the deployment of its ToF sensors in healthcare devices.
- 2024/05: Cognex Corporation launches new industrial vision systems with advanced 3D capabilities for quality inspection and robotics.
- 2024/06: LMI Technologies announces a significant expansion of its product portfolio for industrial 3D scanning and metrology.
- 2024/07: Microchip Technology Inc. introduces enhanced microcontrollers optimized for processing 3D sensing data in embedded systems.
- 2024/08: OMNIVISION Technologies, Inc. releases new high-resolution image sensors with advanced depth sensing features for mobile devices.
- 2024/09: Ams AG announces advancements in its VCSEL technology, critical for 3D sensing illumination.
Strategic 3D Sensing And Imaging Market Forecast
The 3D sensing and imaging market is set for robust growth, driven by increasing integration in mainstream applications and continuous technological advancements. Key growth catalysts include the escalating demand for immersive consumer experiences, the critical role of 3D sensing in autonomous vehicle development, and the expanding use cases in healthcare and industrial automation. Emerging trends in AR/VR, the metaverse, and smart city infrastructure will create new market frontiers. Strategic investments in R&D, coupled with favorable regulatory environments, will further accelerate market penetration, positioning 3D sensing and imaging as a foundational technology for future innovations across a multitude of industries. The market potential remains exceptionally high, projecting billions in revenue by the end of the forecast period.
3d Sensing And Imaging Segmentation
-
1. Application
- 1.1. Consumer Electronics
- 1.2. Automotive
- 1.3. Healthcare
- 1.4. Aerospace & Defense
- 1.5. Security & Surveillance
- 1.6. Media and Entertainment
- 1.7. Others
-
2. Type
- 2.1. Wired
- 2.2. Wireless
3d Sensing And Imaging Segmentation By Geography
-
1. North America
- 1.1. United States
- 1.2. Canada
- 1.3. Mexico
-
2. South America
- 2.1. Brazil
- 2.2. Argentina
- 2.3. Rest of South America
-
3. Europe
- 3.1. United Kingdom
- 3.2. Germany
- 3.3. France
- 3.4. Italy
- 3.5. Spain
- 3.6. Russia
- 3.7. Benelux
- 3.8. Nordics
- 3.9. Rest of Europe
-
4. Middle East & Africa
- 4.1. Turkey
- 4.2. Israel
- 4.3. GCC
- 4.4. North Africa
- 4.5. South Africa
- 4.6. Rest of Middle East & Africa
-
5. Asia Pacific
- 5.1. China
- 5.2. India
- 5.3. Japan
- 5.4. South Korea
- 5.5. ASEAN
- 5.6. Oceania
- 5.7. Rest of Asia Pacific
3d Sensing And Imaging Regional Market Share
Geographic Coverage of 3d Sensing And Imaging
3d Sensing And Imaging REPORT HIGHLIGHTS
| Aspects | Details |
|---|---|
| Study Period | 2020-2034 |
| Base Year | 2025 |
| Estimated Year | 2026 |
| Forecast Period | 2026-2034 |
| Historical Period | 2020-2025 |
| Growth Rate | CAGR of 14.02% from 2020-2034 |
| Segmentation |
|
Table of Contents
- 1. Introduction
- 1.1. Research Scope
- 1.2. Market Segmentation
- 1.3. Research Objective
- 1.4. Definitions and Assumptions
- 2. Executive Summary
- 2.1. Market Snapshot
- 3. Market Dynamics
- 3.1. Market Drivers
- 3.2. Market Restrains
- 3.3. Market Trends
- 3.4. Market Opportunities
- 4. Market Factor Analysis
- 4.1. Porters Five Forces
- 4.1.1. Bargaining Power of Suppliers
- 4.1.2. Bargaining Power of Buyers
- 4.1.3. Threat of New Entrants
- 4.1.4. Threat of Substitutes
- 4.1.5. Competitive Rivalry
- 4.2. PESTEL analysis
- 4.3. BCG Analysis
- 4.3.1. Stars (High Growth, High Market Share)
- 4.3.2. Cash Cows (Low Growth, High Market Share)
- 4.3.3. Question Mark (High Growth, Low Market Share)
- 4.3.4. Dogs (Low Growth, Low Market Share)
- 4.4. Ansoff Matrix Analysis
- 4.5. Supply Chain Analysis
- 4.6. Regulatory Landscape
- 4.7. Current Market Potential and Opportunity Assessment (TAM–SAM–SOM Framework)
- 4.8. DMV Analyst Note
- 4.1. Porters Five Forces
- 5. Market Analysis, Insights and Forecast 2021-2033
- 5.1. Market Analysis, Insights and Forecast - by Application
- 5.1.1. Consumer Electronics
- 5.1.2. Automotive
- 5.1.3. Healthcare
- 5.1.4. Aerospace & Defense
- 5.1.5. Security & Surveillance
- 5.1.6. Media and Entertainment
- 5.1.7. Others
- 5.2. Market Analysis, Insights and Forecast - by Type
- 5.2.1. Wired
- 5.2.2. Wireless
- 5.3. Market Analysis, Insights and Forecast - by Region
- 5.3.1. North America
- 5.3.2. South America
- 5.3.3. Europe
- 5.3.4. Middle East & Africa
- 5.3.5. Asia Pacific
- 5.1. Market Analysis, Insights and Forecast - by Application
- 6. Global 3d Sensing And Imaging Analysis, Insights and Forecast, 2021-2033
- 6.1. Market Analysis, Insights and Forecast - by Application
- 6.1.1. Consumer Electronics
- 6.1.2. Automotive
- 6.1.3. Healthcare
- 6.1.4. Aerospace & Defense
- 6.1.5. Security & Surveillance
- 6.1.6. Media and Entertainment
- 6.1.7. Others
- 6.2. Market Analysis, Insights and Forecast - by Type
- 6.2.1. Wired
- 6.2.2. Wireless
- 6.1. Market Analysis, Insights and Forecast - by Application
- 7. North America 3d Sensing And Imaging Analysis, Insights and Forecast, 2020-2032
- 7.1. Market Analysis, Insights and Forecast - by Application
- 7.1.1. Consumer Electronics
- 7.1.2. Automotive
- 7.1.3. Healthcare
- 7.1.4. Aerospace & Defense
- 7.1.5. Security & Surveillance
- 7.1.6. Media and Entertainment
- 7.1.7. Others
- 7.2. Market Analysis, Insights and Forecast - by Type
- 7.2.1. Wired
- 7.2.2. Wireless
- 7.1. Market Analysis, Insights and Forecast - by Application
- 8. South America 3d Sensing And Imaging Analysis, Insights and Forecast, 2020-2032
- 8.1. Market Analysis, Insights and Forecast - by Application
- 8.1.1. Consumer Electronics
- 8.1.2. Automotive
- 8.1.3. Healthcare
- 8.1.4. Aerospace & Defense
- 8.1.5. Security & Surveillance
- 8.1.6. Media and Entertainment
- 8.1.7. Others
- 8.2. Market Analysis, Insights and Forecast - by Type
- 8.2.1. Wired
- 8.2.2. Wireless
- 8.1. Market Analysis, Insights and Forecast - by Application
- 9. Europe 3d Sensing And Imaging Analysis, Insights and Forecast, 2020-2032
- 9.1. Market Analysis, Insights and Forecast - by Application
- 9.1.1. Consumer Electronics
- 9.1.2. Automotive
- 9.1.3. Healthcare
- 9.1.4. Aerospace & Defense
- 9.1.5. Security & Surveillance
- 9.1.6. Media and Entertainment
- 9.1.7. Others
- 9.2. Market Analysis, Insights and Forecast - by Type
- 9.2.1. Wired
- 9.2.2. Wireless
- 9.1. Market Analysis, Insights and Forecast - by Application
- 10. Middle East & Africa 3d Sensing And Imaging Analysis, Insights and Forecast, 2020-2032
- 10.1. Market Analysis, Insights and Forecast - by Application
- 10.1.1. Consumer Electronics
- 10.1.2. Automotive
- 10.1.3. Healthcare
- 10.1.4. Aerospace & Defense
- 10.1.5. Security & Surveillance
- 10.1.6. Media and Entertainment
- 10.1.7. Others
- 10.2. Market Analysis, Insights and Forecast - by Type
- 10.2.1. Wired
- 10.2.2. Wireless
- 10.1. Market Analysis, Insights and Forecast - by Application
- 11. Asia Pacific 3d Sensing And Imaging Analysis, Insights and Forecast, 2020-2032
- 11.1. Market Analysis, Insights and Forecast - by Application
- 11.1.1. Consumer Electronics
- 11.1.2. Automotive
- 11.1.3. Healthcare
- 11.1.4. Aerospace & Defense
- 11.1.5. Security & Surveillance
- 11.1.6. Media and Entertainment
- 11.1.7. Others
- 11.2. Market Analysis, Insights and Forecast - by Type
- 11.2.1. Wired
- 11.2.2. Wireless
- 11.1. Market Analysis, Insights and Forecast - by Application
- 12. Competitive Analysis
- 12.1. Company Profiles
- 12.1.1 Infineon Technologies AG
- 12.1.1.1. Company Overview
- 12.1.1.2. Products
- 12.1.1.3. Company Financials
- 12.1.1.4. SWOT Analysis
- 12.1.2 Microchip Technology Inc.
- 12.1.2.1. Company Overview
- 12.1.2.2. Products
- 12.1.2.3. Company Financials
- 12.1.2.4. SWOT Analysis
- 12.1.3 Omnivision Technologies Inc.
- 12.1.3.1. Company Overview
- 12.1.3.2. Products
- 12.1.3.3. Company Financials
- 12.1.3.4. SWOT Analysis
- 12.1.4 PMD Technologies
- 12.1.4.1. Company Overview
- 12.1.4.2. Products
- 12.1.4.3. Company Financials
- 12.1.4.4. SWOT Analysis
- 12.1.5 Texas Instruments
- 12.1.5.1. Company Overview
- 12.1.5.2. Products
- 12.1.5.3. Company Financials
- 12.1.5.4. SWOT Analysis
- 12.1.6 STMicroelectronics
- 12.1.6.1. Company Overview
- 12.1.6.2. Products
- 12.1.6.3. Company Financials
- 12.1.6.4. SWOT Analysis
- 12.1.7 Softkinetic
- 12.1.7.1. Company Overview
- 12.1.7.2. Products
- 12.1.7.3. Company Financials
- 12.1.7.4. SWOT Analysis
- 12.1.8 Asustek Computer
- 12.1.8.1. Company Overview
- 12.1.8.2. Products
- 12.1.8.3. Company Financials
- 12.1.8.4. SWOT Analysis
- 12.1.9 Cognex Corporation
- 12.1.9.1. Company Overview
- 12.1.9.2. Products
- 12.1.9.3. Company Financials
- 12.1.9.4. SWOT Analysis
- 12.1.10 IFM Electronic GmbH
- 12.1.10.1. Company Overview
- 12.1.10.2. Products
- 12.1.10.3. Company Financials
- 12.1.10.4. SWOT Analysis
- 12.1.11 Intel Corporation
- 12.1.11.1. Company Overview
- 12.1.11.2. Products
- 12.1.11.3. Company Financials
- 12.1.11.4. SWOT Analysis
- 12.1.12 LMI Technologies
- 12.1.12.1. Company Overview
- 12.1.12.2. Products
- 12.1.12.3. Company Financials
- 12.1.12.4. SWOT Analysis
- 12.1.13 Microsoft Corporation
- 12.1.13.1. Company Overview
- 12.1.13.2. Products
- 12.1.13.3. Company Financials
- 12.1.13.4. SWOT Analysis
- 12.1.14 Sony
- 12.1.14.1. Company Overview
- 12.1.14.2. Products
- 12.1.14.3. Company Financials
- 12.1.14.4. SWOT Analysis
- 12.1.15 Ams AG
- 12.1.15.1. Company Overview
- 12.1.15.2. Products
- 12.1.15.3. Company Financials
- 12.1.15.4. SWOT Analysis
- 12.1.16 Melexis
- 12.1.16.1. Company Overview
- 12.1.16.2. Products
- 12.1.16.3. Company Financials
- 12.1.16.4. SWOT Analysis
- 12.1.17 Panasonic
- 12.1.17.1. Company Overview
- 12.1.17.2. Products
- 12.1.17.3. Company Financials
- 12.1.17.4. SWOT Analysis
- 12.1.18 TDK Corporation
- 12.1.18.1. Company Overview
- 12.1.18.2. Products
- 12.1.18.3. Company Financials
- 12.1.18.4. SWOT Analysis
- 12.1.19 Silicon Integrated
- 12.1.19.1. Company Overview
- 12.1.19.2. Products
- 12.1.19.3. Company Financials
- 12.1.19.4. SWOT Analysis
- 12.1.20 OPNOUS
- 12.1.20.1. Company Overview
- 12.1.20.2. Products
- 12.1.20.3. Company Financials
- 12.1.20.4. SWOT Analysis
- 12.1.1 Infineon Technologies AG
- 12.2. Market Entropy
- 12.2.1 Company's Key Areas Served
- 12.2.2 Recent Developments
- 12.3. Company Market Share Analysis 2025
- 12.3.1 Top 5 Companies Market Share Analysis
- 12.3.2 Top 3 Companies Market Share Analysis
- 12.4. List of Potential Customers
- 13. Research Methodology
List of Figures
- Figure 1: Global 3d Sensing And Imaging Revenue Breakdown (undefined, %) by Region 2025 & 2033
- Figure 2: North America 3d Sensing And Imaging Revenue (undefined), by Application 2025 & 2033
- Figure 3: North America 3d Sensing And Imaging Revenue Share (%), by Application 2025 & 2033
- Figure 4: North America 3d Sensing And Imaging Revenue (undefined), by Type 2025 & 2033
- Figure 5: North America 3d Sensing And Imaging Revenue Share (%), by Type 2025 & 2033
- Figure 6: North America 3d Sensing And Imaging Revenue (undefined), by Country 2025 & 2033
- Figure 7: North America 3d Sensing And Imaging Revenue Share (%), by Country 2025 & 2033
- Figure 8: South America 3d Sensing And Imaging Revenue (undefined), by Application 2025 & 2033
- Figure 9: South America 3d Sensing And Imaging Revenue Share (%), by Application 2025 & 2033
- Figure 10: South America 3d Sensing And Imaging Revenue (undefined), by Type 2025 & 2033
- Figure 11: South America 3d Sensing And Imaging Revenue Share (%), by Type 2025 & 2033
- Figure 12: South America 3d Sensing And Imaging Revenue (undefined), by Country 2025 & 2033
- Figure 13: South America 3d Sensing And Imaging Revenue Share (%), by Country 2025 & 2033
- Figure 14: Europe 3d Sensing And Imaging Revenue (undefined), by Application 2025 & 2033
- Figure 15: Europe 3d Sensing And Imaging Revenue Share (%), by Application 2025 & 2033
- Figure 16: Europe 3d Sensing And Imaging Revenue (undefined), by Type 2025 & 2033
- Figure 17: Europe 3d Sensing And Imaging Revenue Share (%), by Type 2025 & 2033
- Figure 18: Europe 3d Sensing And Imaging Revenue (undefined), by Country 2025 & 2033
- Figure 19: Europe 3d Sensing And Imaging Revenue Share (%), by Country 2025 & 2033
- Figure 20: Middle East & Africa 3d Sensing And Imaging Revenue (undefined), by Application 2025 & 2033
- Figure 21: Middle East & Africa 3d Sensing And Imaging Revenue Share (%), by Application 2025 & 2033
- Figure 22: Middle East & Africa 3d Sensing And Imaging Revenue (undefined), by Type 2025 & 2033
- Figure 23: Middle East & Africa 3d Sensing And Imaging Revenue Share (%), by Type 2025 & 2033
- Figure 24: Middle East & Africa 3d Sensing And Imaging Revenue (undefined), by Country 2025 & 2033
- Figure 25: Middle East & Africa 3d Sensing And Imaging Revenue Share (%), by Country 2025 & 2033
- Figure 26: Asia Pacific 3d Sensing And Imaging Revenue (undefined), by Application 2025 & 2033
- Figure 27: Asia Pacific 3d Sensing And Imaging Revenue Share (%), by Application 2025 & 2033
- Figure 28: Asia Pacific 3d Sensing And Imaging Revenue (undefined), by Type 2025 & 2033
- Figure 29: Asia Pacific 3d Sensing And Imaging Revenue Share (%), by Type 2025 & 2033
- Figure 30: Asia Pacific 3d Sensing And Imaging Revenue (undefined), by Country 2025 & 2033
- Figure 31: Asia Pacific 3d Sensing And Imaging Revenue Share (%), by Country 2025 & 2033
List of Tables
- Table 1: Global 3d Sensing And Imaging Revenue undefined Forecast, by Application 2020 & 2033
- Table 2: Global 3d Sensing And Imaging Revenue undefined Forecast, by Type 2020 & 2033
- Table 3: Global 3d Sensing And Imaging Revenue undefined Forecast, by Region 2020 & 2033
- Table 4: Global 3d Sensing And Imaging Revenue undefined Forecast, by Application 2020 & 2033
- Table 5: Global 3d Sensing And Imaging Revenue undefined Forecast, by Type 2020 & 2033
- Table 6: Global 3d Sensing And Imaging Revenue undefined Forecast, by Country 2020 & 2033
- Table 7: United States 3d Sensing And Imaging Revenue (undefined) Forecast, by Application 2020 & 2033
- Table 8: Canada 3d Sensing And Imaging Revenue (undefined) Forecast, by Application 2020 & 2033
- Table 9: Mexico 3d Sensing And Imaging Revenue (undefined) Forecast, by Application 2020 & 2033
- Table 10: Global 3d Sensing And Imaging Revenue undefined Forecast, by Application 2020 & 2033
- Table 11: Global 3d Sensing And Imaging Revenue undefined Forecast, by Type 2020 & 2033
- Table 12: Global 3d Sensing And Imaging Revenue undefined Forecast, by Country 2020 & 2033
- Table 13: Brazil 3d Sensing And Imaging Revenue (undefined) Forecast, by Application 2020 & 2033
- Table 14: Argentina 3d Sensing And Imaging Revenue (undefined) Forecast, by Application 2020 & 2033
- Table 15: Rest of South America 3d Sensing And Imaging Revenue (undefined) Forecast, by Application 2020 & 2033
- Table 16: Global 3d Sensing And Imaging Revenue undefined Forecast, by Application 2020 & 2033
- Table 17: Global 3d Sensing And Imaging Revenue undefined Forecast, by Type 2020 & 2033
- Table 18: Global 3d Sensing And Imaging Revenue undefined Forecast, by Country 2020 & 2033
- Table 19: United Kingdom 3d Sensing And Imaging Revenue (undefined) Forecast, by Application 2020 & 2033
- Table 20: Germany 3d Sensing And Imaging Revenue (undefined) Forecast, by Application 2020 & 2033
- Table 21: France 3d Sensing And Imaging Revenue (undefined) Forecast, by Application 2020 & 2033
- Table 22: Italy 3d Sensing And Imaging Revenue (undefined) Forecast, by Application 2020 & 2033
- Table 23: Spain 3d Sensing And Imaging Revenue (undefined) Forecast, by Application 2020 & 2033
- Table 24: Russia 3d Sensing And Imaging Revenue (undefined) Forecast, by Application 2020 & 2033
- Table 25: Benelux 3d Sensing And Imaging Revenue (undefined) Forecast, by Application 2020 & 2033
- Table 26: Nordics 3d Sensing And Imaging Revenue (undefined) Forecast, by Application 2020 & 2033
- Table 27: Rest of Europe 3d Sensing And Imaging Revenue (undefined) Forecast, by Application 2020 & 2033
- Table 28: Global 3d Sensing And Imaging Revenue undefined Forecast, by Application 2020 & 2033
- Table 29: Global 3d Sensing And Imaging Revenue undefined Forecast, by Type 2020 & 2033
- Table 30: Global 3d Sensing And Imaging Revenue undefined Forecast, by Country 2020 & 2033
- Table 31: Turkey 3d Sensing And Imaging Revenue (undefined) Forecast, by Application 2020 & 2033
- Table 32: Israel 3d Sensing And Imaging Revenue (undefined) Forecast, by Application 2020 & 2033
- Table 33: GCC 3d Sensing And Imaging Revenue (undefined) Forecast, by Application 2020 & 2033
- Table 34: North Africa 3d Sensing And Imaging Revenue (undefined) Forecast, by Application 2020 & 2033
- Table 35: South Africa 3d Sensing And Imaging Revenue (undefined) Forecast, by Application 2020 & 2033
- Table 36: Rest of Middle East & Africa 3d Sensing And Imaging Revenue (undefined) Forecast, by Application 2020 & 2033
- Table 37: Global 3d Sensing And Imaging Revenue undefined Forecast, by Application 2020 & 2033
- Table 38: Global 3d Sensing And Imaging Revenue undefined Forecast, by Type 2020 & 2033
- Table 39: Global 3d Sensing And Imaging Revenue undefined Forecast, by Country 2020 & 2033
- Table 40: China 3d Sensing And Imaging Revenue (undefined) Forecast, by Application 2020 & 2033
- Table 41: India 3d Sensing And Imaging Revenue (undefined) Forecast, by Application 2020 & 2033
- Table 42: Japan 3d Sensing And Imaging Revenue (undefined) Forecast, by Application 2020 & 2033
- Table 43: South Korea 3d Sensing And Imaging Revenue (undefined) Forecast, by Application 2020 & 2033
- Table 44: ASEAN 3d Sensing And Imaging Revenue (undefined) Forecast, by Application 2020 & 2033
- Table 45: Oceania 3d Sensing And Imaging Revenue (undefined) Forecast, by Application 2020 & 2033
- Table 46: Rest of Asia Pacific 3d Sensing And Imaging Revenue (undefined) Forecast, by Application 2020 & 2033
Frequently Asked Questions
1. What is the projected Compound Annual Growth Rate (CAGR) of the 3d Sensing And Imaging?
The projected CAGR is approximately 14.02%.
2. Which companies are prominent players in the 3d Sensing And Imaging?
Key companies in the market include Infineon Technologies AG, Microchip Technology Inc., Omnivision Technologies, Inc., PMD Technologies, Texas Instruments, STMicroelectronics, Softkinetic, Asustek Computer, Cognex Corporation, IFM Electronic GmbH, Intel Corporation, LMI Technologies, Microsoft Corporation, Sony, Ams AG, Melexis, Panasonic, TDK Corporation, Silicon Integrated, OPNOUS.
3. What are the main segments of the 3d Sensing And Imaging?
The market segments include Application, Type.
4. Can you provide details about the market size?
The market size is estimated to be USD XXX N/A as of 2022.
5. What are some drivers contributing to market growth?
N/A
6. What are the notable trends driving market growth?
N/A
7. Are there any restraints impacting market growth?
N/A
8. Can you provide examples of recent developments in the market?
N/A
9. What pricing options are available for accessing the report?
Pricing options include single-user, multi-user, and enterprise licenses priced at USD 3950.00, USD 5925.00, and USD 7900.00 respectively.
10. Is the market size provided in terms of value or volume?
The market size is provided in terms of value, measured in N/A.
11. Are there any specific market keywords associated with the report?
Yes, the market keyword associated with the report is "3d Sensing And Imaging," which aids in identifying and referencing the specific market segment covered.
12. How do I determine which pricing option suits my needs best?
The pricing options vary based on user requirements and access needs. Individual users may opt for single-user licenses, while businesses requiring broader access may choose multi-user or enterprise licenses for cost-effective access to the report.
13. Are there any additional resources or data provided in the 3d Sensing And Imaging report?
While the report offers comprehensive insights, it's advisable to review the specific contents or supplementary materials provided to ascertain if additional resources or data are available.
14. How can I stay updated on further developments or reports in the 3d Sensing And Imaging?
To stay informed about further developments, trends, and reports in the 3d Sensing And Imaging, consider subscribing to industry newsletters, following relevant companies and organizations, or regularly checking reputable industry news sources and publications.
Methodology
Step 1 - Identification of Relevant Samples Size from Population Database


Step 2 - Approaches for Defining Global Market Size (Value, Volume* & Price*)

Note*: In applicable scenarios
Step 3 - Data Sources
Primary Research
- Web Analytics
- Survey Reports
- Research Institute
- Latest Research Reports
- Opinion Leaders
Secondary Research
- Annual Reports
- White Paper
- Latest Press Release
- Industry Association
- Paid Database
- Investor Presentations

Step 4 - Data Triangulation
Involves using different sources of information in order to increase the validity of a study
These sources are likely to be stakeholders in a program - participants, other researchers, program staff, other community members, and so on.
Then we put all data in single framework & apply various statistical tools to find out the dynamic on the market.
During the analysis stage, feedback from the stakeholder groups would be compared to determine areas of agreement as well as areas of divergence