

Key Insights
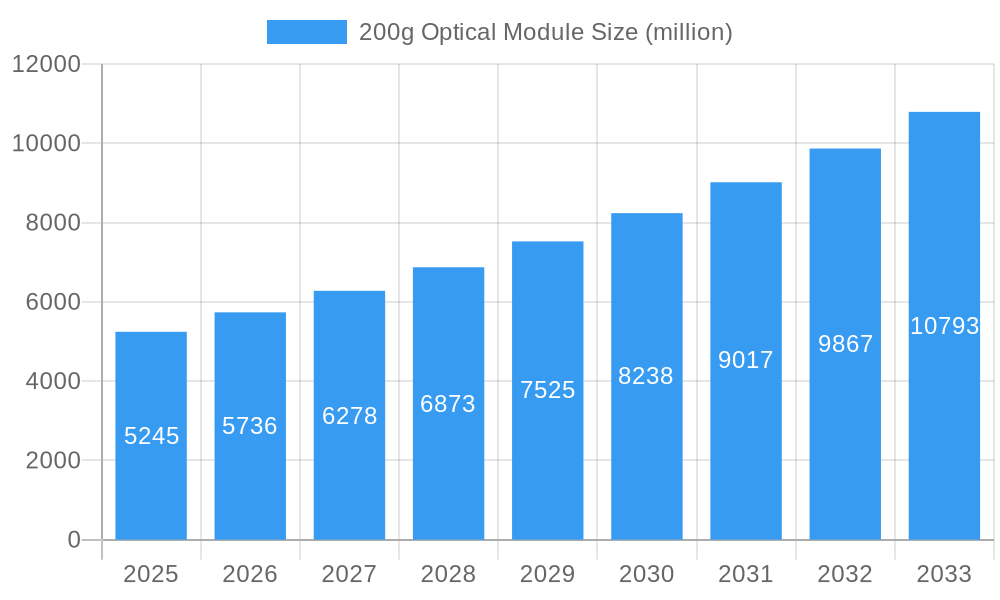
The 200G optical module market, valued at $5.245 billion in 2025, is poised for substantial growth, driven by the increasing demand for higher bandwidth in data centers and telecommunications networks. The 9.1% CAGR projected from 2025 to 2033 indicates a significant expansion of this market, fueled by the proliferation of cloud computing, 5G deployment, and the growing adoption of high-performance computing (HPC). Key drivers include the need for faster data transmission speeds to support demanding applications like artificial intelligence (AI), machine learning (ML), and the Internet of Things (IoT). Technological advancements, such as the development of more efficient and cost-effective 200G modules, are further accelerating market growth. While challenges remain, such as the complexities of integrating these modules into existing infrastructure and the need for standardized interfaces, these are being actively addressed by industry players. The competitive landscape is dynamic, featuring established players like Cisco, Huawei, and Intel alongside emerging companies focused on innovation and specialized solutions.
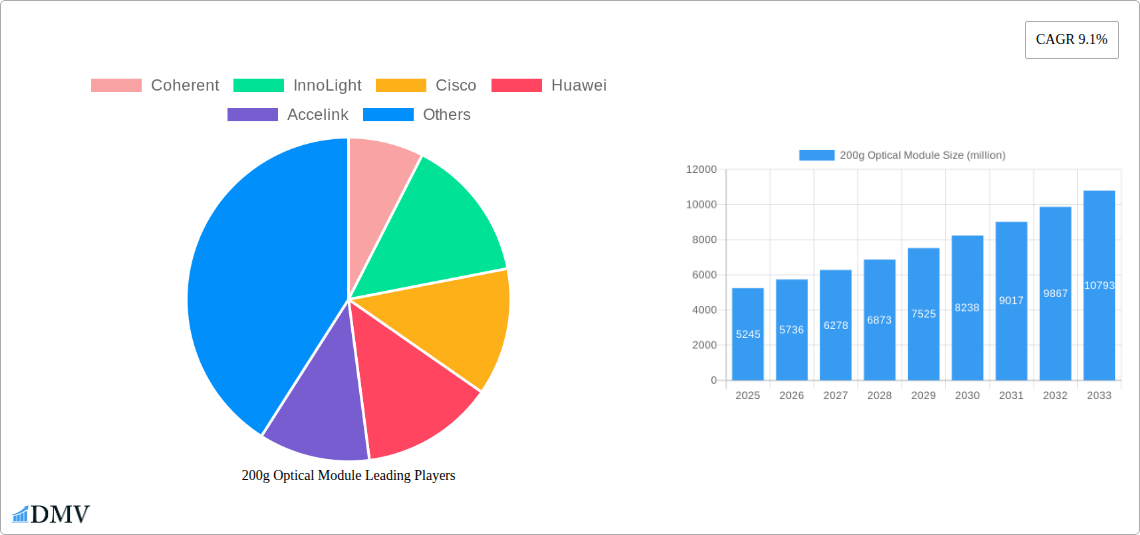
200g Optical Module Market Size (In Billion)
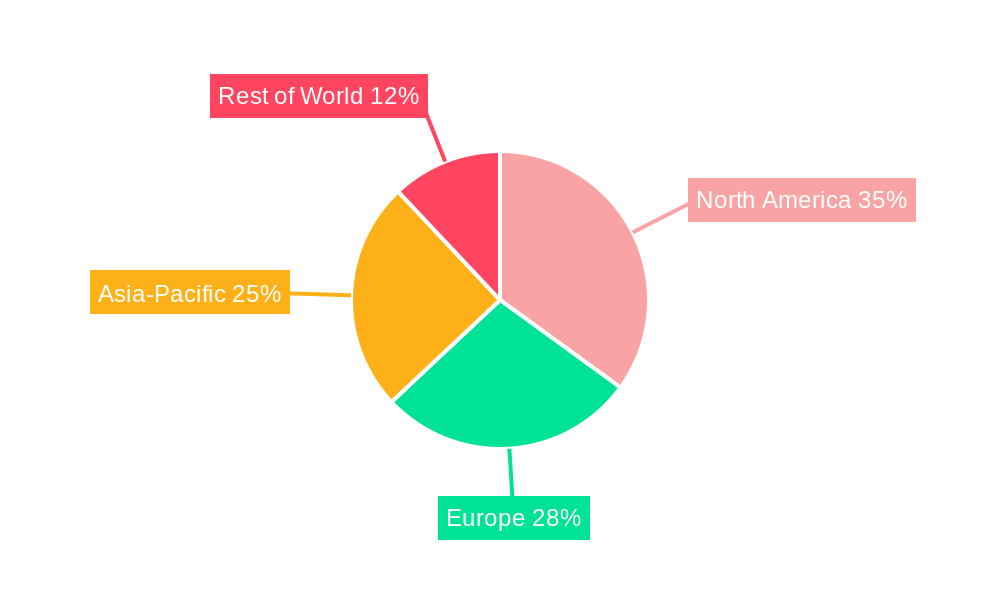
This robust growth is segmented across various applications, including data center interconnect (DCI), metro networks, and long-haul transmission. The North American and European markets are currently leading the adoption of 200G optical modules, but significant growth is anticipated in Asia-Pacific regions, driven by rapidly expanding digital infrastructure. The continued miniaturization and power efficiency improvements in 200G technology will be crucial in enabling wider adoption. Furthermore, the evolution towards 400G and beyond will likely influence the market's trajectory, potentially leading to a faster adoption rate and a shift in market share among various vendors as companies compete to provide innovative and cost-effective solutions in the evolving landscape.
200g Optical Module Company Market Share
200g Optical Module Market Report: A Comprehensive Analysis (2019-2033)
This insightful report provides a comprehensive analysis of the global 200g optical module market, projecting a market value exceeding $XX million by 2033. The study covers the historical period (2019-2024), the base year (2025), and the forecast period (2025-2033), offering stakeholders invaluable insights into market dynamics, competitive landscapes, and future growth opportunities. The report meticulously analyzes key players like Coherent, InnoLight, Cisco, Huawei, and others, offering a granular understanding of market share distribution, technological advancements, and strategic imperatives.
200g Optical Module Market Composition & Trends
This section evaluates the market concentration, analyzing the market share distribution amongst leading players like Cisco, Huawei, and others. We delve into innovation drivers such as the increasing demand for higher bandwidth and the continuous miniaturization of optical components. The regulatory landscape, particularly concerning standards and certifications, will be examined, alongside an analysis of substitute products and their competitive impact. Furthermore, the report explores end-user profiles across various sectors and details significant M&A activities within the industry, including estimated deal values (in millions).
- Market Share Distribution (2025): Cisco (XX%), Huawei (XX%), Coherent (XX%), InnoLight (XX%), Others (XX%).
- Top 3 M&A Deals (2019-2024): Deal 1: $XX million, Deal 2: $XX million, Deal 3: $XX million.
- Key Market Drivers: Increased data center traffic, 5G rollout, cloud computing expansion.
- Emerging Trends: Miniaturization, power efficiency improvements, cost reduction strategies.
200g Optical Module Industry Evolution
This section details the evolution of the 200g optical module market, tracking its growth trajectory from 2019 to 2033. We analyze technological advancements, such as the shift from parallel optics to coherent transmission, impacting market growth rates and adoption metrics across various segments. The evolving consumer demands for higher speed and lower latency are meticulously examined, influencing the design and development of next-generation 200g optical modules. Detailed analysis of market growth rates (CAGR) for the forecast period is included, along with adoption rates in key end-user sectors.
Leading Regions, Countries, or Segments in 200g Optical Module
This section identifies the dominant regions and countries driving market growth. A detailed analysis of the factors contributing to their dominance, such as substantial investments in data center infrastructure, supportive government policies, and robust technological ecosystems, is provided.
- Dominant Region: North America/Asia (depending on data analysis)
- Key Drivers (Dominant Region):
- High investments in data center infrastructure exceeding $XX million annually.
- Strong government support for 5G and digital transformation initiatives.
- Presence of major technology companies and a robust supply chain.
- Dominant Country: United States/China (depending on data analysis)
- Analysis of market size and growth drivers specific to the dominant country.
200g Optical Module Product Innovations
This section highlights recent product innovations, emphasizing their unique selling propositions and the technological advancements driving performance improvements. Specific details on new features, enhanced capabilities, and superior performance metrics (e.g., improved bit error rate, lower power consumption) are provided. The applications benefiting from these innovations are also examined.
Propelling Factors for 200g Optical Module Growth
Several factors are driving the growth of the 200g optical module market. These include:
- Technological Advancements: Miniaturization, increased bandwidth capacity, and improved power efficiency.
- Economic Factors: Expanding data center infrastructure and increased demand for high-speed data transmission.
- Regulatory Influences: Government support for 5G and digital infrastructure development.
Obstacles in the 200g Optical Module Market
The market faces challenges such as:
- Regulatory Hurdles: Navigating complex international standards and regulations.
- Supply Chain Disruptions: Potential bottlenecks in the supply of key components.
- Competitive Pressures: Intense competition from established players and new entrants.
Future Opportunities in 200g Optical Module
Future opportunities include:
- Expansion into New Markets: Growth in emerging economies and untapped sectors.
- Technological Advancements: Development of next-generation coherent optical modules with even higher bandwidth and lower latency.
- Emerging Applications: Opportunities in areas such as autonomous vehicles and the Internet of Things (IoT).
Key Developments in 200g Optical Module Industry
- [Month, Year]: Company X launched a new 200g optical module with enhanced features.
- [Month, Year]: Company Y and Company Z announced a strategic partnership to develop next-generation optical modules.
- [Month, Year]: New industry standards for 200g optical modules were released. (Further bullet points would be added here based on actual data).
Strategic 200g Optical Module Market Forecast
The 200g optical module market is poised for significant growth driven by the relentless demand for higher bandwidth and the expansion of data-intensive applications. The continued advancements in technology, coupled with favorable regulatory support and increasing investments in infrastructure, will fuel market expansion exceeding $XX million by 2033. Strategic partnerships and M&A activities are expected to shape the competitive landscape further, driving innovation and accelerating market penetration.
200g Optical Module Segmentation
-
1. Application
- 1.1. Data Center
- 1.2. Ethernet
- 1.3. Cloud Network
-
2. Type
- 2.1. 200G QSFP56 Module
- 2.2. 200G QSFP-DD Module
200g Optical Module Segmentation By Geography
-
1. North America
- 1.1. United States
- 1.2. Canada
- 1.3. Mexico
-
2. South America
- 2.1. Brazil
- 2.2. Argentina
- 2.3. Rest of South America
-
3. Europe
- 3.1. United Kingdom
- 3.2. Germany
- 3.3. France
- 3.4. Italy
- 3.5. Spain
- 3.6. Russia
- 3.7. Benelux
- 3.8. Nordics
- 3.9. Rest of Europe
-
4. Middle East & Africa
- 4.1. Turkey
- 4.2. Israel
- 4.3. GCC
- 4.4. North Africa
- 4.5. South Africa
- 4.6. Rest of Middle East & Africa
-
5. Asia Pacific
- 5.1. China
- 5.2. India
- 5.3. Japan
- 5.4. South Korea
- 5.5. ASEAN
- 5.6. Oceania
- 5.7. Rest of Asia Pacific
200g Optical Module Regional Market Share
Geographic Coverage of 200g Optical Module
200g Optical Module REPORT HIGHLIGHTS
| Aspects | Details |
|---|---|
| Study Period | 2020-2034 |
| Base Year | 2025 |
| Estimated Year | 2026 |
| Forecast Period | 2026-2034 |
| Historical Period | 2020-2025 |
| Growth Rate | CAGR of 9.1% from 2020-2034 |
| Segmentation |
|
Table of Contents
- 1. Introduction
- 1.1. Research Scope
- 1.2. Market Segmentation
- 1.3. Research Objective
- 1.4. Definitions and Assumptions
- 2. Executive Summary
- 2.1. Market Snapshot
- 3. Market Dynamics
- 3.1. Market Drivers
- 3.2. Market Restrains
- 3.3. Market Trends
- 3.4. Market Opportunities
- 4. Market Factor Analysis
- 4.1. Porters Five Forces
- 4.1.1. Bargaining Power of Suppliers
- 4.1.2. Bargaining Power of Buyers
- 4.1.3. Threat of New Entrants
- 4.1.4. Threat of Substitutes
- 4.1.5. Competitive Rivalry
- 4.2. PESTEL analysis
- 4.3. BCG Analysis
- 4.3.1. Stars (High Growth, High Market Share)
- 4.3.2. Cash Cows (Low Growth, High Market Share)
- 4.3.3. Question Mark (High Growth, Low Market Share)
- 4.3.4. Dogs (Low Growth, Low Market Share)
- 4.4. Ansoff Matrix Analysis
- 4.5. Supply Chain Analysis
- 4.6. Regulatory Landscape
- 4.7. Current Market Potential and Opportunity Assessment (TAM–SAM–SOM Framework)
- 4.8. DMV Analyst Note
- 4.1. Porters Five Forces
- 5. Market Analysis, Insights and Forecast 2021-2033
- 5.1. Market Analysis, Insights and Forecast - by Application
- 5.1.1. Data Center
- 5.1.2. Ethernet
- 5.1.3. Cloud Network
- 5.2. Market Analysis, Insights and Forecast - by Type
- 5.2.1. 200G QSFP56 Module
- 5.2.2. 200G QSFP-DD Module
- 5.3. Market Analysis, Insights and Forecast - by Region
- 5.3.1. North America
- 5.3.2. South America
- 5.3.3. Europe
- 5.3.4. Middle East & Africa
- 5.3.5. Asia Pacific
- 5.1. Market Analysis, Insights and Forecast - by Application
- 6. Global 200g Optical Module Analysis, Insights and Forecast, 2021-2033
- 6.1. Market Analysis, Insights and Forecast - by Application
- 6.1.1. Data Center
- 6.1.2. Ethernet
- 6.1.3. Cloud Network
- 6.2. Market Analysis, Insights and Forecast - by Type
- 6.2.1. 200G QSFP56 Module
- 6.2.2. 200G QSFP-DD Module
- 6.1. Market Analysis, Insights and Forecast - by Application
- 7. North America 200g Optical Module Analysis, Insights and Forecast, 2020-2032
- 7.1. Market Analysis, Insights and Forecast - by Application
- 7.1.1. Data Center
- 7.1.2. Ethernet
- 7.1.3. Cloud Network
- 7.2. Market Analysis, Insights and Forecast - by Type
- 7.2.1. 200G QSFP56 Module
- 7.2.2. 200G QSFP-DD Module
- 7.1. Market Analysis, Insights and Forecast - by Application
- 8. South America 200g Optical Module Analysis, Insights and Forecast, 2020-2032
- 8.1. Market Analysis, Insights and Forecast - by Application
- 8.1.1. Data Center
- 8.1.2. Ethernet
- 8.1.3. Cloud Network
- 8.2. Market Analysis, Insights and Forecast - by Type
- 8.2.1. 200G QSFP56 Module
- 8.2.2. 200G QSFP-DD Module
- 8.1. Market Analysis, Insights and Forecast - by Application
- 9. Europe 200g Optical Module Analysis, Insights and Forecast, 2020-2032
- 9.1. Market Analysis, Insights and Forecast - by Application
- 9.1.1. Data Center
- 9.1.2. Ethernet
- 9.1.3. Cloud Network
- 9.2. Market Analysis, Insights and Forecast - by Type
- 9.2.1. 200G QSFP56 Module
- 9.2.2. 200G QSFP-DD Module
- 9.1. Market Analysis, Insights and Forecast - by Application
- 10. Middle East & Africa 200g Optical Module Analysis, Insights and Forecast, 2020-2032
- 10.1. Market Analysis, Insights and Forecast - by Application
- 10.1.1. Data Center
- 10.1.2. Ethernet
- 10.1.3. Cloud Network
- 10.2. Market Analysis, Insights and Forecast - by Type
- 10.2.1. 200G QSFP56 Module
- 10.2.2. 200G QSFP-DD Module
- 10.1. Market Analysis, Insights and Forecast - by Application
- 11. Asia Pacific 200g Optical Module Analysis, Insights and Forecast, 2020-2032
- 11.1. Market Analysis, Insights and Forecast - by Application
- 11.1.1. Data Center
- 11.1.2. Ethernet
- 11.1.3. Cloud Network
- 11.2. Market Analysis, Insights and Forecast - by Type
- 11.2.1. 200G QSFP56 Module
- 11.2.2. 200G QSFP-DD Module
- 11.1. Market Analysis, Insights and Forecast - by Application
- 12. Competitive Analysis
- 12.1. Company Profiles
- 12.1.1 Coherent
- 12.1.1.1. Company Overview
- 12.1.1.2. Products
- 12.1.1.3. Company Financials
- 12.1.1.4. SWOT Analysis
- 12.1.2 InnoLight
- 12.1.2.1. Company Overview
- 12.1.2.2. Products
- 12.1.2.3. Company Financials
- 12.1.2.4. SWOT Analysis
- 12.1.3 Cisco
- 12.1.3.1. Company Overview
- 12.1.3.2. Products
- 12.1.3.3. Company Financials
- 12.1.3.4. SWOT Analysis
- 12.1.4 Huawei
- 12.1.4.1. Company Overview
- 12.1.4.2. Products
- 12.1.4.3. Company Financials
- 12.1.4.4. SWOT Analysis
- 12.1.5 Accelink
- 12.1.5.1. Company Overview
- 12.1.5.2. Products
- 12.1.5.3. Company Financials
- 12.1.5.4. SWOT Analysis
- 12.1.6 Hisense
- 12.1.6.1. Company Overview
- 12.1.6.2. Products
- 12.1.6.3. Company Financials
- 12.1.6.4. SWOT Analysis
- 12.1.7 Eoptolink
- 12.1.7.1. Company Overview
- 12.1.7.2. Products
- 12.1.7.3. Company Financials
- 12.1.7.4. SWOT Analysis
- 12.1.8 HGG
- 12.1.8.1. Company Overview
- 12.1.8.2. Products
- 12.1.8.3. Company Financials
- 12.1.8.4. SWOT Analysis
- 12.1.9 Intel
- 12.1.9.1. Company Overview
- 12.1.9.2. Products
- 12.1.9.3. Company Financials
- 12.1.9.4. SWOT Analysis
- 12.1.10 Source Photonics
- 12.1.10.1. Company Overview
- 12.1.10.2. Products
- 12.1.10.3. Company Financials
- 12.1.10.4. SWOT Analysis
- 12.1.11 Kyocera
- 12.1.11.1. Company Overview
- 12.1.11.2. Products
- 12.1.11.3. Company Financials
- 12.1.11.4. SWOT Analysis
- 12.1.12 Broadcom
- 12.1.12.1. Company Overview
- 12.1.12.2. Products
- 12.1.12.3. Company Financials
- 12.1.12.4. SWOT Analysis
- 12.1.13 Sumitomo Electric Industries
- 12.1.13.1. Company Overview
- 12.1.13.2. Products
- 12.1.13.3. Company Financials
- 12.1.13.4. SWOT Analysis
- 12.1.14 Gigalight
- 12.1.14.1. Company Overview
- 12.1.14.2. Products
- 12.1.14.3. Company Financials
- 12.1.14.4. SWOT Analysis
- 12.1.15 ATOP Technology
- 12.1.15.1. Company Overview
- 12.1.15.2. Products
- 12.1.15.3. Company Financials
- 12.1.15.4. SWOT Analysis
- 12.1.16 FIBERSTAMP
- 12.1.16.1. Company Overview
- 12.1.16.2. Products
- 12.1.16.3. Company Financials
- 12.1.16.4. SWOT Analysis
- 12.1.17 FOIT
- 12.1.17.1. Company Overview
- 12.1.17.2. Products
- 12.1.17.3. Company Financials
- 12.1.17.4. SWOT Analysis
- 12.1.18 Lumentum
- 12.1.18.1. Company Overview
- 12.1.18.2. Products
- 12.1.18.3. Company Financials
- 12.1.18.4. SWOT Analysis
- 12.1.19 AOI
- 12.1.19.1. Company Overview
- 12.1.19.2. Products
- 12.1.19.3. Company Financials
- 12.1.19.4. SWOT Analysis
- 12.1.20 Fujitsu
- 12.1.20.1. Company Overview
- 12.1.20.2. Products
- 12.1.20.3. Company Financials
- 12.1.20.4. SWOT Analysis
- 12.1.21 CIGTECH
- 12.1.21.1. Company Overview
- 12.1.21.2. Products
- 12.1.21.3. Company Financials
- 12.1.21.4. SWOT Analysis
- 12.1.22 Broadex Technologies
- 12.1.22.1. Company Overview
- 12.1.22.2. Products
- 12.1.22.3. Company Financials
- 12.1.22.4. SWOT Analysis
- 12.1.23 Guangdong Unionman
- 12.1.23.1. Company Overview
- 12.1.23.2. Products
- 12.1.23.3. Company Financials
- 12.1.23.4. SWOT Analysis
- 12.1.1 Coherent
- 12.2. Market Entropy
- 12.2.1 Company's Key Areas Served
- 12.2.2 Recent Developments
- 12.3. Company Market Share Analysis 2025
- 12.3.1 Top 5 Companies Market Share Analysis
- 12.3.2 Top 3 Companies Market Share Analysis
- 12.4. List of Potential Customers
- 13. Research Methodology
List of Figures
- Figure 1: Global 200g Optical Module Revenue Breakdown (million, %) by Region 2025 & 2033
- Figure 2: Global 200g Optical Module Volume Breakdown (K, %) by Region 2025 & 2033
- Figure 3: North America 200g Optical Module Revenue (million), by Application 2025 & 2033
- Figure 4: North America 200g Optical Module Volume (K), by Application 2025 & 2033
- Figure 5: North America 200g Optical Module Revenue Share (%), by Application 2025 & 2033
- Figure 6: North America 200g Optical Module Volume Share (%), by Application 2025 & 2033
- Figure 7: North America 200g Optical Module Revenue (million), by Type 2025 & 2033
- Figure 8: North America 200g Optical Module Volume (K), by Type 2025 & 2033
- Figure 9: North America 200g Optical Module Revenue Share (%), by Type 2025 & 2033
- Figure 10: North America 200g Optical Module Volume Share (%), by Type 2025 & 2033
- Figure 11: North America 200g Optical Module Revenue (million), by Country 2025 & 2033
- Figure 12: North America 200g Optical Module Volume (K), by Country 2025 & 2033
- Figure 13: North America 200g Optical Module Revenue Share (%), by Country 2025 & 2033
- Figure 14: North America 200g Optical Module Volume Share (%), by Country 2025 & 2033
- Figure 15: South America 200g Optical Module Revenue (million), by Application 2025 & 2033
- Figure 16: South America 200g Optical Module Volume (K), by Application 2025 & 2033
- Figure 17: South America 200g Optical Module Revenue Share (%), by Application 2025 & 2033
- Figure 18: South America 200g Optical Module Volume Share (%), by Application 2025 & 2033
- Figure 19: South America 200g Optical Module Revenue (million), by Type 2025 & 2033
- Figure 20: South America 200g Optical Module Volume (K), by Type 2025 & 2033
- Figure 21: South America 200g Optical Module Revenue Share (%), by Type 2025 & 2033
- Figure 22: South America 200g Optical Module Volume Share (%), by Type 2025 & 2033
- Figure 23: South America 200g Optical Module Revenue (million), by Country 2025 & 2033
- Figure 24: South America 200g Optical Module Volume (K), by Country 2025 & 2033
- Figure 25: South America 200g Optical Module Revenue Share (%), by Country 2025 & 2033
- Figure 26: South America 200g Optical Module Volume Share (%), by Country 2025 & 2033
- Figure 27: Europe 200g Optical Module Revenue (million), by Application 2025 & 2033
- Figure 28: Europe 200g Optical Module Volume (K), by Application 2025 & 2033
- Figure 29: Europe 200g Optical Module Revenue Share (%), by Application 2025 & 2033
- Figure 30: Europe 200g Optical Module Volume Share (%), by Application 2025 & 2033
- Figure 31: Europe 200g Optical Module Revenue (million), by Type 2025 & 2033
- Figure 32: Europe 200g Optical Module Volume (K), by Type 2025 & 2033
- Figure 33: Europe 200g Optical Module Revenue Share (%), by Type 2025 & 2033
- Figure 34: Europe 200g Optical Module Volume Share (%), by Type 2025 & 2033
- Figure 35: Europe 200g Optical Module Revenue (million), by Country 2025 & 2033
- Figure 36: Europe 200g Optical Module Volume (K), by Country 2025 & 2033
- Figure 37: Europe 200g Optical Module Revenue Share (%), by Country 2025 & 2033
- Figure 38: Europe 200g Optical Module Volume Share (%), by Country 2025 & 2033
- Figure 39: Middle East & Africa 200g Optical Module Revenue (million), by Application 2025 & 2033
- Figure 40: Middle East & Africa 200g Optical Module Volume (K), by Application 2025 & 2033
- Figure 41: Middle East & Africa 200g Optical Module Revenue Share (%), by Application 2025 & 2033
- Figure 42: Middle East & Africa 200g Optical Module Volume Share (%), by Application 2025 & 2033
- Figure 43: Middle East & Africa 200g Optical Module Revenue (million), by Type 2025 & 2033
- Figure 44: Middle East & Africa 200g Optical Module Volume (K), by Type 2025 & 2033
- Figure 45: Middle East & Africa 200g Optical Module Revenue Share (%), by Type 2025 & 2033
- Figure 46: Middle East & Africa 200g Optical Module Volume Share (%), by Type 2025 & 2033
- Figure 47: Middle East & Africa 200g Optical Module Revenue (million), by Country 2025 & 2033
- Figure 48: Middle East & Africa 200g Optical Module Volume (K), by Country 2025 & 2033
- Figure 49: Middle East & Africa 200g Optical Module Revenue Share (%), by Country 2025 & 2033
- Figure 50: Middle East & Africa 200g Optical Module Volume Share (%), by Country 2025 & 2033
- Figure 51: Asia Pacific 200g Optical Module Revenue (million), by Application 2025 & 2033
- Figure 52: Asia Pacific 200g Optical Module Volume (K), by Application 2025 & 2033
- Figure 53: Asia Pacific 200g Optical Module Revenue Share (%), by Application 2025 & 2033
- Figure 54: Asia Pacific 200g Optical Module Volume Share (%), by Application 2025 & 2033
- Figure 55: Asia Pacific 200g Optical Module Revenue (million), by Type 2025 & 2033
- Figure 56: Asia Pacific 200g Optical Module Volume (K), by Type 2025 & 2033
- Figure 57: Asia Pacific 200g Optical Module Revenue Share (%), by Type 2025 & 2033
- Figure 58: Asia Pacific 200g Optical Module Volume Share (%), by Type 2025 & 2033
- Figure 59: Asia Pacific 200g Optical Module Revenue (million), by Country 2025 & 2033
- Figure 60: Asia Pacific 200g Optical Module Volume (K), by Country 2025 & 2033
- Figure 61: Asia Pacific 200g Optical Module Revenue Share (%), by Country 2025 & 2033
- Figure 62: Asia Pacific 200g Optical Module Volume Share (%), by Country 2025 & 2033
List of Tables
- Table 1: Global 200g Optical Module Revenue million Forecast, by Application 2020 & 2033
- Table 2: Global 200g Optical Module Volume K Forecast, by Application 2020 & 2033
- Table 3: Global 200g Optical Module Revenue million Forecast, by Type 2020 & 2033
- Table 4: Global 200g Optical Module Volume K Forecast, by Type 2020 & 2033
- Table 5: Global 200g Optical Module Revenue million Forecast, by Region 2020 & 2033
- Table 6: Global 200g Optical Module Volume K Forecast, by Region 2020 & 2033
- Table 7: Global 200g Optical Module Revenue million Forecast, by Application 2020 & 2033
- Table 8: Global 200g Optical Module Volume K Forecast, by Application 2020 & 2033
- Table 9: Global 200g Optical Module Revenue million Forecast, by Type 2020 & 2033
- Table 10: Global 200g Optical Module Volume K Forecast, by Type 2020 & 2033
- Table 11: Global 200g Optical Module Revenue million Forecast, by Country 2020 & 2033
- Table 12: Global 200g Optical Module Volume K Forecast, by Country 2020 & 2033
- Table 13: United States 200g Optical Module Revenue (million) Forecast, by Application 2020 & 2033
- Table 14: United States 200g Optical Module Volume (K) Forecast, by Application 2020 & 2033
- Table 15: Canada 200g Optical Module Revenue (million) Forecast, by Application 2020 & 2033
- Table 16: Canada 200g Optical Module Volume (K) Forecast, by Application 2020 & 2033
- Table 17: Mexico 200g Optical Module Revenue (million) Forecast, by Application 2020 & 2033
- Table 18: Mexico 200g Optical Module Volume (K) Forecast, by Application 2020 & 2033
- Table 19: Global 200g Optical Module Revenue million Forecast, by Application 2020 & 2033
- Table 20: Global 200g Optical Module Volume K Forecast, by Application 2020 & 2033
- Table 21: Global 200g Optical Module Revenue million Forecast, by Type 2020 & 2033
- Table 22: Global 200g Optical Module Volume K Forecast, by Type 2020 & 2033
- Table 23: Global 200g Optical Module Revenue million Forecast, by Country 2020 & 2033
- Table 24: Global 200g Optical Module Volume K Forecast, by Country 2020 & 2033
- Table 25: Brazil 200g Optical Module Revenue (million) Forecast, by Application 2020 & 2033
- Table 26: Brazil 200g Optical Module Volume (K) Forecast, by Application 2020 & 2033
- Table 27: Argentina 200g Optical Module Revenue (million) Forecast, by Application 2020 & 2033
- Table 28: Argentina 200g Optical Module Volume (K) Forecast, by Application 2020 & 2033
- Table 29: Rest of South America 200g Optical Module Revenue (million) Forecast, by Application 2020 & 2033
- Table 30: Rest of South America 200g Optical Module Volume (K) Forecast, by Application 2020 & 2033
- Table 31: Global 200g Optical Module Revenue million Forecast, by Application 2020 & 2033
- Table 32: Global 200g Optical Module Volume K Forecast, by Application 2020 & 2033
- Table 33: Global 200g Optical Module Revenue million Forecast, by Type 2020 & 2033
- Table 34: Global 200g Optical Module Volume K Forecast, by Type 2020 & 2033
- Table 35: Global 200g Optical Module Revenue million Forecast, by Country 2020 & 2033
- Table 36: Global 200g Optical Module Volume K Forecast, by Country 2020 & 2033
- Table 37: United Kingdom 200g Optical Module Revenue (million) Forecast, by Application 2020 & 2033
- Table 38: United Kingdom 200g Optical Module Volume (K) Forecast, by Application 2020 & 2033
- Table 39: Germany 200g Optical Module Revenue (million) Forecast, by Application 2020 & 2033
- Table 40: Germany 200g Optical Module Volume (K) Forecast, by Application 2020 & 2033
- Table 41: France 200g Optical Module Revenue (million) Forecast, by Application 2020 & 2033
- Table 42: France 200g Optical Module Volume (K) Forecast, by Application 2020 & 2033
- Table 43: Italy 200g Optical Module Revenue (million) Forecast, by Application 2020 & 2033
- Table 44: Italy 200g Optical Module Volume (K) Forecast, by Application 2020 & 2033
- Table 45: Spain 200g Optical Module Revenue (million) Forecast, by Application 2020 & 2033
- Table 46: Spain 200g Optical Module Volume (K) Forecast, by Application 2020 & 2033
- Table 47: Russia 200g Optical Module Revenue (million) Forecast, by Application 2020 & 2033
- Table 48: Russia 200g Optical Module Volume (K) Forecast, by Application 2020 & 2033
- Table 49: Benelux 200g Optical Module Revenue (million) Forecast, by Application 2020 & 2033
- Table 50: Benelux 200g Optical Module Volume (K) Forecast, by Application 2020 & 2033
- Table 51: Nordics 200g Optical Module Revenue (million) Forecast, by Application 2020 & 2033
- Table 52: Nordics 200g Optical Module Volume (K) Forecast, by Application 2020 & 2033
- Table 53: Rest of Europe 200g Optical Module Revenue (million) Forecast, by Application 2020 & 2033
- Table 54: Rest of Europe 200g Optical Module Volume (K) Forecast, by Application 2020 & 2033
- Table 55: Global 200g Optical Module Revenue million Forecast, by Application 2020 & 2033
- Table 56: Global 200g Optical Module Volume K Forecast, by Application 2020 & 2033
- Table 57: Global 200g Optical Module Revenue million Forecast, by Type 2020 & 2033
- Table 58: Global 200g Optical Module Volume K Forecast, by Type 2020 & 2033
- Table 59: Global 200g Optical Module Revenue million Forecast, by Country 2020 & 2033
- Table 60: Global 200g Optical Module Volume K Forecast, by Country 2020 & 2033
- Table 61: Turkey 200g Optical Module Revenue (million) Forecast, by Application 2020 & 2033
- Table 62: Turkey 200g Optical Module Volume (K) Forecast, by Application 2020 & 2033
- Table 63: Israel 200g Optical Module Revenue (million) Forecast, by Application 2020 & 2033
- Table 64: Israel 200g Optical Module Volume (K) Forecast, by Application 2020 & 2033
- Table 65: GCC 200g Optical Module Revenue (million) Forecast, by Application 2020 & 2033
- Table 66: GCC 200g Optical Module Volume (K) Forecast, by Application 2020 & 2033
- Table 67: North Africa 200g Optical Module Revenue (million) Forecast, by Application 2020 & 2033
- Table 68: North Africa 200g Optical Module Volume (K) Forecast, by Application 2020 & 2033
- Table 69: South Africa 200g Optical Module Revenue (million) Forecast, by Application 2020 & 2033
- Table 70: South Africa 200g Optical Module Volume (K) Forecast, by Application 2020 & 2033
- Table 71: Rest of Middle East & Africa 200g Optical Module Revenue (million) Forecast, by Application 2020 & 2033
- Table 72: Rest of Middle East & Africa 200g Optical Module Volume (K) Forecast, by Application 2020 & 2033
- Table 73: Global 200g Optical Module Revenue million Forecast, by Application 2020 & 2033
- Table 74: Global 200g Optical Module Volume K Forecast, by Application 2020 & 2033
- Table 75: Global 200g Optical Module Revenue million Forecast, by Type 2020 & 2033
- Table 76: Global 200g Optical Module Volume K Forecast, by Type 2020 & 2033
- Table 77: Global 200g Optical Module Revenue million Forecast, by Country 2020 & 2033
- Table 78: Global 200g Optical Module Volume K Forecast, by Country 2020 & 2033
- Table 79: China 200g Optical Module Revenue (million) Forecast, by Application 2020 & 2033
- Table 80: China 200g Optical Module Volume (K) Forecast, by Application 2020 & 2033
- Table 81: India 200g Optical Module Revenue (million) Forecast, by Application 2020 & 2033
- Table 82: India 200g Optical Module Volume (K) Forecast, by Application 2020 & 2033
- Table 83: Japan 200g Optical Module Revenue (million) Forecast, by Application 2020 & 2033
- Table 84: Japan 200g Optical Module Volume (K) Forecast, by Application 2020 & 2033
- Table 85: South Korea 200g Optical Module Revenue (million) Forecast, by Application 2020 & 2033
- Table 86: South Korea 200g Optical Module Volume (K) Forecast, by Application 2020 & 2033
- Table 87: ASEAN 200g Optical Module Revenue (million) Forecast, by Application 2020 & 2033
- Table 88: ASEAN 200g Optical Module Volume (K) Forecast, by Application 2020 & 2033
- Table 89: Oceania 200g Optical Module Revenue (million) Forecast, by Application 2020 & 2033
- Table 90: Oceania 200g Optical Module Volume (K) Forecast, by Application 2020 & 2033
- Table 91: Rest of Asia Pacific 200g Optical Module Revenue (million) Forecast, by Application 2020 & 2033
- Table 92: Rest of Asia Pacific 200g Optical Module Volume (K) Forecast, by Application 2020 & 2033
Frequently Asked Questions
1. What is the projected Compound Annual Growth Rate (CAGR) of the 200g Optical Module?
The projected CAGR is approximately 9.1%.
2. Which companies are prominent players in the 200g Optical Module?
Key companies in the market include Coherent, InnoLight, Cisco, Huawei, Accelink, Hisense, Eoptolink, HGG, Intel, Source Photonics, Kyocera, Broadcom, Sumitomo Electric Industries, Gigalight, ATOP Technology, FIBERSTAMP, FOIT, Lumentum, AOI, Fujitsu, CIGTECH, Broadex Technologies, Guangdong Unionman.
3. What are the main segments of the 200g Optical Module?
The market segments include Application, Type.
4. Can you provide details about the market size?
The market size is estimated to be USD 5245 million as of 2022.
5. What are some drivers contributing to market growth?
N/A
6. What are the notable trends driving market growth?
N/A
7. Are there any restraints impacting market growth?
N/A
8. Can you provide examples of recent developments in the market?
N/A
9. What pricing options are available for accessing the report?
Pricing options include single-user, multi-user, and enterprise licenses priced at USD 3950.00, USD 5925.00, and USD 7900.00 respectively.
10. Is the market size provided in terms of value or volume?
The market size is provided in terms of value, measured in million and volume, measured in K.
11. Are there any specific market keywords associated with the report?
Yes, the market keyword associated with the report is "200g Optical Module," which aids in identifying and referencing the specific market segment covered.
12. How do I determine which pricing option suits my needs best?
The pricing options vary based on user requirements and access needs. Individual users may opt for single-user licenses, while businesses requiring broader access may choose multi-user or enterprise licenses for cost-effective access to the report.
13. Are there any additional resources or data provided in the 200g Optical Module report?
While the report offers comprehensive insights, it's advisable to review the specific contents or supplementary materials provided to ascertain if additional resources or data are available.
14. How can I stay updated on further developments or reports in the 200g Optical Module?
To stay informed about further developments, trends, and reports in the 200g Optical Module, consider subscribing to industry newsletters, following relevant companies and organizations, or regularly checking reputable industry news sources and publications.
Methodology
Step 1 - Identification of Relevant Samples Size from Population Database


Step 2 - Approaches for Defining Global Market Size (Value, Volume* & Price*)

Note*: In applicable scenarios
Step 3 - Data Sources
Primary Research
- Web Analytics
- Survey Reports
- Research Institute
- Latest Research Reports
- Opinion Leaders
Secondary Research
- Annual Reports
- White Paper
- Latest Press Release
- Industry Association
- Paid Database
- Investor Presentations

Step 4 - Data Triangulation
Involves using different sources of information in order to increase the validity of a study
These sources are likely to be stakeholders in a program - participants, other researchers, program staff, other community members, and so on.
Then we put all data in single framework & apply various statistical tools to find out the dynamic on the market.
During the analysis stage, feedback from the stakeholder groups would be compared to determine areas of agreement as well as areas of divergence