

Key Insights
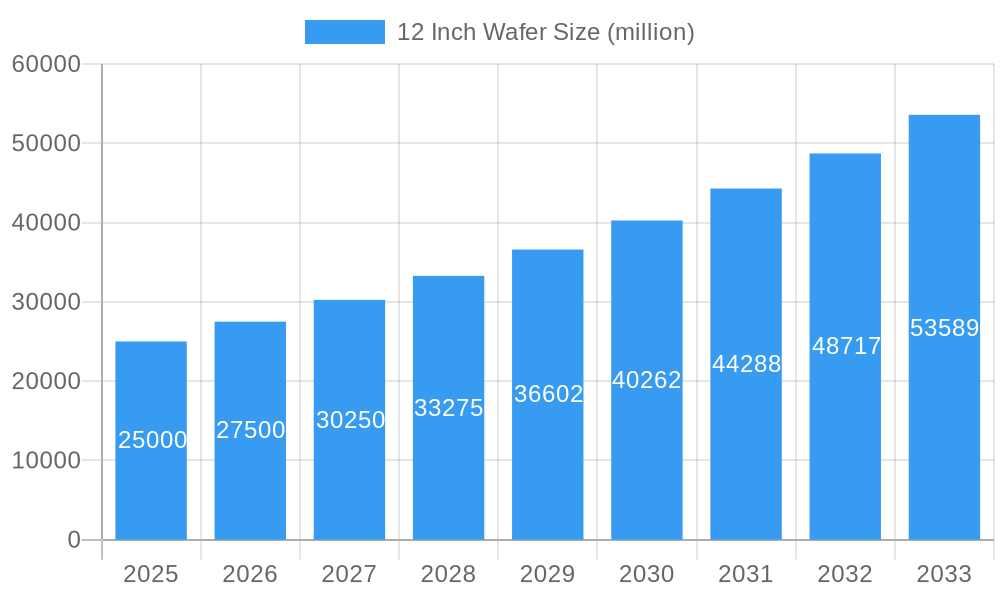
The 12-inch wafer market is projected to reach $14.96 billion by 2029, exhibiting a Compound Annual Growth Rate (CAGR) of 8.7% from a base year of 2024. This expansion is fueled by escalating demand for advanced semiconductors in consumer electronics and enterprise solutions. Key growth drivers include sophisticated smartphones with integrated AI, evolving PC performance requirements, and the expanding Services segment encompassing wafer fabrication, testing, and packaging. Furthermore, the increasing need for high-performance computing, data centers, and Internet of Things (IoT) devices necessitates advanced semiconductor components.
12 Inch Wafer Market Size (In Billion)
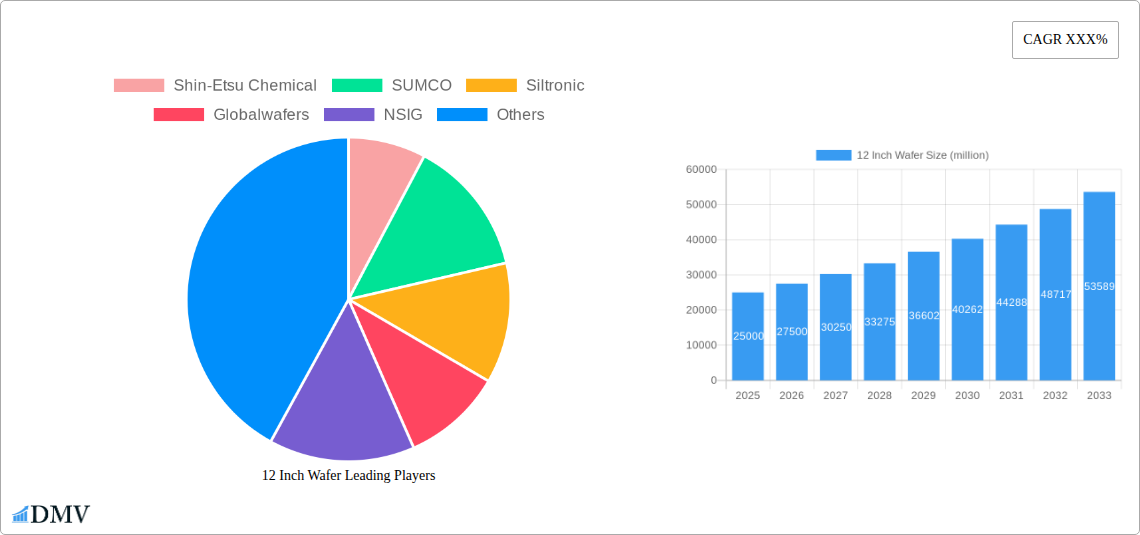
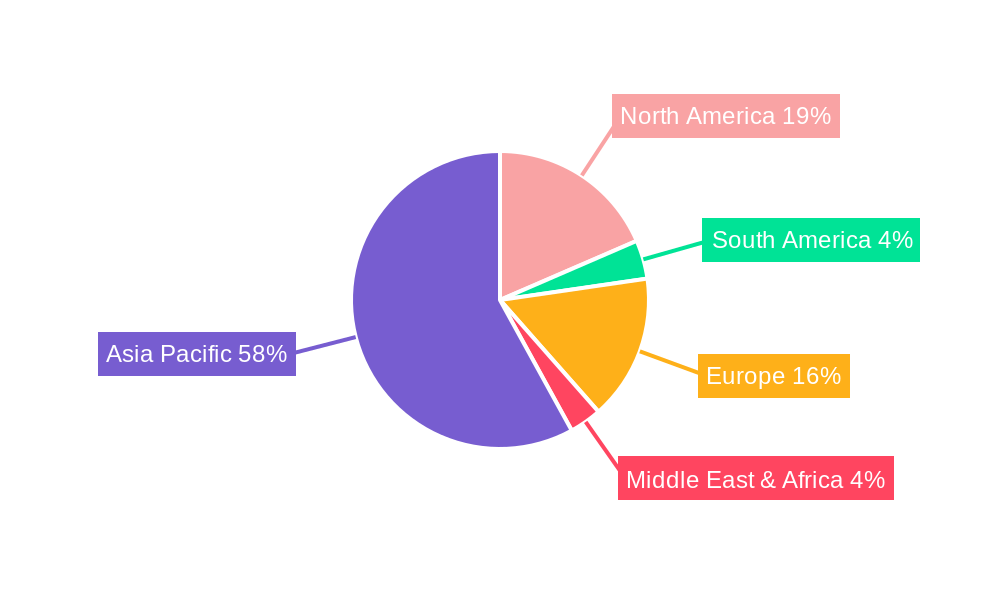
Market dynamics are shifting towards Prime Grade wafers due to stringent quality demands in leading-edge semiconductor manufacturing. While Test Grade and Reclaim Grade wafers serve specific production and recycling needs, Prime Grade dominates in volume and value. Geographically, the Asia Pacific region, led by China, is a significant growth hub for both consumption and manufacturing. North America and Europe focus on strategic investments and specialized production. Leading players such as Shin-Etsu Chemical, SUMCO, Siltronic, and GlobalWafers are engaged in competitive strategies and innovation, alongside emerging Chinese players. Challenges include high capital expenditure for advanced facilities and global supply chain volatilities affecting raw material availability and pricing.
12 Inch Wafer Company Market Share
This report offers an in-depth analysis of the 12-inch wafer market, including its size, growth, and forecast.
12 Inch Wafer Market Composition & Trends
This comprehensive report delves into the intricate 12 inch wafer market composition and evolving trends, offering a granular view of the semiconductor industry's backbone. We meticulously evaluate market concentration, identifying dominant players and their strategic maneuvers. Innovation catalysts, including advancements in lithography, epitaxy, and wafer polishing, are thoroughly explored, highlighting their impact on silicon wafer manufacturing. The dynamic regulatory landscapes across key semiconductor hubs, alongside the influence of substitute products like compound semiconductor wafers for specific niche applications, are analyzed. End-user profiles, spanning critical sectors like smartphone chip manufacturing, PC component production, and the burgeoning semiconductor services sector, are profiled in detail. A significant focus is placed on Mergers & Acquisitions (M&A) activities, revealing consolidation strategies and investment patterns that are reshaping the competitive arena.
- Market Share Distribution: Analysis of leading companies including Shin-Etsu Chemical, SUMCO, Siltronic, GlobalWafers, NSIG, AST, ESWIN, CCMC, Zhonghuan Semiconductor, and SK Siltron.
- M&A Deal Values: Quantification of significant investment and acquisition activities driving market consolidation.
- Innovation Catalysts: Detailed examination of R&D spending and its correlation with new product introductions.
- Regulatory Impact: Assessment of governmental policies and incentives influencing wafer production and R&D.
12 Inch Wafer Industry Evolution
The 12 inch wafer industry is witnessing an unprecedented evolution, driven by relentless technological innovation and escalating demand for advanced semiconductor devices. This report charts the industry's growth trajectory from 2019 to 2033, with a deep dive into the base year of 2025 and a detailed forecast period from 2025 to 2033. We analyze how advancements in silicon wafer technology, particularly in wafer diameter scaling, have enabled significant cost reductions and performance enhancements for integrated circuits. Shifting consumer demands for more powerful and energy-efficient electronic devices, from next-generation smartphones to high-performance computing systems, are directly fueling the expansion of the 12 inch wafer market. The adoption of Prime Grade wafers for leading-edge logic and memory chips, alongside the strategic use of Test Grade wafers for quality assurance and Reclaim Grade wafers for cost-effective solutions in less demanding applications, are meticulously detailed. Growth rates in wafer production capacity and the increasing complexity of semiconductor manufacturing processes are key metrics explored.
Leading Regions, Countries, or Segments in 12 Inch Wafer
This section pinpoints the dominant forces within the global 12 inch wafer market, analyzing key regions, countries, and specific application segments. Our analysis highlights the critical role of Application categories such as Smartphone, PC, and Services, each exhibiting unique growth drivers and demands for wafer types. The report scrutinizes the market dominance of Type segments, particularly the strategic importance of Prime Grade wafers for cutting-edge semiconductor manufacturing, the essential role of Test Grade wafers in ensuring product quality, and the growing relevance of Reclaim Grade wafers for sustainable and cost-effective solutions. We identify leading countries and regions propelled by substantial investment trends, robust regulatory support for the semiconductor industry, and significant domestic demand for advanced electronics.
- Dominant Regions: In-depth analysis of Asia Pacific's leadership, driven by its manufacturing prowess and extensive consumer electronics market.
- Key Country Investments: Exploration of national initiatives and foreign direct investment in silicon wafer fabrication facilities within leading semiconductor nations.
- Application Segment Drivers:
- Smartphone: Surging demand for advanced mobile processors, AI capabilities, and 5G integration requiring high-performance wafers.
- PC: Growth in high-end gaming, professional workstations, and the increasing adoption of AI-accelerated computing.
- Services: Expansion of semiconductor manufacturing services (foundries) and testing facilities, requiring a consistent supply of wafers.
- Wafer Type Significance:
- Prime Grade: Critical for leading-edge foundries producing high-density logic and memory chips.
- Test Grade: Essential for rigorous quality control and yield optimization processes.
- Reclaim Grade: Growing adoption in automotive, IoT, and less critical applications for cost savings and sustainability.
12 Inch Wafer Product Innovations
The 12 inch wafer market is a hotbed of innovation, continuously pushing the boundaries of semiconductor performance and miniaturization. This report highlights groundbreaking product innovations, including advancements in wafer flatness, surface quality, and defect reduction, all critical for enabling next-generation integrated circuits. Unique selling propositions of next-generation wafers focus on ultra-low particle counts, enhanced thermal conductivity, and improved epitaxial layer uniformity. Technological advancements such as advanced epitaxy techniques for ultra-thin silicon layers and novel wafer bonding technologies are crucial for the development of stacked 3D architectures. These innovations directly contribute to the creation of smaller, faster, and more power-efficient chips essential for smartphones, advanced computing, and emerging AI applications. The performance metrics of these advanced wafers are rigorously examined.
Propelling Factors for 12 Inch Wafer Growth
The expansion of the 12 inch wafer market is propelled by a confluence of powerful technological, economic, and regulatory influences. Technological advancements, particularly in the continuous drive for smaller process nodes (e.g., sub-7nm) in semiconductor manufacturing, necessitate the use of larger and higher-quality wafers. Economically, the escalating demand for advanced electronics across various sectors, including consumer electronics, automotive, and data centers, creates a sustained need for high-volume wafer production. Regulatory support, such as government initiatives to boost domestic semiconductor manufacturing capabilities and R&D investments, further stimulates growth. The increasing adoption of AI, 5G, and IoT technologies are significant catalysts.
Obstacles in the 12 Inch Wafer Market
Despite robust growth, the 12 inch wafer market faces several significant obstacles. Regulatory challenges, including evolving environmental standards and trade restrictions, can impact production and supply chains. Supply chain disruptions, exacerbated by geopolitical tensions and material shortages, pose a constant threat to consistent wafer availability. Intense competitive pressures among established players and emerging manufacturers can lead to price volatility. Quantifiable impacts include extended lead times for critical wafer types and potential increases in manufacturing costs. The high capital expenditure required for advanced wafer fabrication facilities also presents a barrier to entry for new players.
Future Opportunities in 12 Inch Wafer
Emerging opportunities within the 12 inch wafer market are abundant, driven by ongoing technological shifts and evolving consumer trends. The burgeoning field of artificial intelligence and machine learning presents a substantial opportunity, as AI accelerators and specialized AI chips demand advanced wafer technologies. The continuous expansion of 5G infrastructure and the proliferation of IoT devices will further fuel demand for wafers used in communication and edge computing applications. The development of new wafer materials beyond traditional silicon, such as Gallium Nitride (GaN) and Silicon Carbide (SiC) for high-power applications, represents another significant avenue for growth and innovation. The increasing focus on sustainability also opens doors for advancements in wafer reclaim and recycling technologies.
Major Players in the 12 Inch Wafer Ecosystem
- Shin-Etsu Chemical
- SUMCO
- Siltronic
- GlobalWafers
- NSIG
- AST
- ESWIN
- CCMC
- Zhonghuan Semiconductor
- SK Siltron
Key Developments in 12 Inch Wafer Industry
- 2023: Significant investment announcements by major players to expand 12 inch wafer fabrication capacity globally, addressing anticipated demand surge.
- 2024: Introduction of next-generation Prime Grade wafers with enhanced flatness and reduced defectivity, enabling sub-3nm process nodes.
- 2024: Increased focus on sustainable manufacturing practices and development of advanced Reclaim Grade wafer processes.
- 2025: Expected ramp-up of new wafer fabrication plants in strategic regions to meet projected market growth.
- 2025: Potential for strategic partnerships and collaborations to accelerate R&D in advanced wafer materials and technologies.
Strategic 12 Inch Wafer Market Forecast
The 12 inch wafer market is poised for sustained robust growth, driven by the insatiable demand for advanced semiconductor solutions. Future opportunities lie in catering to the exponential growth of AI, 5G, and IoT applications, which require increasingly sophisticated and high-performance wafers. Innovations in wafer materials and manufacturing processes will unlock new market segments and enhance product capabilities. Strategic investments in capacity expansion and R&D will be crucial for market leaders to maintain their competitive edge. The market's future trajectory is fundamentally linked to the continued advancement of the global digital economy, making 12 inch wafers indispensable components for technological progress.
12 Inch Wafer Segmentation
-
1. Application
- 1.1. Smartphone
- 1.2. PC
- 1.3. Services
-
2. Type
- 2.1. Prime Grade
- 2.2. Test Grade
- 2.3. Reclaim Grade
12 Inch Wafer Segmentation By Geography
-
1. North America
- 1.1. United States
- 1.2. Canada
- 1.3. Mexico
-
2. South America
- 2.1. Brazil
- 2.2. Argentina
- 2.3. Rest of South America
-
3. Europe
- 3.1. United Kingdom
- 3.2. Germany
- 3.3. France
- 3.4. Italy
- 3.5. Spain
- 3.6. Russia
- 3.7. Benelux
- 3.8. Nordics
- 3.9. Rest of Europe
-
4. Middle East & Africa
- 4.1. Turkey
- 4.2. Israel
- 4.3. GCC
- 4.4. North Africa
- 4.5. South Africa
- 4.6. Rest of Middle East & Africa
-
5. Asia Pacific
- 5.1. China
- 5.2. India
- 5.3. Japan
- 5.4. South Korea
- 5.5. ASEAN
- 5.6. Oceania
- 5.7. Rest of Asia Pacific
12 Inch Wafer Regional Market Share
Geographic Coverage of 12 Inch Wafer
12 Inch Wafer REPORT HIGHLIGHTS
| Aspects | Details |
|---|---|
| Study Period | 2020-2034 |
| Base Year | 2025 |
| Estimated Year | 2026 |
| Forecast Period | 2026-2034 |
| Historical Period | 2020-2025 |
| Growth Rate | CAGR of 8.7% from 2020-2034 |
| Segmentation |
|
Table of Contents
- 1. Introduction
- 1.1. Research Scope
- 1.2. Market Segmentation
- 1.3. Research Objective
- 1.4. Definitions and Assumptions
- 2. Executive Summary
- 2.1. Market Snapshot
- 3. Market Dynamics
- 3.1. Market Drivers
- 3.2. Market Restrains
- 3.3. Market Trends
- 3.4. Market Opportunities
- 4. Market Factor Analysis
- 4.1. Porters Five Forces
- 4.1.1. Bargaining Power of Suppliers
- 4.1.2. Bargaining Power of Buyers
- 4.1.3. Threat of New Entrants
- 4.1.4. Threat of Substitutes
- 4.1.5. Competitive Rivalry
- 4.2. PESTEL analysis
- 4.3. BCG Analysis
- 4.3.1. Stars (High Growth, High Market Share)
- 4.3.2. Cash Cows (Low Growth, High Market Share)
- 4.3.3. Question Mark (High Growth, Low Market Share)
- 4.3.4. Dogs (Low Growth, Low Market Share)
- 4.4. Ansoff Matrix Analysis
- 4.5. Supply Chain Analysis
- 4.6. Regulatory Landscape
- 4.7. Current Market Potential and Opportunity Assessment (TAM–SAM–SOM Framework)
- 4.8. DMV Analyst Note
- 4.1. Porters Five Forces
- 5. Market Analysis, Insights and Forecast 2021-2033
- 5.1. Market Analysis, Insights and Forecast - by Application
- 5.1.1. Smartphone
- 5.1.2. PC
- 5.1.3. Services
- 5.2. Market Analysis, Insights and Forecast - by Type
- 5.2.1. Prime Grade
- 5.2.2. Test Grade
- 5.2.3. Reclaim Grade
- 5.3. Market Analysis, Insights and Forecast - by Region
- 5.3.1. North America
- 5.3.2. South America
- 5.3.3. Europe
- 5.3.4. Middle East & Africa
- 5.3.5. Asia Pacific
- 5.1. Market Analysis, Insights and Forecast - by Application
- 6. Global 12 Inch Wafer Analysis, Insights and Forecast, 2021-2033
- 6.1. Market Analysis, Insights and Forecast - by Application
- 6.1.1. Smartphone
- 6.1.2. PC
- 6.1.3. Services
- 6.2. Market Analysis, Insights and Forecast - by Type
- 6.2.1. Prime Grade
- 6.2.2. Test Grade
- 6.2.3. Reclaim Grade
- 6.1. Market Analysis, Insights and Forecast - by Application
- 7. North America 12 Inch Wafer Analysis, Insights and Forecast, 2020-2032
- 7.1. Market Analysis, Insights and Forecast - by Application
- 7.1.1. Smartphone
- 7.1.2. PC
- 7.1.3. Services
- 7.2. Market Analysis, Insights and Forecast - by Type
- 7.2.1. Prime Grade
- 7.2.2. Test Grade
- 7.2.3. Reclaim Grade
- 7.1. Market Analysis, Insights and Forecast - by Application
- 8. South America 12 Inch Wafer Analysis, Insights and Forecast, 2020-2032
- 8.1. Market Analysis, Insights and Forecast - by Application
- 8.1.1. Smartphone
- 8.1.2. PC
- 8.1.3. Services
- 8.2. Market Analysis, Insights and Forecast - by Type
- 8.2.1. Prime Grade
- 8.2.2. Test Grade
- 8.2.3. Reclaim Grade
- 8.1. Market Analysis, Insights and Forecast - by Application
- 9. Europe 12 Inch Wafer Analysis, Insights and Forecast, 2020-2032
- 9.1. Market Analysis, Insights and Forecast - by Application
- 9.1.1. Smartphone
- 9.1.2. PC
- 9.1.3. Services
- 9.2. Market Analysis, Insights and Forecast - by Type
- 9.2.1. Prime Grade
- 9.2.2. Test Grade
- 9.2.3. Reclaim Grade
- 9.1. Market Analysis, Insights and Forecast - by Application
- 10. Middle East & Africa 12 Inch Wafer Analysis, Insights and Forecast, 2020-2032
- 10.1. Market Analysis, Insights and Forecast - by Application
- 10.1.1. Smartphone
- 10.1.2. PC
- 10.1.3. Services
- 10.2. Market Analysis, Insights and Forecast - by Type
- 10.2.1. Prime Grade
- 10.2.2. Test Grade
- 10.2.3. Reclaim Grade
- 10.1. Market Analysis, Insights and Forecast - by Application
- 11. Asia Pacific 12 Inch Wafer Analysis, Insights and Forecast, 2020-2032
- 11.1. Market Analysis, Insights and Forecast - by Application
- 11.1.1. Smartphone
- 11.1.2. PC
- 11.1.3. Services
- 11.2. Market Analysis, Insights and Forecast - by Type
- 11.2.1. Prime Grade
- 11.2.2. Test Grade
- 11.2.3. Reclaim Grade
- 11.1. Market Analysis, Insights and Forecast - by Application
- 12. Competitive Analysis
- 12.1. Company Profiles
- 12.1.1 Shin-Etsu Chemical
- 12.1.1.1. Company Overview
- 12.1.1.2. Products
- 12.1.1.3. Company Financials
- 12.1.1.4. SWOT Analysis
- 12.1.2 SUMCO
- 12.1.2.1. Company Overview
- 12.1.2.2. Products
- 12.1.2.3. Company Financials
- 12.1.2.4. SWOT Analysis
- 12.1.3 Siltronic
- 12.1.3.1. Company Overview
- 12.1.3.2. Products
- 12.1.3.3. Company Financials
- 12.1.3.4. SWOT Analysis
- 12.1.4 Globalwafers
- 12.1.4.1. Company Overview
- 12.1.4.2. Products
- 12.1.4.3. Company Financials
- 12.1.4.4. SWOT Analysis
- 12.1.5 NSIG
- 12.1.5.1. Company Overview
- 12.1.5.2. Products
- 12.1.5.3. Company Financials
- 12.1.5.4. SWOT Analysis
- 12.1.6 AST
- 12.1.6.1. Company Overview
- 12.1.6.2. Products
- 12.1.6.3. Company Financials
- 12.1.6.4. SWOT Analysis
- 12.1.7 ESWIN
- 12.1.7.1. Company Overview
- 12.1.7.2. Products
- 12.1.7.3. Company Financials
- 12.1.7.4. SWOT Analysis
- 12.1.8 CCMC
- 12.1.8.1. Company Overview
- 12.1.8.2. Products
- 12.1.8.3. Company Financials
- 12.1.8.4. SWOT Analysis
- 12.1.9 Zhonghuan Semiconductor
- 12.1.9.1. Company Overview
- 12.1.9.2. Products
- 12.1.9.3. Company Financials
- 12.1.9.4. SWOT Analysis
- 12.1.10 SK Siltron
- 12.1.10.1. Company Overview
- 12.1.10.2. Products
- 12.1.10.3. Company Financials
- 12.1.10.4. SWOT Analysis
- 12.1.1 Shin-Etsu Chemical
- 12.2. Market Entropy
- 12.2.1 Company's Key Areas Served
- 12.2.2 Recent Developments
- 12.3. Company Market Share Analysis 2025
- 12.3.1 Top 5 Companies Market Share Analysis
- 12.3.2 Top 3 Companies Market Share Analysis
- 12.4. List of Potential Customers
- 13. Research Methodology
List of Figures
- Figure 1: Global 12 Inch Wafer Revenue Breakdown (billion, %) by Region 2025 & 2033
- Figure 2: Global 12 Inch Wafer Volume Breakdown (K, %) by Region 2025 & 2033
- Figure 3: North America 12 Inch Wafer Revenue (billion), by Application 2025 & 2033
- Figure 4: North America 12 Inch Wafer Volume (K), by Application 2025 & 2033
- Figure 5: North America 12 Inch Wafer Revenue Share (%), by Application 2025 & 2033
- Figure 6: North America 12 Inch Wafer Volume Share (%), by Application 2025 & 2033
- Figure 7: North America 12 Inch Wafer Revenue (billion), by Type 2025 & 2033
- Figure 8: North America 12 Inch Wafer Volume (K), by Type 2025 & 2033
- Figure 9: North America 12 Inch Wafer Revenue Share (%), by Type 2025 & 2033
- Figure 10: North America 12 Inch Wafer Volume Share (%), by Type 2025 & 2033
- Figure 11: North America 12 Inch Wafer Revenue (billion), by Country 2025 & 2033
- Figure 12: North America 12 Inch Wafer Volume (K), by Country 2025 & 2033
- Figure 13: North America 12 Inch Wafer Revenue Share (%), by Country 2025 & 2033
- Figure 14: North America 12 Inch Wafer Volume Share (%), by Country 2025 & 2033
- Figure 15: South America 12 Inch Wafer Revenue (billion), by Application 2025 & 2033
- Figure 16: South America 12 Inch Wafer Volume (K), by Application 2025 & 2033
- Figure 17: South America 12 Inch Wafer Revenue Share (%), by Application 2025 & 2033
- Figure 18: South America 12 Inch Wafer Volume Share (%), by Application 2025 & 2033
- Figure 19: South America 12 Inch Wafer Revenue (billion), by Type 2025 & 2033
- Figure 20: South America 12 Inch Wafer Volume (K), by Type 2025 & 2033
- Figure 21: South America 12 Inch Wafer Revenue Share (%), by Type 2025 & 2033
- Figure 22: South America 12 Inch Wafer Volume Share (%), by Type 2025 & 2033
- Figure 23: South America 12 Inch Wafer Revenue (billion), by Country 2025 & 2033
- Figure 24: South America 12 Inch Wafer Volume (K), by Country 2025 & 2033
- Figure 25: South America 12 Inch Wafer Revenue Share (%), by Country 2025 & 2033
- Figure 26: South America 12 Inch Wafer Volume Share (%), by Country 2025 & 2033
- Figure 27: Europe 12 Inch Wafer Revenue (billion), by Application 2025 & 2033
- Figure 28: Europe 12 Inch Wafer Volume (K), by Application 2025 & 2033
- Figure 29: Europe 12 Inch Wafer Revenue Share (%), by Application 2025 & 2033
- Figure 30: Europe 12 Inch Wafer Volume Share (%), by Application 2025 & 2033
- Figure 31: Europe 12 Inch Wafer Revenue (billion), by Type 2025 & 2033
- Figure 32: Europe 12 Inch Wafer Volume (K), by Type 2025 & 2033
- Figure 33: Europe 12 Inch Wafer Revenue Share (%), by Type 2025 & 2033
- Figure 34: Europe 12 Inch Wafer Volume Share (%), by Type 2025 & 2033
- Figure 35: Europe 12 Inch Wafer Revenue (billion), by Country 2025 & 2033
- Figure 36: Europe 12 Inch Wafer Volume (K), by Country 2025 & 2033
- Figure 37: Europe 12 Inch Wafer Revenue Share (%), by Country 2025 & 2033
- Figure 38: Europe 12 Inch Wafer Volume Share (%), by Country 2025 & 2033
- Figure 39: Middle East & Africa 12 Inch Wafer Revenue (billion), by Application 2025 & 2033
- Figure 40: Middle East & Africa 12 Inch Wafer Volume (K), by Application 2025 & 2033
- Figure 41: Middle East & Africa 12 Inch Wafer Revenue Share (%), by Application 2025 & 2033
- Figure 42: Middle East & Africa 12 Inch Wafer Volume Share (%), by Application 2025 & 2033
- Figure 43: Middle East & Africa 12 Inch Wafer Revenue (billion), by Type 2025 & 2033
- Figure 44: Middle East & Africa 12 Inch Wafer Volume (K), by Type 2025 & 2033
- Figure 45: Middle East & Africa 12 Inch Wafer Revenue Share (%), by Type 2025 & 2033
- Figure 46: Middle East & Africa 12 Inch Wafer Volume Share (%), by Type 2025 & 2033
- Figure 47: Middle East & Africa 12 Inch Wafer Revenue (billion), by Country 2025 & 2033
- Figure 48: Middle East & Africa 12 Inch Wafer Volume (K), by Country 2025 & 2033
- Figure 49: Middle East & Africa 12 Inch Wafer Revenue Share (%), by Country 2025 & 2033
- Figure 50: Middle East & Africa 12 Inch Wafer Volume Share (%), by Country 2025 & 2033
- Figure 51: Asia Pacific 12 Inch Wafer Revenue (billion), by Application 2025 & 2033
- Figure 52: Asia Pacific 12 Inch Wafer Volume (K), by Application 2025 & 2033
- Figure 53: Asia Pacific 12 Inch Wafer Revenue Share (%), by Application 2025 & 2033
- Figure 54: Asia Pacific 12 Inch Wafer Volume Share (%), by Application 2025 & 2033
- Figure 55: Asia Pacific 12 Inch Wafer Revenue (billion), by Type 2025 & 2033
- Figure 56: Asia Pacific 12 Inch Wafer Volume (K), by Type 2025 & 2033
- Figure 57: Asia Pacific 12 Inch Wafer Revenue Share (%), by Type 2025 & 2033
- Figure 58: Asia Pacific 12 Inch Wafer Volume Share (%), by Type 2025 & 2033
- Figure 59: Asia Pacific 12 Inch Wafer Revenue (billion), by Country 2025 & 2033
- Figure 60: Asia Pacific 12 Inch Wafer Volume (K), by Country 2025 & 2033
- Figure 61: Asia Pacific 12 Inch Wafer Revenue Share (%), by Country 2025 & 2033
- Figure 62: Asia Pacific 12 Inch Wafer Volume Share (%), by Country 2025 & 2033
List of Tables
- Table 1: Global 12 Inch Wafer Revenue billion Forecast, by Application 2020 & 2033
- Table 2: Global 12 Inch Wafer Volume K Forecast, by Application 2020 & 2033
- Table 3: Global 12 Inch Wafer Revenue billion Forecast, by Type 2020 & 2033
- Table 4: Global 12 Inch Wafer Volume K Forecast, by Type 2020 & 2033
- Table 5: Global 12 Inch Wafer Revenue billion Forecast, by Region 2020 & 2033
- Table 6: Global 12 Inch Wafer Volume K Forecast, by Region 2020 & 2033
- Table 7: Global 12 Inch Wafer Revenue billion Forecast, by Application 2020 & 2033
- Table 8: Global 12 Inch Wafer Volume K Forecast, by Application 2020 & 2033
- Table 9: Global 12 Inch Wafer Revenue billion Forecast, by Type 2020 & 2033
- Table 10: Global 12 Inch Wafer Volume K Forecast, by Type 2020 & 2033
- Table 11: Global 12 Inch Wafer Revenue billion Forecast, by Country 2020 & 2033
- Table 12: Global 12 Inch Wafer Volume K Forecast, by Country 2020 & 2033
- Table 13: United States 12 Inch Wafer Revenue (billion) Forecast, by Application 2020 & 2033
- Table 14: United States 12 Inch Wafer Volume (K) Forecast, by Application 2020 & 2033
- Table 15: Canada 12 Inch Wafer Revenue (billion) Forecast, by Application 2020 & 2033
- Table 16: Canada 12 Inch Wafer Volume (K) Forecast, by Application 2020 & 2033
- Table 17: Mexico 12 Inch Wafer Revenue (billion) Forecast, by Application 2020 & 2033
- Table 18: Mexico 12 Inch Wafer Volume (K) Forecast, by Application 2020 & 2033
- Table 19: Global 12 Inch Wafer Revenue billion Forecast, by Application 2020 & 2033
- Table 20: Global 12 Inch Wafer Volume K Forecast, by Application 2020 & 2033
- Table 21: Global 12 Inch Wafer Revenue billion Forecast, by Type 2020 & 2033
- Table 22: Global 12 Inch Wafer Volume K Forecast, by Type 2020 & 2033
- Table 23: Global 12 Inch Wafer Revenue billion Forecast, by Country 2020 & 2033
- Table 24: Global 12 Inch Wafer Volume K Forecast, by Country 2020 & 2033
- Table 25: Brazil 12 Inch Wafer Revenue (billion) Forecast, by Application 2020 & 2033
- Table 26: Brazil 12 Inch Wafer Volume (K) Forecast, by Application 2020 & 2033
- Table 27: Argentina 12 Inch Wafer Revenue (billion) Forecast, by Application 2020 & 2033
- Table 28: Argentina 12 Inch Wafer Volume (K) Forecast, by Application 2020 & 2033
- Table 29: Rest of South America 12 Inch Wafer Revenue (billion) Forecast, by Application 2020 & 2033
- Table 30: Rest of South America 12 Inch Wafer Volume (K) Forecast, by Application 2020 & 2033
- Table 31: Global 12 Inch Wafer Revenue billion Forecast, by Application 2020 & 2033
- Table 32: Global 12 Inch Wafer Volume K Forecast, by Application 2020 & 2033
- Table 33: Global 12 Inch Wafer Revenue billion Forecast, by Type 2020 & 2033
- Table 34: Global 12 Inch Wafer Volume K Forecast, by Type 2020 & 2033
- Table 35: Global 12 Inch Wafer Revenue billion Forecast, by Country 2020 & 2033
- Table 36: Global 12 Inch Wafer Volume K Forecast, by Country 2020 & 2033
- Table 37: United Kingdom 12 Inch Wafer Revenue (billion) Forecast, by Application 2020 & 2033
- Table 38: United Kingdom 12 Inch Wafer Volume (K) Forecast, by Application 2020 & 2033
- Table 39: Germany 12 Inch Wafer Revenue (billion) Forecast, by Application 2020 & 2033
- Table 40: Germany 12 Inch Wafer Volume (K) Forecast, by Application 2020 & 2033
- Table 41: France 12 Inch Wafer Revenue (billion) Forecast, by Application 2020 & 2033
- Table 42: France 12 Inch Wafer Volume (K) Forecast, by Application 2020 & 2033
- Table 43: Italy 12 Inch Wafer Revenue (billion) Forecast, by Application 2020 & 2033
- Table 44: Italy 12 Inch Wafer Volume (K) Forecast, by Application 2020 & 2033
- Table 45: Spain 12 Inch Wafer Revenue (billion) Forecast, by Application 2020 & 2033
- Table 46: Spain 12 Inch Wafer Volume (K) Forecast, by Application 2020 & 2033
- Table 47: Russia 12 Inch Wafer Revenue (billion) Forecast, by Application 2020 & 2033
- Table 48: Russia 12 Inch Wafer Volume (K) Forecast, by Application 2020 & 2033
- Table 49: Benelux 12 Inch Wafer Revenue (billion) Forecast, by Application 2020 & 2033
- Table 50: Benelux 12 Inch Wafer Volume (K) Forecast, by Application 2020 & 2033
- Table 51: Nordics 12 Inch Wafer Revenue (billion) Forecast, by Application 2020 & 2033
- Table 52: Nordics 12 Inch Wafer Volume (K) Forecast, by Application 2020 & 2033
- Table 53: Rest of Europe 12 Inch Wafer Revenue (billion) Forecast, by Application 2020 & 2033
- Table 54: Rest of Europe 12 Inch Wafer Volume (K) Forecast, by Application 2020 & 2033
- Table 55: Global 12 Inch Wafer Revenue billion Forecast, by Application 2020 & 2033
- Table 56: Global 12 Inch Wafer Volume K Forecast, by Application 2020 & 2033
- Table 57: Global 12 Inch Wafer Revenue billion Forecast, by Type 2020 & 2033
- Table 58: Global 12 Inch Wafer Volume K Forecast, by Type 2020 & 2033
- Table 59: Global 12 Inch Wafer Revenue billion Forecast, by Country 2020 & 2033
- Table 60: Global 12 Inch Wafer Volume K Forecast, by Country 2020 & 2033
- Table 61: Turkey 12 Inch Wafer Revenue (billion) Forecast, by Application 2020 & 2033
- Table 62: Turkey 12 Inch Wafer Volume (K) Forecast, by Application 2020 & 2033
- Table 63: Israel 12 Inch Wafer Revenue (billion) Forecast, by Application 2020 & 2033
- Table 64: Israel 12 Inch Wafer Volume (K) Forecast, by Application 2020 & 2033
- Table 65: GCC 12 Inch Wafer Revenue (billion) Forecast, by Application 2020 & 2033
- Table 66: GCC 12 Inch Wafer Volume (K) Forecast, by Application 2020 & 2033
- Table 67: North Africa 12 Inch Wafer Revenue (billion) Forecast, by Application 2020 & 2033
- Table 68: North Africa 12 Inch Wafer Volume (K) Forecast, by Application 2020 & 2033
- Table 69: South Africa 12 Inch Wafer Revenue (billion) Forecast, by Application 2020 & 2033
- Table 70: South Africa 12 Inch Wafer Volume (K) Forecast, by Application 2020 & 2033
- Table 71: Rest of Middle East & Africa 12 Inch Wafer Revenue (billion) Forecast, by Application 2020 & 2033
- Table 72: Rest of Middle East & Africa 12 Inch Wafer Volume (K) Forecast, by Application 2020 & 2033
- Table 73: Global 12 Inch Wafer Revenue billion Forecast, by Application 2020 & 2033
- Table 74: Global 12 Inch Wafer Volume K Forecast, by Application 2020 & 2033
- Table 75: Global 12 Inch Wafer Revenue billion Forecast, by Type 2020 & 2033
- Table 76: Global 12 Inch Wafer Volume K Forecast, by Type 2020 & 2033
- Table 77: Global 12 Inch Wafer Revenue billion Forecast, by Country 2020 & 2033
- Table 78: Global 12 Inch Wafer Volume K Forecast, by Country 2020 & 2033
- Table 79: China 12 Inch Wafer Revenue (billion) Forecast, by Application 2020 & 2033
- Table 80: China 12 Inch Wafer Volume (K) Forecast, by Application 2020 & 2033
- Table 81: India 12 Inch Wafer Revenue (billion) Forecast, by Application 2020 & 2033
- Table 82: India 12 Inch Wafer Volume (K) Forecast, by Application 2020 & 2033
- Table 83: Japan 12 Inch Wafer Revenue (billion) Forecast, by Application 2020 & 2033
- Table 84: Japan 12 Inch Wafer Volume (K) Forecast, by Application 2020 & 2033
- Table 85: South Korea 12 Inch Wafer Revenue (billion) Forecast, by Application 2020 & 2033
- Table 86: South Korea 12 Inch Wafer Volume (K) Forecast, by Application 2020 & 2033
- Table 87: ASEAN 12 Inch Wafer Revenue (billion) Forecast, by Application 2020 & 2033
- Table 88: ASEAN 12 Inch Wafer Volume (K) Forecast, by Application 2020 & 2033
- Table 89: Oceania 12 Inch Wafer Revenue (billion) Forecast, by Application 2020 & 2033
- Table 90: Oceania 12 Inch Wafer Volume (K) Forecast, by Application 2020 & 2033
- Table 91: Rest of Asia Pacific 12 Inch Wafer Revenue (billion) Forecast, by Application 2020 & 2033
- Table 92: Rest of Asia Pacific 12 Inch Wafer Volume (K) Forecast, by Application 2020 & 2033
Frequently Asked Questions
1. What is the projected Compound Annual Growth Rate (CAGR) of the 12 Inch Wafer?
The projected CAGR is approximately 8.7%.
2. Which companies are prominent players in the 12 Inch Wafer?
Key companies in the market include Shin-Etsu Chemical, SUMCO, Siltronic, Globalwafers, NSIG, AST, ESWIN, CCMC, Zhonghuan Semiconductor, SK Siltron.
3. What are the main segments of the 12 Inch Wafer?
The market segments include Application, Type.
4. Can you provide details about the market size?
The market size is estimated to be USD 14.96 billion as of 2022.
5. What are some drivers contributing to market growth?
N/A
6. What are the notable trends driving market growth?
N/A
7. Are there any restraints impacting market growth?
N/A
8. Can you provide examples of recent developments in the market?
N/A
9. What pricing options are available for accessing the report?
Pricing options include single-user, multi-user, and enterprise licenses priced at USD 3950.00, USD 5925.00, and USD 7900.00 respectively.
10. Is the market size provided in terms of value or volume?
The market size is provided in terms of value, measured in billion and volume, measured in K.
11. Are there any specific market keywords associated with the report?
Yes, the market keyword associated with the report is "12 Inch Wafer," which aids in identifying and referencing the specific market segment covered.
12. How do I determine which pricing option suits my needs best?
The pricing options vary based on user requirements and access needs. Individual users may opt for single-user licenses, while businesses requiring broader access may choose multi-user or enterprise licenses for cost-effective access to the report.
13. Are there any additional resources or data provided in the 12 Inch Wafer report?
While the report offers comprehensive insights, it's advisable to review the specific contents or supplementary materials provided to ascertain if additional resources or data are available.
14. How can I stay updated on further developments or reports in the 12 Inch Wafer?
To stay informed about further developments, trends, and reports in the 12 Inch Wafer, consider subscribing to industry newsletters, following relevant companies and organizations, or regularly checking reputable industry news sources and publications.
Methodology
Step 1 - Identification of Relevant Samples Size from Population Database


Step 2 - Approaches for Defining Global Market Size (Value, Volume* & Price*)

Note*: In applicable scenarios
Step 3 - Data Sources
Primary Research
- Web Analytics
- Survey Reports
- Research Institute
- Latest Research Reports
- Opinion Leaders
Secondary Research
- Annual Reports
- White Paper
- Latest Press Release
- Industry Association
- Paid Database
- Investor Presentations

Step 4 - Data Triangulation
Involves using different sources of information in order to increase the validity of a study
These sources are likely to be stakeholders in a program - participants, other researchers, program staff, other community members, and so on.
Then we put all data in single framework & apply various statistical tools to find out the dynamic on the market.
During the analysis stage, feedback from the stakeholder groups would be compared to determine areas of agreement as well as areas of divergence