

Key Insights
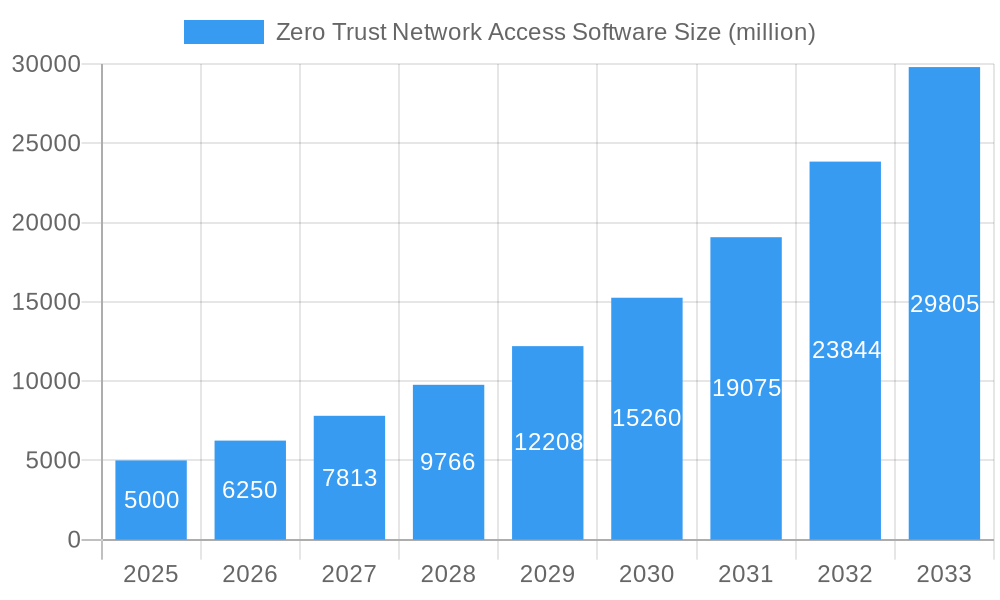
The Zero Trust Network Access (ZTNA) software market is experiencing robust growth, driven by the increasing adoption of remote work models, heightened cybersecurity threats, and the need for secure access to applications and data across diverse environments. The market, estimated at $5 billion in 2025, is projected to exhibit a Compound Annual Growth Rate (CAGR) of approximately 25% between 2025 and 2033, reaching an estimated market value exceeding $20 billion by 2033. This expansion is fueled by several key factors, including the rising prevalence of cloud-based applications, the growing sophistication of cyberattacks targeting remote workforces, and the increasing regulatory pressure on organizations to enhance their data security posture. Major players like Cisco, Palo Alto Networks, and Zscaler are aggressively competing in this space, driving innovation and expanding ZTNA capabilities. The market is segmented by deployment model (cloud, on-premise), organization size (SMBs, enterprises), and vertical industry (finance, healthcare, etc.), offering diverse opportunities for vendors. While the high initial investment cost can pose a restraint for some organizations, the long-term security and cost-effectiveness benefits are driving widespread adoption.
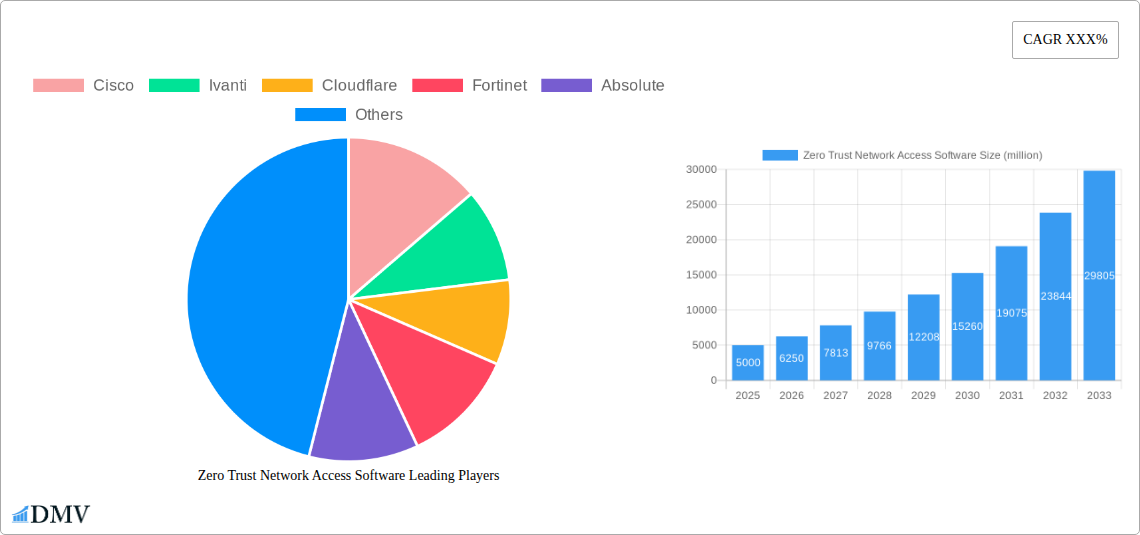
Zero Trust Network Access Software Market Size (In Billion)
The competitive landscape is fiercely contested, with established cybersecurity vendors and emerging players vying for market share. Strategic partnerships, mergers and acquisitions, and continuous product innovation are key strategies employed by leading vendors to maintain a competitive edge. The market is expected to see further consolidation in the coming years, driven by increasing demand for comprehensive security solutions that integrate ZTNA with other security technologies. Future growth will depend on the development of more advanced features, including AI-powered threat detection, improved integration with existing security infrastructure, and support for a wider range of devices and applications. The increasing adoption of secure access service edge (SASE) architectures, which combine ZTNA with other network security functions, is also expected to significantly contribute to the market's growth trajectory.
Zero Trust Network Access Software Company Market Share
Zero Trust Network Access (ZTNA) Software Market Report: 2019-2033
This comprehensive report provides an in-depth analysis of the Zero Trust Network Access (ZTNA) software market, projecting a multi-million-dollar valuation by 2033. The study covers the historical period (2019-2024), the base year (2025), and forecasts the market's trajectory from 2025 to 2033. Key players like Cisco, Ivanti, Cloudflare, and Zscaler are meticulously examined, offering valuable insights for stakeholders seeking to navigate this rapidly evolving landscape.
Zero Trust Network Access Software Market Composition & Trends
This section delves into the competitive dynamics of the ZTNA software market, examining market concentration, innovation drivers, regulatory impacts, and the role of mergers and acquisitions (M&A). The report analyzes the market share distribution among leading vendors, revealing the dominance of a few key players while also highlighting the emergence of innovative newcomers.
- Market Concentration: The ZTNA market shows a moderately concentrated landscape in 2025, with the top 5 vendors holding approximately 60% of the market share. This is expected to slightly consolidate by 2033, with the top 3 players potentially capturing over 70%.
- Innovation Catalysts: Increased adoption of cloud-based services, the rising prevalence of remote work, and escalating cybersecurity threats are major drivers of innovation. The development of AI-powered threat detection and advanced authentication methods are shaping the market.
- Regulatory Landscape: GDPR, CCPA, and other data privacy regulations are influencing the ZTNA market by pushing companies to adopt more robust security measures. This leads to increased demand for ZTNA solutions that comply with these regulations.
- Substitute Products: While traditional VPNs remain a substitute, their limitations in terms of security and scalability are driving migration toward ZTNA. This shift is fueled by the increasing need for granular access control and robust security posture.
- End-User Profiles: Large enterprises and government organizations are the primary adopters of ZTNA solutions due to their sophisticated security requirements and extensive IT infrastructures. However, SMEs are increasingly adopting ZTNA solutions due to the increased affordability and ease of implementation of cloud-based solutions.
- M&A Activities: The ZTNA market has witnessed significant M&A activity in the past few years, with several large players acquiring smaller companies to expand their product portfolios and technological capabilities. The total value of M&A deals in the period 2019-2024 is estimated at $xx million.
Zero Trust Network Access Software Industry Evolution
The ZTNA software market is experiencing exponential growth, driven by several key factors. From 2019 to 2024, the market grew at a Compound Annual Growth Rate (CAGR) of xx%, reaching a value of $xx million in 2024. This strong growth is projected to continue, with a forecasted CAGR of xx% from 2025 to 2033, reaching a value of $xx million by 2033. This growth is fueled by several factors including a rising number of cyber threats, increasing remote workforces and expanding adoption of cloud services across various industries. The increasing sophistication of cyberattacks necessitates the adoption of more robust security measures, and ZTNA solutions offer a more comprehensive approach compared to traditional network security methods. Further, the industry is witnessing significant technological advancements with the integration of AI/ML into ZTNA platforms improving security and automation capabilities. Consumer demand is also shifting towards flexible, scalable, and easy-to-manage solutions driving demand for cloud-based ZTNA deployments.
Leading Regions, Countries, or Segments in Zero Trust Network Access Software
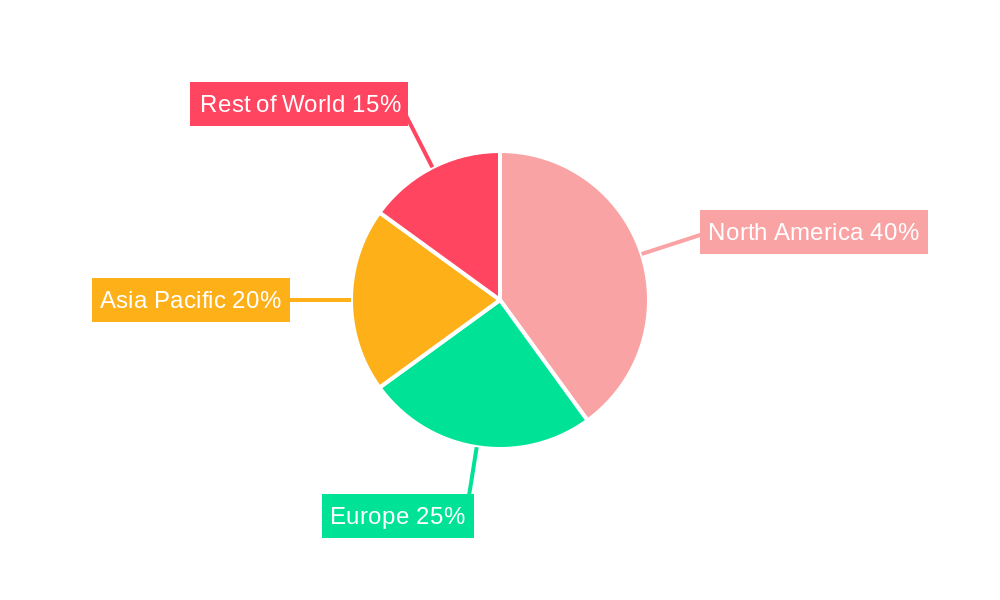
North America currently dominates the ZTNA market, holding the largest market share in 2025, driven by early adoption of cloud technologies, significant investment in cybersecurity, and the presence of major ZTNA vendors. However, Asia-Pacific is anticipated to witness the highest growth rate during the forecast period (2025-2033), fueled by rapid digitalization and the increasing adoption of cloud-based services across various sectors.
- Key Drivers for North American Dominance:
- High cybersecurity awareness and investment.
- Early adoption of cloud and remote work technologies.
- Presence of established ZTNA vendors and a mature IT infrastructure.
- Stringent regulatory frameworks pushing adoption.
- Key Drivers for Asia-Pacific Growth:
- Rapid digital transformation and rising cloud adoption.
- Increasing government initiatives to enhance cybersecurity infrastructure.
- Expanding enterprise IT budgets focused on security upgrades.
- Growing awareness of cybersecurity risks among businesses.
Europe also holds a substantial market share, fueled by stringent data privacy regulations and a significant presence of large enterprises. However, the market's growth may be slightly slower compared to Asia-Pacific due to slower cloud adoption compared to the region.
Zero Trust Network Access Software Product Innovations
Recent innovations in ZTNA software include enhanced AI-powered threat detection, seamless integration with existing security infrastructure, improved user experience through simplified dashboards, and advanced authentication protocols such as biometrics and multi-factor authentication (MFA). These advancements increase the security posture, ease of management and usability of the systems, leading to increased adoption rates. Unique selling propositions focus on granular control over access policies, context-aware access decisions, and comprehensive audit trails.
Propelling Factors for Zero Trust Network Access Software Growth
Several factors are driving the growth of the ZTNA market. Technological advancements such as AI-powered threat detection and enhanced authentication methods are improving security and efficiency. The economic benefits of reduced operational costs and improved productivity are also significant drivers. Furthermore, increased regulatory pressures to comply with data protection laws are pushing organizations to adopt more secure access solutions like ZTNA. The growing trend of remote work, increasing adoption of cloud services, and the escalating frequency and sophistication of cyberattacks also contribute heavily to the market expansion.
Obstacles in the Zero Trust Network Access Software Market
Despite the significant growth potential, challenges exist within the ZTNA market. High initial implementation costs can be a barrier for smaller organizations. Integration complexity with existing IT infrastructure can also hinder adoption. Furthermore, the ongoing evolution of cyber threats necessitates continuous updates and improvements in ZTNA solutions, posing an ongoing challenge for vendors and end-users alike. Competitive pressures among numerous providers also create challenges in market penetration and pricing strategies.
Future Opportunities in Zero Trust Network Access Software
Future opportunities lie in the expansion into new markets, particularly in developing economies undergoing rapid digitalization. The integration of ZTNA with other security solutions like endpoint detection and response (EDR) and Security Information and Event Management (SIEM) systems will also create new revenue streams. The development of more sophisticated and user-friendly ZTNA solutions catering to specific industry needs will also present ample opportunities for growth. Furthermore, the increasing focus on edge computing and IoT security will create new avenues for ZTNA deployment.
Major Players in the Zero Trust Network Access Software Ecosystem
Key Developments in Zero Trust Network Access Software Industry
- 2022/Q4: Zscaler launched its new ZTNA platform with enhanced AI capabilities.
- 2023/Q1: Cisco announced a major partnership with a leading cloud security provider to expand its ZTNA offerings.
- 2023/Q2: Palo Alto Networks acquired a smaller ZTNA company to bolster its product portfolio.
- 2024/Q1: Several vendors announced significant price reductions to compete in the market. (xx further developments with year/month can be added here)
Strategic Zero Trust Network Access Software Market Forecast
The ZTNA market is poised for continued strong growth, driven by ongoing technological advancements, increased adoption by SMEs and heightened security concerns across various industries. The expansion into new markets, particularly in developing economies, will further fuel market expansion. The integration of ZTNA with other security solutions and the development of more sophisticated products tailored to specific industry needs will significantly enhance market potential, creating multi-million-dollar opportunities for vendors in the coming years.
Zero Trust Network Access Software Segmentation
-
1. Application
- 1.1. Large Enterprises
- 1.2. SMEs
-
2. Type
- 2.1. Cloud-Based
- 2.2. On-Premise
Zero Trust Network Access Software Segmentation By Geography
-
1. North America
- 1.1. United States
- 1.2. Canada
- 1.3. Mexico
-
2. South America
- 2.1. Brazil
- 2.2. Argentina
- 2.3. Rest of South America
-
3. Europe
- 3.1. United Kingdom
- 3.2. Germany
- 3.3. France
- 3.4. Italy
- 3.5. Spain
- 3.6. Russia
- 3.7. Benelux
- 3.8. Nordics
- 3.9. Rest of Europe
-
4. Middle East & Africa
- 4.1. Turkey
- 4.2. Israel
- 4.3. GCC
- 4.4. North Africa
- 4.5. South Africa
- 4.6. Rest of Middle East & Africa
-
5. Asia Pacific
- 5.1. China
- 5.2. India
- 5.3. Japan
- 5.4. South Korea
- 5.5. ASEAN
- 5.6. Oceania
- 5.7. Rest of Asia Pacific
Zero Trust Network Access Software Regional Market Share
Geographic Coverage of Zero Trust Network Access Software
Zero Trust Network Access Software REPORT HIGHLIGHTS
| Aspects | Details |
|---|---|
| Study Period | 2020-2034 |
| Base Year | 2025 |
| Estimated Year | 2026 |
| Forecast Period | 2026-2034 |
| Historical Period | 2020-2025 |
| Growth Rate | CAGR of 14.76% from 2020-2034 |
| Segmentation |
|
Table of Contents
- 1. Introduction
- 1.1. Research Scope
- 1.2. Market Segmentation
- 1.3. Research Objective
- 1.4. Definitions and Assumptions
- 2. Executive Summary
- 2.1. Market Snapshot
- 3. Market Dynamics
- 3.1. Market Drivers
- 3.2. Market Restrains
- 3.3. Market Trends
- 3.4. Market Opportunities
- 4. Market Factor Analysis
- 4.1. Porters Five Forces
- 4.1.1. Bargaining Power of Suppliers
- 4.1.2. Bargaining Power of Buyers
- 4.1.3. Threat of New Entrants
- 4.1.4. Threat of Substitutes
- 4.1.5. Competitive Rivalry
- 4.2. PESTEL analysis
- 4.3. BCG Analysis
- 4.3.1. Stars (High Growth, High Market Share)
- 4.3.2. Cash Cows (Low Growth, High Market Share)
- 4.3.3. Question Mark (High Growth, Low Market Share)
- 4.3.4. Dogs (Low Growth, Low Market Share)
- 4.4. Ansoff Matrix Analysis
- 4.5. Supply Chain Analysis
- 4.6. Regulatory Landscape
- 4.7. Current Market Potential and Opportunity Assessment (TAM–SAM–SOM Framework)
- 4.8. DMV Analyst Note
- 4.1. Porters Five Forces
- 5. Market Analysis, Insights and Forecast 2021-2033
- 5.1. Market Analysis, Insights and Forecast - by Application
- 5.1.1. Large Enterprises
- 5.1.2. SMEs
- 5.2. Market Analysis, Insights and Forecast - by Type
- 5.2.1. Cloud-Based
- 5.2.2. On-Premise
- 5.3. Market Analysis, Insights and Forecast - by Region
- 5.3.1. North America
- 5.3.2. South America
- 5.3.3. Europe
- 5.3.4. Middle East & Africa
- 5.3.5. Asia Pacific
- 5.1. Market Analysis, Insights and Forecast - by Application
- 6. Global Zero Trust Network Access Software Analysis, Insights and Forecast, 2021-2033
- 6.1. Market Analysis, Insights and Forecast - by Application
- 6.1.1. Large Enterprises
- 6.1.2. SMEs
- 6.2. Market Analysis, Insights and Forecast - by Type
- 6.2.1. Cloud-Based
- 6.2.2. On-Premise
- 6.1. Market Analysis, Insights and Forecast - by Application
- 7. North America Zero Trust Network Access Software Analysis, Insights and Forecast, 2020-2032
- 7.1. Market Analysis, Insights and Forecast - by Application
- 7.1.1. Large Enterprises
- 7.1.2. SMEs
- 7.2. Market Analysis, Insights and Forecast - by Type
- 7.2.1. Cloud-Based
- 7.2.2. On-Premise
- 7.1. Market Analysis, Insights and Forecast - by Application
- 8. South America Zero Trust Network Access Software Analysis, Insights and Forecast, 2020-2032
- 8.1. Market Analysis, Insights and Forecast - by Application
- 8.1.1. Large Enterprises
- 8.1.2. SMEs
- 8.2. Market Analysis, Insights and Forecast - by Type
- 8.2.1. Cloud-Based
- 8.2.2. On-Premise
- 8.1. Market Analysis, Insights and Forecast - by Application
- 9. Europe Zero Trust Network Access Software Analysis, Insights and Forecast, 2020-2032
- 9.1. Market Analysis, Insights and Forecast - by Application
- 9.1.1. Large Enterprises
- 9.1.2. SMEs
- 9.2. Market Analysis, Insights and Forecast - by Type
- 9.2.1. Cloud-Based
- 9.2.2. On-Premise
- 9.1. Market Analysis, Insights and Forecast - by Application
- 10. Middle East & Africa Zero Trust Network Access Software Analysis, Insights and Forecast, 2020-2032
- 10.1. Market Analysis, Insights and Forecast - by Application
- 10.1.1. Large Enterprises
- 10.1.2. SMEs
- 10.2. Market Analysis, Insights and Forecast - by Type
- 10.2.1. Cloud-Based
- 10.2.2. On-Premise
- 10.1. Market Analysis, Insights and Forecast - by Application
- 11. Asia Pacific Zero Trust Network Access Software Analysis, Insights and Forecast, 2020-2032
- 11.1. Market Analysis, Insights and Forecast - by Application
- 11.1.1. Large Enterprises
- 11.1.2. SMEs
- 11.2. Market Analysis, Insights and Forecast - by Type
- 11.2.1. Cloud-Based
- 11.2.2. On-Premise
- 11.1. Market Analysis, Insights and Forecast - by Application
- 12. Competitive Analysis
- 12.1. Company Profiles
- 12.1.1 Cisco
- 12.1.1.1. Company Overview
- 12.1.1.2. Products
- 12.1.1.3. Company Financials
- 12.1.1.4. SWOT Analysis
- 12.1.2 Ivanti
- 12.1.2.1. Company Overview
- 12.1.2.2. Products
- 12.1.2.3. Company Financials
- 12.1.2.4. SWOT Analysis
- 12.1.3 Cloudflare
- 12.1.3.1. Company Overview
- 12.1.3.2. Products
- 12.1.3.3. Company Financials
- 12.1.3.4. SWOT Analysis
- 12.1.4 Fortinet
- 12.1.4.1. Company Overview
- 12.1.4.2. Products
- 12.1.4.3. Company Financials
- 12.1.4.4. SWOT Analysis
- 12.1.5 Absolute
- 12.1.5.1. Company Overview
- 12.1.5.2. Products
- 12.1.5.3. Company Financials
- 12.1.5.4. SWOT Analysis
- 12.1.6 Palo Alto
- 12.1.6.1. Company Overview
- 12.1.6.2. Products
- 12.1.6.3. Company Financials
- 12.1.6.4. SWOT Analysis
- 12.1.7 Citrix
- 12.1.7.1. Company Overview
- 12.1.7.2. Products
- 12.1.7.3. Company Financials
- 12.1.7.4. SWOT Analysis
- 12.1.8 Zscaler
- 12.1.8.1. Company Overview
- 12.1.8.2. Products
- 12.1.8.3. Company Financials
- 12.1.8.4. SWOT Analysis
- 12.1.9 Check Point
- 12.1.9.1. Company Overview
- 12.1.9.2. Products
- 12.1.9.3. Company Financials
- 12.1.9.4. SWOT Analysis
- 12.1.10 NordLayer
- 12.1.10.1. Company Overview
- 12.1.10.2. Products
- 12.1.10.3. Company Financials
- 12.1.10.4. SWOT Analysis
- 12.1.11 Appgate
- 12.1.11.1. Company Overview
- 12.1.11.2. Products
- 12.1.11.3. Company Financials
- 12.1.11.4. SWOT Analysis
- 12.1.12 Cato Networks
- 12.1.12.1. Company Overview
- 12.1.12.2. Products
- 12.1.12.3. Company Financials
- 12.1.12.4. SWOT Analysis
- 12.1.13 WatchGuard
- 12.1.13.1. Company Overview
- 12.1.13.2. Products
- 12.1.13.3. Company Financials
- 12.1.13.4. SWOT Analysis
- 12.1.14 SonicWall
- 12.1.14.1. Company Overview
- 12.1.14.2. Products
- 12.1.14.3. Company Financials
- 12.1.14.4. SWOT Analysis
- 12.1.15 Forcepoint
- 12.1.15.1. Company Overview
- 12.1.15.2. Products
- 12.1.15.3. Company Financials
- 12.1.15.4. SWOT Analysis
- 12.1.16 Jamf
- 12.1.16.1. Company Overview
- 12.1.16.2. Products
- 12.1.16.3. Company Financials
- 12.1.16.4. SWOT Analysis
- 12.1.17 Netskope
- 12.1.17.1. Company Overview
- 12.1.17.2. Products
- 12.1.17.3. Company Financials
- 12.1.17.4. SWOT Analysis
- 12.1.1 Cisco
- 12.2. Market Entropy
- 12.2.1 Company's Key Areas Served
- 12.2.2 Recent Developments
- 12.3. Company Market Share Analysis 2025
- 12.3.1 Top 5 Companies Market Share Analysis
- 12.3.2 Top 3 Companies Market Share Analysis
- 12.4. List of Potential Customers
- 13. Research Methodology
List of Figures
- Figure 1: Global Zero Trust Network Access Software Revenue Breakdown (billion, %) by Region 2025 & 2033
- Figure 2: North America Zero Trust Network Access Software Revenue (billion), by Application 2025 & 2033
- Figure 3: North America Zero Trust Network Access Software Revenue Share (%), by Application 2025 & 2033
- Figure 4: North America Zero Trust Network Access Software Revenue (billion), by Type 2025 & 2033
- Figure 5: North America Zero Trust Network Access Software Revenue Share (%), by Type 2025 & 2033
- Figure 6: North America Zero Trust Network Access Software Revenue (billion), by Country 2025 & 2033
- Figure 7: North America Zero Trust Network Access Software Revenue Share (%), by Country 2025 & 2033
- Figure 8: South America Zero Trust Network Access Software Revenue (billion), by Application 2025 & 2033
- Figure 9: South America Zero Trust Network Access Software Revenue Share (%), by Application 2025 & 2033
- Figure 10: South America Zero Trust Network Access Software Revenue (billion), by Type 2025 & 2033
- Figure 11: South America Zero Trust Network Access Software Revenue Share (%), by Type 2025 & 2033
- Figure 12: South America Zero Trust Network Access Software Revenue (billion), by Country 2025 & 2033
- Figure 13: South America Zero Trust Network Access Software Revenue Share (%), by Country 2025 & 2033
- Figure 14: Europe Zero Trust Network Access Software Revenue (billion), by Application 2025 & 2033
- Figure 15: Europe Zero Trust Network Access Software Revenue Share (%), by Application 2025 & 2033
- Figure 16: Europe Zero Trust Network Access Software Revenue (billion), by Type 2025 & 2033
- Figure 17: Europe Zero Trust Network Access Software Revenue Share (%), by Type 2025 & 2033
- Figure 18: Europe Zero Trust Network Access Software Revenue (billion), by Country 2025 & 2033
- Figure 19: Europe Zero Trust Network Access Software Revenue Share (%), by Country 2025 & 2033
- Figure 20: Middle East & Africa Zero Trust Network Access Software Revenue (billion), by Application 2025 & 2033
- Figure 21: Middle East & Africa Zero Trust Network Access Software Revenue Share (%), by Application 2025 & 2033
- Figure 22: Middle East & Africa Zero Trust Network Access Software Revenue (billion), by Type 2025 & 2033
- Figure 23: Middle East & Africa Zero Trust Network Access Software Revenue Share (%), by Type 2025 & 2033
- Figure 24: Middle East & Africa Zero Trust Network Access Software Revenue (billion), by Country 2025 & 2033
- Figure 25: Middle East & Africa Zero Trust Network Access Software Revenue Share (%), by Country 2025 & 2033
- Figure 26: Asia Pacific Zero Trust Network Access Software Revenue (billion), by Application 2025 & 2033
- Figure 27: Asia Pacific Zero Trust Network Access Software Revenue Share (%), by Application 2025 & 2033
- Figure 28: Asia Pacific Zero Trust Network Access Software Revenue (billion), by Type 2025 & 2033
- Figure 29: Asia Pacific Zero Trust Network Access Software Revenue Share (%), by Type 2025 & 2033
- Figure 30: Asia Pacific Zero Trust Network Access Software Revenue (billion), by Country 2025 & 2033
- Figure 31: Asia Pacific Zero Trust Network Access Software Revenue Share (%), by Country 2025 & 2033
List of Tables
- Table 1: Global Zero Trust Network Access Software Revenue billion Forecast, by Application 2020 & 2033
- Table 2: Global Zero Trust Network Access Software Revenue billion Forecast, by Type 2020 & 2033
- Table 3: Global Zero Trust Network Access Software Revenue billion Forecast, by Region 2020 & 2033
- Table 4: Global Zero Trust Network Access Software Revenue billion Forecast, by Application 2020 & 2033
- Table 5: Global Zero Trust Network Access Software Revenue billion Forecast, by Type 2020 & 2033
- Table 6: Global Zero Trust Network Access Software Revenue billion Forecast, by Country 2020 & 2033
- Table 7: United States Zero Trust Network Access Software Revenue (billion) Forecast, by Application 2020 & 2033
- Table 8: Canada Zero Trust Network Access Software Revenue (billion) Forecast, by Application 2020 & 2033
- Table 9: Mexico Zero Trust Network Access Software Revenue (billion) Forecast, by Application 2020 & 2033
- Table 10: Global Zero Trust Network Access Software Revenue billion Forecast, by Application 2020 & 2033
- Table 11: Global Zero Trust Network Access Software Revenue billion Forecast, by Type 2020 & 2033
- Table 12: Global Zero Trust Network Access Software Revenue billion Forecast, by Country 2020 & 2033
- Table 13: Brazil Zero Trust Network Access Software Revenue (billion) Forecast, by Application 2020 & 2033
- Table 14: Argentina Zero Trust Network Access Software Revenue (billion) Forecast, by Application 2020 & 2033
- Table 15: Rest of South America Zero Trust Network Access Software Revenue (billion) Forecast, by Application 2020 & 2033
- Table 16: Global Zero Trust Network Access Software Revenue billion Forecast, by Application 2020 & 2033
- Table 17: Global Zero Trust Network Access Software Revenue billion Forecast, by Type 2020 & 2033
- Table 18: Global Zero Trust Network Access Software Revenue billion Forecast, by Country 2020 & 2033
- Table 19: United Kingdom Zero Trust Network Access Software Revenue (billion) Forecast, by Application 2020 & 2033
- Table 20: Germany Zero Trust Network Access Software Revenue (billion) Forecast, by Application 2020 & 2033
- Table 21: France Zero Trust Network Access Software Revenue (billion) Forecast, by Application 2020 & 2033
- Table 22: Italy Zero Trust Network Access Software Revenue (billion) Forecast, by Application 2020 & 2033
- Table 23: Spain Zero Trust Network Access Software Revenue (billion) Forecast, by Application 2020 & 2033
- Table 24: Russia Zero Trust Network Access Software Revenue (billion) Forecast, by Application 2020 & 2033
- Table 25: Benelux Zero Trust Network Access Software Revenue (billion) Forecast, by Application 2020 & 2033
- Table 26: Nordics Zero Trust Network Access Software Revenue (billion) Forecast, by Application 2020 & 2033
- Table 27: Rest of Europe Zero Trust Network Access Software Revenue (billion) Forecast, by Application 2020 & 2033
- Table 28: Global Zero Trust Network Access Software Revenue billion Forecast, by Application 2020 & 2033
- Table 29: Global Zero Trust Network Access Software Revenue billion Forecast, by Type 2020 & 2033
- Table 30: Global Zero Trust Network Access Software Revenue billion Forecast, by Country 2020 & 2033
- Table 31: Turkey Zero Trust Network Access Software Revenue (billion) Forecast, by Application 2020 & 2033
- Table 32: Israel Zero Trust Network Access Software Revenue (billion) Forecast, by Application 2020 & 2033
- Table 33: GCC Zero Trust Network Access Software Revenue (billion) Forecast, by Application 2020 & 2033
- Table 34: North Africa Zero Trust Network Access Software Revenue (billion) Forecast, by Application 2020 & 2033
- Table 35: South Africa Zero Trust Network Access Software Revenue (billion) Forecast, by Application 2020 & 2033
- Table 36: Rest of Middle East & Africa Zero Trust Network Access Software Revenue (billion) Forecast, by Application 2020 & 2033
- Table 37: Global Zero Trust Network Access Software Revenue billion Forecast, by Application 2020 & 2033
- Table 38: Global Zero Trust Network Access Software Revenue billion Forecast, by Type 2020 & 2033
- Table 39: Global Zero Trust Network Access Software Revenue billion Forecast, by Country 2020 & 2033
- Table 40: China Zero Trust Network Access Software Revenue (billion) Forecast, by Application 2020 & 2033
- Table 41: India Zero Trust Network Access Software Revenue (billion) Forecast, by Application 2020 & 2033
- Table 42: Japan Zero Trust Network Access Software Revenue (billion) Forecast, by Application 2020 & 2033
- Table 43: South Korea Zero Trust Network Access Software Revenue (billion) Forecast, by Application 2020 & 2033
- Table 44: ASEAN Zero Trust Network Access Software Revenue (billion) Forecast, by Application 2020 & 2033
- Table 45: Oceania Zero Trust Network Access Software Revenue (billion) Forecast, by Application 2020 & 2033
- Table 46: Rest of Asia Pacific Zero Trust Network Access Software Revenue (billion) Forecast, by Application 2020 & 2033
Frequently Asked Questions
1. What is the projected Compound Annual Growth Rate (CAGR) of the Zero Trust Network Access Software?
The projected CAGR is approximately 14.76%.
2. Which companies are prominent players in the Zero Trust Network Access Software?
Key companies in the market include Cisco, Ivanti, Cloudflare, Fortinet, Absolute, Palo Alto, Citrix, Zscaler, Check Point, NordLayer, Appgate, Cato Networks, WatchGuard, SonicWall, Forcepoint, Jamf, Netskope.
3. What are the main segments of the Zero Trust Network Access Software?
The market segments include Application, Type.
4. Can you provide details about the market size?
The market size is estimated to be USD 42.28 billion as of 2022.
5. What are some drivers contributing to market growth?
N/A
6. What are the notable trends driving market growth?
N/A
7. Are there any restraints impacting market growth?
N/A
8. Can you provide examples of recent developments in the market?
N/A
9. What pricing options are available for accessing the report?
Pricing options include single-user, multi-user, and enterprise licenses priced at USD 3950.00, USD 5925.00, and USD 7900.00 respectively.
10. Is the market size provided in terms of value or volume?
The market size is provided in terms of value, measured in billion.
11. Are there any specific market keywords associated with the report?
Yes, the market keyword associated with the report is "Zero Trust Network Access Software," which aids in identifying and referencing the specific market segment covered.
12. How do I determine which pricing option suits my needs best?
The pricing options vary based on user requirements and access needs. Individual users may opt for single-user licenses, while businesses requiring broader access may choose multi-user or enterprise licenses for cost-effective access to the report.
13. Are there any additional resources or data provided in the Zero Trust Network Access Software report?
While the report offers comprehensive insights, it's advisable to review the specific contents or supplementary materials provided to ascertain if additional resources or data are available.
14. How can I stay updated on further developments or reports in the Zero Trust Network Access Software?
To stay informed about further developments, trends, and reports in the Zero Trust Network Access Software, consider subscribing to industry newsletters, following relevant companies and organizations, or regularly checking reputable industry news sources and publications.
Methodology
Step 1 - Identification of Relevant Samples Size from Population Database


Step 2 - Approaches for Defining Global Market Size (Value, Volume* & Price*)

Note*: In applicable scenarios
Step 3 - Data Sources
Primary Research
- Web Analytics
- Survey Reports
- Research Institute
- Latest Research Reports
- Opinion Leaders
Secondary Research
- Annual Reports
- White Paper
- Latest Press Release
- Industry Association
- Paid Database
- Investor Presentations

Step 4 - Data Triangulation
Involves using different sources of information in order to increase the validity of a study
These sources are likely to be stakeholders in a program - participants, other researchers, program staff, other community members, and so on.
Then we put all data in single framework & apply various statistical tools to find out the dynamic on the market.
During the analysis stage, feedback from the stakeholder groups would be compared to determine areas of agreement as well as areas of divergence