

Key Insights
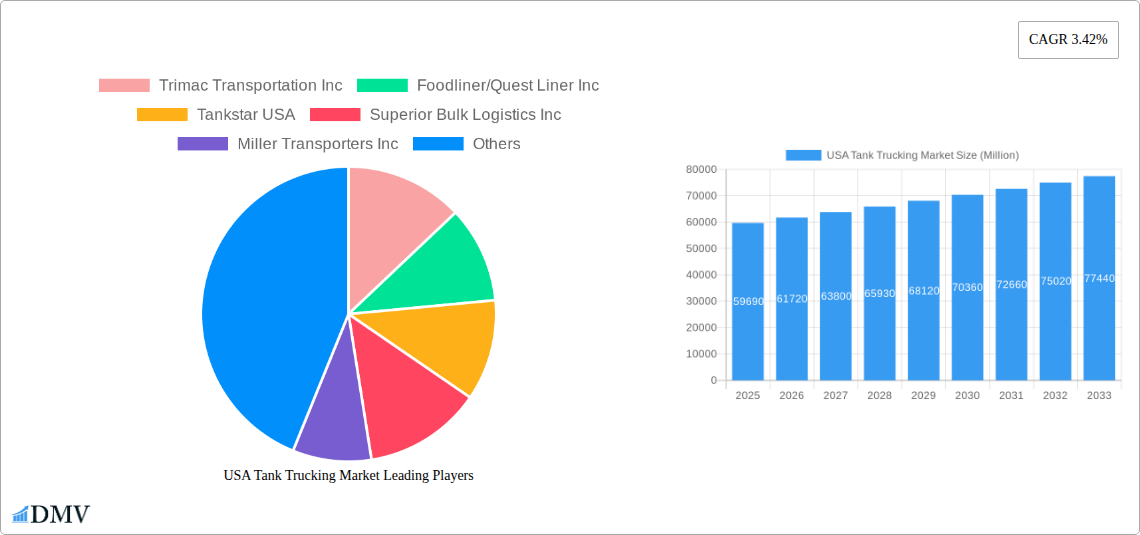
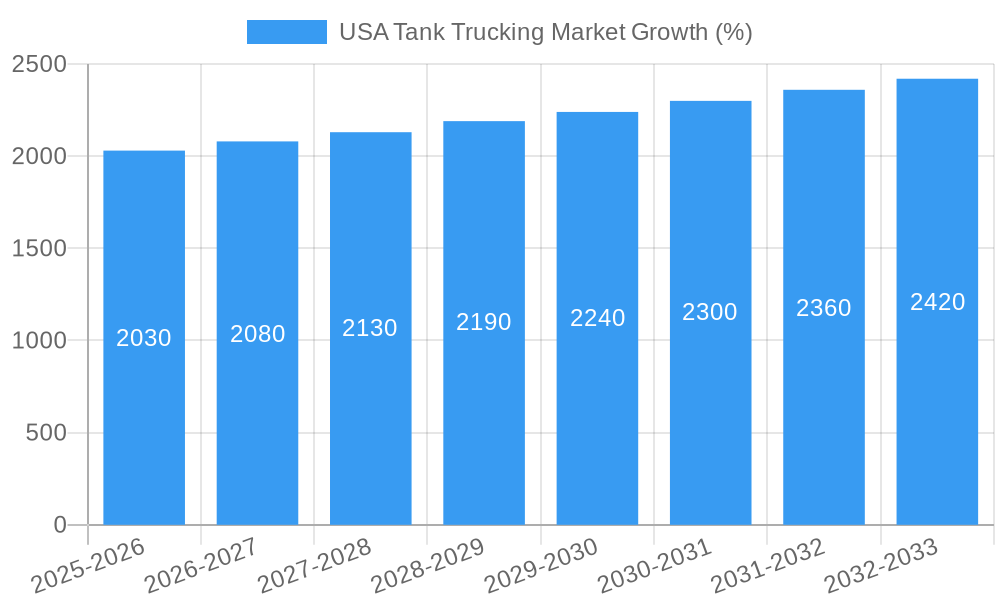
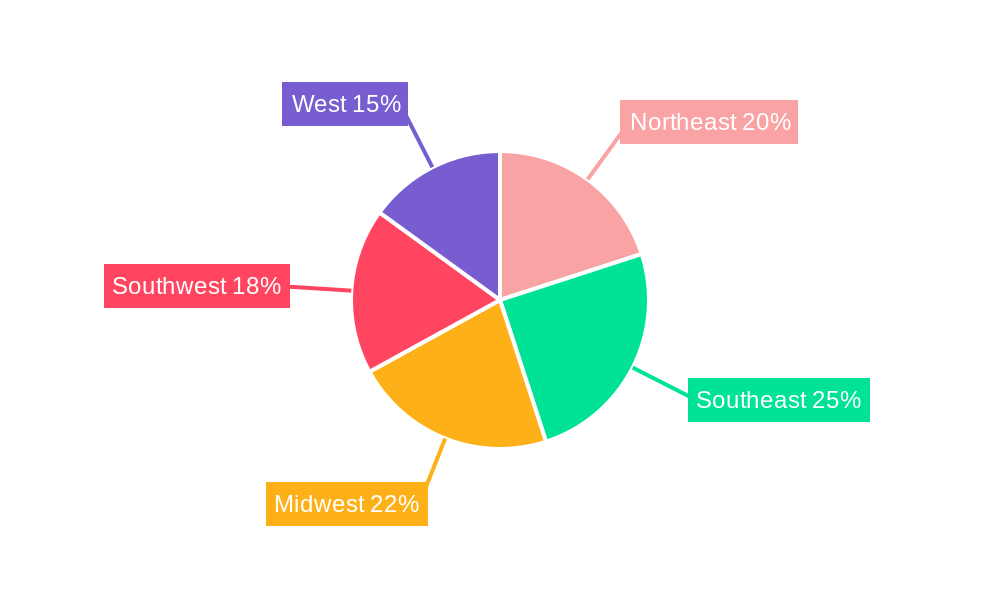
The US tank trucking market, valued at $59.69 billion in 2025, is projected to experience steady growth, driven by increasing demand for the transportation of petroleum products, chemicals, and food and beverages. The market's Compound Annual Growth Rate (CAGR) of 3.42% from 2025 to 2033 reflects a consistent need for efficient and reliable bulk liquid transportation across diverse sectors of the US economy. Key growth drivers include expanding industrial activity, particularly in manufacturing and energy, coupled with the growth of e-commerce and its reliance on timely delivery of various goods. The market is segmented by fleet type (for-hire and private), capacity (light, medium, and heavy-duty), and product category, with petroleum products, including gasoline, diesel, and aviation fuels, constituting a significant share. Regional variations exist, with higher demand anticipated in regions with robust industrial centers and concentrated populations. While regulatory changes and fuel price fluctuations present potential restraints, the overall outlook remains positive, indicating continued market expansion throughout the forecast period. Major players like Trimac Transportation, Foodliner/Quest Liner, and Tankstar USA are actively shaping the market landscape through strategic expansions, technological advancements, and service diversification. The competitive landscape is further characterized by a diverse range of smaller, regional operators contributing to the overall market dynamism.
The continued growth trajectory is supported by the expanding US economy and the essential role tank trucking plays in various supply chains. While challenges like driver shortages and increasing operating costs require strategic navigation, innovation in areas such as technological integration (GPS tracking, route optimization software) and sustainable practices (alternative fuels, improved vehicle efficiency) is poised to enhance the market's efficiency and overall sustainability. The diversification of the transported goods further assures market stability, mitigating the impact of fluctuations in any single sector. Moreover, the increasing focus on safety regulations and compliance will contribute to a more standardized and secure operational environment, ultimately contributing to the sector’s sustained growth.
USA Tank Trucking Market: A Comprehensive Report (2019-2033)
This insightful report provides a detailed analysis of the USA Tank Trucking Market, offering a comprehensive overview of its current state and future trajectory. Covering the period from 2019 to 2033, with a focus on 2025, this study delves into market size, segmentation, key players, and emerging trends, equipping stakeholders with crucial data for informed decision-making. The market is projected to reach xx Million by 2033, representing substantial growth opportunities.
USA Tank Trucking Market Composition & Trends
This section evaluates the competitive landscape of the USA tank trucking market, analyzing market concentration, innovation drivers, regulatory factors, substitute products, end-user profiles, and recent mergers and acquisitions (M&A) activities.
Market Concentration & M&A Activity: The market exhibits a moderately concentrated structure, with key players like Kenan Advantage Group holding significant market share. However, a substantial number of smaller and regional players also contribute significantly. M&A activity has been significant, with deals valued at xx Million in recent years. For example, Kenan Advantage Group's acquisition of Northern Dry Bulk showcases the strategic consolidation within the sector.
- Top 5 Players Market Share: xx%
- Average M&A Deal Value (2019-2024): xx Million
- Number of M&A Deals (2019-2024): xx
Innovation Catalysts and Regulatory Landscape: Technological advancements, such as telematics and driver-assistance systems, are driving efficiency and safety improvements. Stringent regulations concerning emissions and driver safety are shaping industry practices. The emergence of alternative fuels and sustainable transportation solutions presents both challenges and opportunities.
Substitute Products and End-User Profiles: While direct substitutes are limited, the industry faces competition from other modes of transportation, such as rail and pipelines, particularly for bulk commodities. End-users span diverse sectors including energy, chemicals, food and beverage, and agriculture.
USA Tank Trucking Market Industry Evolution
This section analyzes the historical and projected growth trajectories of the USA tank trucking market, examining technological advancements and shifting consumer demands.
The USA tank trucking market experienced a Compound Annual Growth Rate (CAGR) of xx% during the historical period (2019-2024), driven by increasing demand for efficient transportation of bulk liquids and solids. Technological advancements, such as advanced logistics software and GPS tracking systems, have improved operational efficiency and reduced transportation costs. The adoption rate of telematics is estimated at xx% as of 2024, with an anticipated increase to xx% by 2033. Furthermore, consumer demand for faster and more reliable delivery continues to fuel market growth. The predicted CAGR for the forecast period (2025-2033) is xx%, influenced by factors such as increased infrastructure investment and expansion into new markets. This growth will be further supported by increasing adoption of autonomous vehicles and route optimization technology. The market is expected to reach xx Million by 2033.
Leading Regions, Countries, or Segments in USA Tank Trucking Market
This section identifies the dominant regions, countries, and segments within the USA tank trucking market.
By Fleet Type: The for-hire segment currently dominates the market, accounting for xx% of the total revenue in 2024, driven by the growing need for flexible and outsourced transportation services. The private fleet segment is expected to witness moderate growth due to increasing investment in private fleets by large corporations for improved cost control and supply chain visibility.
- Key Drivers for For-hire Segment: High demand for flexible transportation solutions, cost-effectiveness for smaller businesses.
- Key Drivers for Private Segment: Enhanced control over logistics, potential cost savings for large enterprises.
By Capacity: The heavy-duty segment holds the largest market share, owing to the significant volume of bulk goods transported. The medium-duty segment is experiencing steady growth, catering to the needs of smaller businesses and regional transportation.
By Product Category: The transportation of petroleum products (gasoline, diesel, and aviation fuels) currently dominates the market, followed by the chemical and food and beverage industries. Growth in these sectors will continue to drive demand for tank trucking services.
- Key Drivers for Petroleum Products: Continuous demand for fuel across the US.
- Key Drivers for Chemicals: Growth in manufacturing and industrial activities.
- Key Drivers for Food and Beverages: Increasing demand for efficient food supply chains.
USA Tank Trucking Market Product Innovations
Recent innovations focus on enhancing safety, efficiency, and sustainability. Advanced telematics systems provide real-time tracking and data analytics, optimizing routes and reducing fuel consumption. The integration of IoT (Internet of Things) devices further improves monitoring and maintenance of tankers, while the development of alternative fuel-powered vehicles addresses environmental concerns. These innovations enhance efficiency, improve safety, and reduce operational costs.
Propelling Factors for USA Tank Trucking Market Growth
The growth of the USA tank trucking market is propelled by several factors: increased industrial production and manufacturing activity that boosts demand for chemical and petroleum product transportation, rising e-commerce which leads to greater demand for efficient last-mile delivery, and expansion of the infrastructure network. Furthermore, technological advancements like telematics and autonomous driving technologies improve efficiency and safety, driving market growth.
Obstacles in the USA Tank Trucking Market
The market faces challenges such as fluctuating fuel prices which impacts operational costs, driver shortages limiting the availability of skilled drivers, and stringent environmental regulations that require investments in cleaner technologies. These factors contribute to increased operational costs and limit profitability.
Future Opportunities in USA Tank Trucking Market
Emerging opportunities lie in the adoption of autonomous trucking technology, increasing demand for specialized transportation services for niche products (e.g., pharmaceuticals), and expansion into underserved geographical areas. Growth in sectors such as renewable energy and sustainable materials will also create new opportunities for specialized tank trucking services.
Major Players in the USA Tank Trucking Market Ecosystem
- Trimac Transportation Inc
- Foodliner/Quest Liner Inc
- Tankstar USA
- Superior Bulk Logistics Inc
- Miller Transporters Inc
- Groendyke Transport Inc
- Martin Transport Inc
- Florida Rock & Tank Lines Inc
- Slay Transportation Co Inc
- Apex Logistics LLC
- Mission Petroleum Carriers
- Genox Transportation Inc
- J&M Tank Lines Inc
- CLI Transport LP
- Tidewater Transit Co Inc
- Herman R Ewell Inc
- Service Transport Company
- Schilli Bulk Carriers Group
- Andrews Logistics
- CTL Transportation LLC
- Eagle Transport Corp
- Ruan Transportation Management Systems
- Kenan Advantage Group
- Dupre Logistics LLC
Key Developments in USA Tank Trucking Market Industry
- April 2023: Trimac Transportation acquired AIP Logistics, expanding its bulk terminal services, transportation, and warehousing capabilities.
- February 2024: Kenan Advantage Group acquired Northern Dry Bulk, strengthening its position in the plastic resin transportation sector.
Strategic USA Tank Trucking Market Forecast
The USA tank trucking market is poised for continued growth, driven by technological advancements, increasing demand from various industries, and favorable economic conditions. Strategic investments in fleet modernization, technological upgrades, and expansion into new markets will be crucial for success in this dynamic environment. The market presents significant opportunities for both established players and new entrants.
USA Tank Trucking Market Segmentation
-
1. Fleet Type
- 1.1. For-hire
- 1.2. Private
-
2. Capacity
- 2.1. Light Duty
- 2.2. Medium Duty
- 2.3. Heavy Duty
-
3. Product Category
- 3.1. Crude Petroleum
- 3.2. Petroleu
- 3.3. Chemicals
- 3.4. Food and Beverages
- 3.5. Fertilizers
- 3.6. Other Product Categories
USA Tank Trucking Market Segmentation By Geography
-
1. North America
- 1.1. United States
- 1.2. Canada
- 1.3. Mexico
-
2. South America
- 2.1. Brazil
- 2.2. Argentina
- 2.3. Rest of South America
-
3. Europe
- 3.1. United Kingdom
- 3.2. Germany
- 3.3. France
- 3.4. Italy
- 3.5. Spain
- 3.6. Russia
- 3.7. Benelux
- 3.8. Nordics
- 3.9. Rest of Europe
-
4. Middle East & Africa
- 4.1. Turkey
- 4.2. Israel
- 4.3. GCC
- 4.4. North Africa
- 4.5. South Africa
- 4.6. Rest of Middle East & Africa
-
5. Asia Pacific
- 5.1. China
- 5.2. India
- 5.3. Japan
- 5.4. South Korea
- 5.5. ASEAN
- 5.6. Oceania
- 5.7. Rest of Asia Pacific
USA Tank Trucking Market REPORT HIGHLIGHTS
| Aspects | Details |
|---|---|
| Study Period | 2019-2033 |
| Base Year | 2024 |
| Estimated Year | 2025 |
| Forecast Period | 2025-2033 |
| Historical Period | 2019-2024 |
| Growth Rate | CAGR of 3.42% from 2019-2033 |
| Segmentation |
|
Table of Contents
- 1. Introduction
- 1.1. Research Scope
- 1.2. Market Segmentation
- 1.3. Research Methodology
- 1.4. Definitions and Assumptions
- 2. Executive Summary
- 2.1. Introduction
- 3. Market Dynamics
- 3.1. Introduction
- 3.2. Market Drivers
- 3.2.1. Rise in Demand for Oil and Natural Gas; Technological Advancements
- 3.3. Market Restrains
- 3.3.1. Increasing Regulatory Burden and Compliance Costs; Volatility of Fuel Prices
- 3.4. Market Trends
- 3.4.1. Fuel Tank Trailers as Petroleum Carriers are Boosting the Market's Growth in the United States
- 4. Market Factor Analysis
- 4.1. Porters Five Forces
- 4.2. Supply/Value Chain
- 4.3. PESTEL analysis
- 4.4. Market Entropy
- 4.5. Patent/Trademark Analysis
- 5. Global USA Tank Trucking Market Analysis, Insights and Forecast, 2019-2031
- 5.1. Market Analysis, Insights and Forecast - by Fleet Type
- 5.1.1. For-hire
- 5.1.2. Private
- 5.2. Market Analysis, Insights and Forecast - by Capacity
- 5.2.1. Light Duty
- 5.2.2. Medium Duty
- 5.2.3. Heavy Duty
- 5.3. Market Analysis, Insights and Forecast - by Product Category
- 5.3.1. Crude Petroleum
- 5.3.2. Petroleu
- 5.3.3. Chemicals
- 5.3.4. Food and Beverages
- 5.3.5. Fertilizers
- 5.3.6. Other Product Categories
- 5.4. Market Analysis, Insights and Forecast - by Region
- 5.4.1. North America
- 5.4.2. South America
- 5.4.3. Europe
- 5.4.4. Middle East & Africa
- 5.4.5. Asia Pacific
- 5.1. Market Analysis, Insights and Forecast - by Fleet Type
- 6. North America USA Tank Trucking Market Analysis, Insights and Forecast, 2019-2031
- 6.1. Market Analysis, Insights and Forecast - by Fleet Type
- 6.1.1. For-hire
- 6.1.2. Private
- 6.2. Market Analysis, Insights and Forecast - by Capacity
- 6.2.1. Light Duty
- 6.2.2. Medium Duty
- 6.2.3. Heavy Duty
- 6.3. Market Analysis, Insights and Forecast - by Product Category
- 6.3.1. Crude Petroleum
- 6.3.2. Petroleu
- 6.3.3. Chemicals
- 6.3.4. Food and Beverages
- 6.3.5. Fertilizers
- 6.3.6. Other Product Categories
- 6.1. Market Analysis, Insights and Forecast - by Fleet Type
- 7. South America USA Tank Trucking Market Analysis, Insights and Forecast, 2019-2031
- 7.1. Market Analysis, Insights and Forecast - by Fleet Type
- 7.1.1. For-hire
- 7.1.2. Private
- 7.2. Market Analysis, Insights and Forecast - by Capacity
- 7.2.1. Light Duty
- 7.2.2. Medium Duty
- 7.2.3. Heavy Duty
- 7.3. Market Analysis, Insights and Forecast - by Product Category
- 7.3.1. Crude Petroleum
- 7.3.2. Petroleu
- 7.3.3. Chemicals
- 7.3.4. Food and Beverages
- 7.3.5. Fertilizers
- 7.3.6. Other Product Categories
- 7.1. Market Analysis, Insights and Forecast - by Fleet Type
- 8. Europe USA Tank Trucking Market Analysis, Insights and Forecast, 2019-2031
- 8.1. Market Analysis, Insights and Forecast - by Fleet Type
- 8.1.1. For-hire
- 8.1.2. Private
- 8.2. Market Analysis, Insights and Forecast - by Capacity
- 8.2.1. Light Duty
- 8.2.2. Medium Duty
- 8.2.3. Heavy Duty
- 8.3. Market Analysis, Insights and Forecast - by Product Category
- 8.3.1. Crude Petroleum
- 8.3.2. Petroleu
- 8.3.3. Chemicals
- 8.3.4. Food and Beverages
- 8.3.5. Fertilizers
- 8.3.6. Other Product Categories
- 8.1. Market Analysis, Insights and Forecast - by Fleet Type
- 9. Middle East & Africa USA Tank Trucking Market Analysis, Insights and Forecast, 2019-2031
- 9.1. Market Analysis, Insights and Forecast - by Fleet Type
- 9.1.1. For-hire
- 9.1.2. Private
- 9.2. Market Analysis, Insights and Forecast - by Capacity
- 9.2.1. Light Duty
- 9.2.2. Medium Duty
- 9.2.3. Heavy Duty
- 9.3. Market Analysis, Insights and Forecast - by Product Category
- 9.3.1. Crude Petroleum
- 9.3.2. Petroleu
- 9.3.3. Chemicals
- 9.3.4. Food and Beverages
- 9.3.5. Fertilizers
- 9.3.6. Other Product Categories
- 9.1. Market Analysis, Insights and Forecast - by Fleet Type
- 10. Asia Pacific USA Tank Trucking Market Analysis, Insights and Forecast, 2019-2031
- 10.1. Market Analysis, Insights and Forecast - by Fleet Type
- 10.1.1. For-hire
- 10.1.2. Private
- 10.2. Market Analysis, Insights and Forecast - by Capacity
- 10.2.1. Light Duty
- 10.2.2. Medium Duty
- 10.2.3. Heavy Duty
- 10.3. Market Analysis, Insights and Forecast - by Product Category
- 10.3.1. Crude Petroleum
- 10.3.2. Petroleu
- 10.3.3. Chemicals
- 10.3.4. Food and Beverages
- 10.3.5. Fertilizers
- 10.3.6. Other Product Categories
- 10.1. Market Analysis, Insights and Forecast - by Fleet Type
- 11. Northeast USA Tank Trucking Market Analysis, Insights and Forecast, 2019-2031
- 12. Southeast USA Tank Trucking Market Analysis, Insights and Forecast, 2019-2031
- 13. Midwest USA Tank Trucking Market Analysis, Insights and Forecast, 2019-2031
- 14. Southwest USA Tank Trucking Market Analysis, Insights and Forecast, 2019-2031
- 15. West USA Tank Trucking Market Analysis, Insights and Forecast, 2019-2031
- 16. Competitive Analysis
- 16.1. Global Market Share Analysis 2024
- 16.2. Company Profiles
- 16.2.1 Trimac Transportation Inc
- 16.2.1.1. Overview
- 16.2.1.2. Products
- 16.2.1.3. SWOT Analysis
- 16.2.1.4. Recent Developments
- 16.2.1.5. Financials (Based on Availability)
- 16.2.2 Foodliner/Quest Liner Inc
- 16.2.2.1. Overview
- 16.2.2.2. Products
- 16.2.2.3. SWOT Analysis
- 16.2.2.4. Recent Developments
- 16.2.2.5. Financials (Based on Availability)
- 16.2.3 Tankstar USA
- 16.2.3.1. Overview
- 16.2.3.2. Products
- 16.2.3.3. SWOT Analysis
- 16.2.3.4. Recent Developments
- 16.2.3.5. Financials (Based on Availability)
- 16.2.4 Superior Bulk Logistics Inc
- 16.2.4.1. Overview
- 16.2.4.2. Products
- 16.2.4.3. SWOT Analysis
- 16.2.4.4. Recent Developments
- 16.2.4.5. Financials (Based on Availability)
- 16.2.5 Miller Transporters Inc
- 16.2.5.1. Overview
- 16.2.5.2. Products
- 16.2.5.3. SWOT Analysis
- 16.2.5.4. Recent Developments
- 16.2.5.5. Financials (Based on Availability)
- 16.2.6 Groendyke Transport Inc
- 16.2.6.1. Overview
- 16.2.6.2. Products
- 16.2.6.3. SWOT Analysis
- 16.2.6.4. Recent Developments
- 16.2.6.5. Financials (Based on Availability)
- 16.2.7 Martin Transport Inc
- 16.2.7.1. Overview
- 16.2.7.2. Products
- 16.2.7.3. SWOT Analysis
- 16.2.7.4. Recent Developments
- 16.2.7.5. Financials (Based on Availability)
- 16.2.8 Florida Rock & Tank Lines Inc **List Not Exhaustive 7 3 Other Companies (Slay Transportation Co Inc Apex Logistics LLC Mission Petroleum Carriers Genox Transportation Inc J&M Tank Lines Inc CLI Transport LP Tidewater Transit Co Inc Herman R Ewell Inc Service Transport Company Schilli Bulk Carriers Group Andrews Logistics and CTL Transportation LLC
- 16.2.8.1. Overview
- 16.2.8.2. Products
- 16.2.8.3. SWOT Analysis
- 16.2.8.4. Recent Developments
- 16.2.8.5. Financials (Based on Availability)
- 16.2.9 Eagle Transport Corp
- 16.2.9.1. Overview
- 16.2.9.2. Products
- 16.2.9.3. SWOT Analysis
- 16.2.9.4. Recent Developments
- 16.2.9.5. Financials (Based on Availability)
- 16.2.10 Ruan Transportation Management Systems
- 16.2.10.1. Overview
- 16.2.10.2. Products
- 16.2.10.3. SWOT Analysis
- 16.2.10.4. Recent Developments
- 16.2.10.5. Financials (Based on Availability)
- 16.2.11 Kenan Advantage Group
- 16.2.11.1. Overview
- 16.2.11.2. Products
- 16.2.11.3. SWOT Analysis
- 16.2.11.4. Recent Developments
- 16.2.11.5. Financials (Based on Availability)
- 16.2.12 Dupre Logistics LLC
- 16.2.12.1. Overview
- 16.2.12.2. Products
- 16.2.12.3. SWOT Analysis
- 16.2.12.4. Recent Developments
- 16.2.12.5. Financials (Based on Availability)
- 16.2.1 Trimac Transportation Inc
List of Figures
- Figure 1: Global USA Tank Trucking Market Revenue Breakdown (Million, %) by Region 2024 & 2032
- Figure 2: United states USA Tank Trucking Market Revenue (Million), by Country 2024 & 2032
- Figure 3: United states USA Tank Trucking Market Revenue Share (%), by Country 2024 & 2032
- Figure 4: North America USA Tank Trucking Market Revenue (Million), by Fleet Type 2024 & 2032
- Figure 5: North America USA Tank Trucking Market Revenue Share (%), by Fleet Type 2024 & 2032
- Figure 6: North America USA Tank Trucking Market Revenue (Million), by Capacity 2024 & 2032
- Figure 7: North America USA Tank Trucking Market Revenue Share (%), by Capacity 2024 & 2032
- Figure 8: North America USA Tank Trucking Market Revenue (Million), by Product Category 2024 & 2032
- Figure 9: North America USA Tank Trucking Market Revenue Share (%), by Product Category 2024 & 2032
- Figure 10: North America USA Tank Trucking Market Revenue (Million), by Country 2024 & 2032
- Figure 11: North America USA Tank Trucking Market Revenue Share (%), by Country 2024 & 2032
- Figure 12: South America USA Tank Trucking Market Revenue (Million), by Fleet Type 2024 & 2032
- Figure 13: South America USA Tank Trucking Market Revenue Share (%), by Fleet Type 2024 & 2032
- Figure 14: South America USA Tank Trucking Market Revenue (Million), by Capacity 2024 & 2032
- Figure 15: South America USA Tank Trucking Market Revenue Share (%), by Capacity 2024 & 2032
- Figure 16: South America USA Tank Trucking Market Revenue (Million), by Product Category 2024 & 2032
- Figure 17: South America USA Tank Trucking Market Revenue Share (%), by Product Category 2024 & 2032
- Figure 18: South America USA Tank Trucking Market Revenue (Million), by Country 2024 & 2032
- Figure 19: South America USA Tank Trucking Market Revenue Share (%), by Country 2024 & 2032
- Figure 20: Europe USA Tank Trucking Market Revenue (Million), by Fleet Type 2024 & 2032
- Figure 21: Europe USA Tank Trucking Market Revenue Share (%), by Fleet Type 2024 & 2032
- Figure 22: Europe USA Tank Trucking Market Revenue (Million), by Capacity 2024 & 2032
- Figure 23: Europe USA Tank Trucking Market Revenue Share (%), by Capacity 2024 & 2032
- Figure 24: Europe USA Tank Trucking Market Revenue (Million), by Product Category 2024 & 2032
- Figure 25: Europe USA Tank Trucking Market Revenue Share (%), by Product Category 2024 & 2032
- Figure 26: Europe USA Tank Trucking Market Revenue (Million), by Country 2024 & 2032
- Figure 27: Europe USA Tank Trucking Market Revenue Share (%), by Country 2024 & 2032
- Figure 28: Middle East & Africa USA Tank Trucking Market Revenue (Million), by Fleet Type 2024 & 2032
- Figure 29: Middle East & Africa USA Tank Trucking Market Revenue Share (%), by Fleet Type 2024 & 2032
- Figure 30: Middle East & Africa USA Tank Trucking Market Revenue (Million), by Capacity 2024 & 2032
- Figure 31: Middle East & Africa USA Tank Trucking Market Revenue Share (%), by Capacity 2024 & 2032
- Figure 32: Middle East & Africa USA Tank Trucking Market Revenue (Million), by Product Category 2024 & 2032
- Figure 33: Middle East & Africa USA Tank Trucking Market Revenue Share (%), by Product Category 2024 & 2032
- Figure 34: Middle East & Africa USA Tank Trucking Market Revenue (Million), by Country 2024 & 2032
- Figure 35: Middle East & Africa USA Tank Trucking Market Revenue Share (%), by Country 2024 & 2032
- Figure 36: Asia Pacific USA Tank Trucking Market Revenue (Million), by Fleet Type 2024 & 2032
- Figure 37: Asia Pacific USA Tank Trucking Market Revenue Share (%), by Fleet Type 2024 & 2032
- Figure 38: Asia Pacific USA Tank Trucking Market Revenue (Million), by Capacity 2024 & 2032
- Figure 39: Asia Pacific USA Tank Trucking Market Revenue Share (%), by Capacity 2024 & 2032
- Figure 40: Asia Pacific USA Tank Trucking Market Revenue (Million), by Product Category 2024 & 2032
- Figure 41: Asia Pacific USA Tank Trucking Market Revenue Share (%), by Product Category 2024 & 2032
- Figure 42: Asia Pacific USA Tank Trucking Market Revenue (Million), by Country 2024 & 2032
- Figure 43: Asia Pacific USA Tank Trucking Market Revenue Share (%), by Country 2024 & 2032
List of Tables
- Table 1: Global USA Tank Trucking Market Revenue Million Forecast, by Region 2019 & 2032
- Table 2: Global USA Tank Trucking Market Revenue Million Forecast, by Fleet Type 2019 & 2032
- Table 3: Global USA Tank Trucking Market Revenue Million Forecast, by Capacity 2019 & 2032
- Table 4: Global USA Tank Trucking Market Revenue Million Forecast, by Product Category 2019 & 2032
- Table 5: Global USA Tank Trucking Market Revenue Million Forecast, by Region 2019 & 2032
- Table 6: Global USA Tank Trucking Market Revenue Million Forecast, by Country 2019 & 2032
- Table 7: Northeast USA Tank Trucking Market Revenue (Million) Forecast, by Application 2019 & 2032
- Table 8: Southeast USA Tank Trucking Market Revenue (Million) Forecast, by Application 2019 & 2032
- Table 9: Midwest USA Tank Trucking Market Revenue (Million) Forecast, by Application 2019 & 2032
- Table 10: Southwest USA Tank Trucking Market Revenue (Million) Forecast, by Application 2019 & 2032
- Table 11: West USA Tank Trucking Market Revenue (Million) Forecast, by Application 2019 & 2032
- Table 12: Global USA Tank Trucking Market Revenue Million Forecast, by Fleet Type 2019 & 2032
- Table 13: Global USA Tank Trucking Market Revenue Million Forecast, by Capacity 2019 & 2032
- Table 14: Global USA Tank Trucking Market Revenue Million Forecast, by Product Category 2019 & 2032
- Table 15: Global USA Tank Trucking Market Revenue Million Forecast, by Country 2019 & 2032
- Table 16: United States USA Tank Trucking Market Revenue (Million) Forecast, by Application 2019 & 2032
- Table 17: Canada USA Tank Trucking Market Revenue (Million) Forecast, by Application 2019 & 2032
- Table 18: Mexico USA Tank Trucking Market Revenue (Million) Forecast, by Application 2019 & 2032
- Table 19: Global USA Tank Trucking Market Revenue Million Forecast, by Fleet Type 2019 & 2032
- Table 20: Global USA Tank Trucking Market Revenue Million Forecast, by Capacity 2019 & 2032
- Table 21: Global USA Tank Trucking Market Revenue Million Forecast, by Product Category 2019 & 2032
- Table 22: Global USA Tank Trucking Market Revenue Million Forecast, by Country 2019 & 2032
- Table 23: Brazil USA Tank Trucking Market Revenue (Million) Forecast, by Application 2019 & 2032
- Table 24: Argentina USA Tank Trucking Market Revenue (Million) Forecast, by Application 2019 & 2032
- Table 25: Rest of South America USA Tank Trucking Market Revenue (Million) Forecast, by Application 2019 & 2032
- Table 26: Global USA Tank Trucking Market Revenue Million Forecast, by Fleet Type 2019 & 2032
- Table 27: Global USA Tank Trucking Market Revenue Million Forecast, by Capacity 2019 & 2032
- Table 28: Global USA Tank Trucking Market Revenue Million Forecast, by Product Category 2019 & 2032
- Table 29: Global USA Tank Trucking Market Revenue Million Forecast, by Country 2019 & 2032
- Table 30: United Kingdom USA Tank Trucking Market Revenue (Million) Forecast, by Application 2019 & 2032
- Table 31: Germany USA Tank Trucking Market Revenue (Million) Forecast, by Application 2019 & 2032
- Table 32: France USA Tank Trucking Market Revenue (Million) Forecast, by Application 2019 & 2032
- Table 33: Italy USA Tank Trucking Market Revenue (Million) Forecast, by Application 2019 & 2032
- Table 34: Spain USA Tank Trucking Market Revenue (Million) Forecast, by Application 2019 & 2032
- Table 35: Russia USA Tank Trucking Market Revenue (Million) Forecast, by Application 2019 & 2032
- Table 36: Benelux USA Tank Trucking Market Revenue (Million) Forecast, by Application 2019 & 2032
- Table 37: Nordics USA Tank Trucking Market Revenue (Million) Forecast, by Application 2019 & 2032
- Table 38: Rest of Europe USA Tank Trucking Market Revenue (Million) Forecast, by Application 2019 & 2032
- Table 39: Global USA Tank Trucking Market Revenue Million Forecast, by Fleet Type 2019 & 2032
- Table 40: Global USA Tank Trucking Market Revenue Million Forecast, by Capacity 2019 & 2032
- Table 41: Global USA Tank Trucking Market Revenue Million Forecast, by Product Category 2019 & 2032
- Table 42: Global USA Tank Trucking Market Revenue Million Forecast, by Country 2019 & 2032
- Table 43: Turkey USA Tank Trucking Market Revenue (Million) Forecast, by Application 2019 & 2032
- Table 44: Israel USA Tank Trucking Market Revenue (Million) Forecast, by Application 2019 & 2032
- Table 45: GCC USA Tank Trucking Market Revenue (Million) Forecast, by Application 2019 & 2032
- Table 46: North Africa USA Tank Trucking Market Revenue (Million) Forecast, by Application 2019 & 2032
- Table 47: South Africa USA Tank Trucking Market Revenue (Million) Forecast, by Application 2019 & 2032
- Table 48: Rest of Middle East & Africa USA Tank Trucking Market Revenue (Million) Forecast, by Application 2019 & 2032
- Table 49: Global USA Tank Trucking Market Revenue Million Forecast, by Fleet Type 2019 & 2032
- Table 50: Global USA Tank Trucking Market Revenue Million Forecast, by Capacity 2019 & 2032
- Table 51: Global USA Tank Trucking Market Revenue Million Forecast, by Product Category 2019 & 2032
- Table 52: Global USA Tank Trucking Market Revenue Million Forecast, by Country 2019 & 2032
- Table 53: China USA Tank Trucking Market Revenue (Million) Forecast, by Application 2019 & 2032
- Table 54: India USA Tank Trucking Market Revenue (Million) Forecast, by Application 2019 & 2032
- Table 55: Japan USA Tank Trucking Market Revenue (Million) Forecast, by Application 2019 & 2032
- Table 56: South Korea USA Tank Trucking Market Revenue (Million) Forecast, by Application 2019 & 2032
- Table 57: ASEAN USA Tank Trucking Market Revenue (Million) Forecast, by Application 2019 & 2032
- Table 58: Oceania USA Tank Trucking Market Revenue (Million) Forecast, by Application 2019 & 2032
- Table 59: Rest of Asia Pacific USA Tank Trucking Market Revenue (Million) Forecast, by Application 2019 & 2032
Frequently Asked Questions
1. What is the projected Compound Annual Growth Rate (CAGR) of the USA Tank Trucking Market?
The projected CAGR is approximately 3.42%.
2. Which companies are prominent players in the USA Tank Trucking Market?
Key companies in the market include Trimac Transportation Inc, Foodliner/Quest Liner Inc, Tankstar USA, Superior Bulk Logistics Inc, Miller Transporters Inc, Groendyke Transport Inc, Martin Transport Inc, Florida Rock & Tank Lines Inc **List Not Exhaustive 7 3 Other Companies (Slay Transportation Co Inc Apex Logistics LLC Mission Petroleum Carriers Genox Transportation Inc J&M Tank Lines Inc CLI Transport LP Tidewater Transit Co Inc Herman R Ewell Inc Service Transport Company Schilli Bulk Carriers Group Andrews Logistics and CTL Transportation LLC, Eagle Transport Corp, Ruan Transportation Management Systems, Kenan Advantage Group, Dupre Logistics LLC.
3. What are the main segments of the USA Tank Trucking Market?
The market segments include Fleet Type, Capacity, Product Category.
4. Can you provide details about the market size?
The market size is estimated to be USD 59.69 Million as of 2022.
5. What are some drivers contributing to market growth?
Rise in Demand for Oil and Natural Gas; Technological Advancements.
6. What are the notable trends driving market growth?
Fuel Tank Trailers as Petroleum Carriers are Boosting the Market's Growth in the United States.
7. Are there any restraints impacting market growth?
Increasing Regulatory Burden and Compliance Costs; Volatility of Fuel Prices.
8. Can you provide examples of recent developments in the market?
February 2024: Kenan Advantage Group, the largest tank truck transporter and logistics provider in North America, acquired Northern Dry Bulk, a company specializing in the transportation and storage of plastic resins for clients in the automotive, packaging, and electronics sectors across the United States and Canada. This acquisition brought 36 tractors, 91 trailers, and two terminals with two maintenance bays, along with warehouse space and trans-loading capabilities, into the KAG portfolio.
9. What pricing options are available for accessing the report?
Pricing options include single-user, multi-user, and enterprise licenses priced at USD 3800, USD 4500, and USD 5800 respectively.
10. Is the market size provided in terms of value or volume?
The market size is provided in terms of value, measured in Million.
11. Are there any specific market keywords associated with the report?
Yes, the market keyword associated with the report is "USA Tank Trucking Market," which aids in identifying and referencing the specific market segment covered.
12. How do I determine which pricing option suits my needs best?
The pricing options vary based on user requirements and access needs. Individual users may opt for single-user licenses, while businesses requiring broader access may choose multi-user or enterprise licenses for cost-effective access to the report.
13. Are there any additional resources or data provided in the USA Tank Trucking Market report?
While the report offers comprehensive insights, it's advisable to review the specific contents or supplementary materials provided to ascertain if additional resources or data are available.
14. How can I stay updated on further developments or reports in the USA Tank Trucking Market?
To stay informed about further developments, trends, and reports in the USA Tank Trucking Market, consider subscribing to industry newsletters, following relevant companies and organizations, or regularly checking reputable industry news sources and publications.
Methodology
Step 1 - Identification of Relevant Samples Size from Population Database


Step 2 - Approaches for Defining Global Market Size (Value, Volume* & Price*)

Note*: In applicable scenarios
Step 3 - Data Sources
Primary Research
- Web Analytics
- Survey Reports
- Research Institute
- Latest Research Reports
- Opinion Leaders
Secondary Research
- Annual Reports
- White Paper
- Latest Press Release
- Industry Association
- Paid Database
- Investor Presentations

Step 4 - Data Triangulation
Involves using different sources of information in order to increase the validity of a study
These sources are likely to be stakeholders in a program - participants, other researchers, program staff, other community members, and so on.
Then we put all data in single framework & apply various statistical tools to find out the dynamic on the market.
During the analysis stage, feedback from the stakeholder groups would be compared to determine areas of agreement as well as areas of divergence
