

Key Insights
The USA Protein Industry is a dynamic and expanding sector, projected to reach $6.3 billion in 2024, with a robust Compound Annual Growth Rate (CAGR) of 4.1% anticipated over the forecast period. This growth is propelled by an increasing consumer demand for protein-rich products, driven by a heightened awareness of health and wellness, particularly in the areas of sports nutrition and dietary supplementation. The rising popularity of plant-based diets and the subsequent demand for diverse protein sources like pea, soy, and hemp proteins are significantly shaping market trends. Furthermore, the animal feed sector continues to be a substantial contributor, with ongoing innovation in animal nutrition demanding specialized protein ingredients. The expansion of functional foods and beverages, incorporating protein for added health benefits, is also a key driver, signaling a shift towards more health-conscious consumption patterns across various demographics.
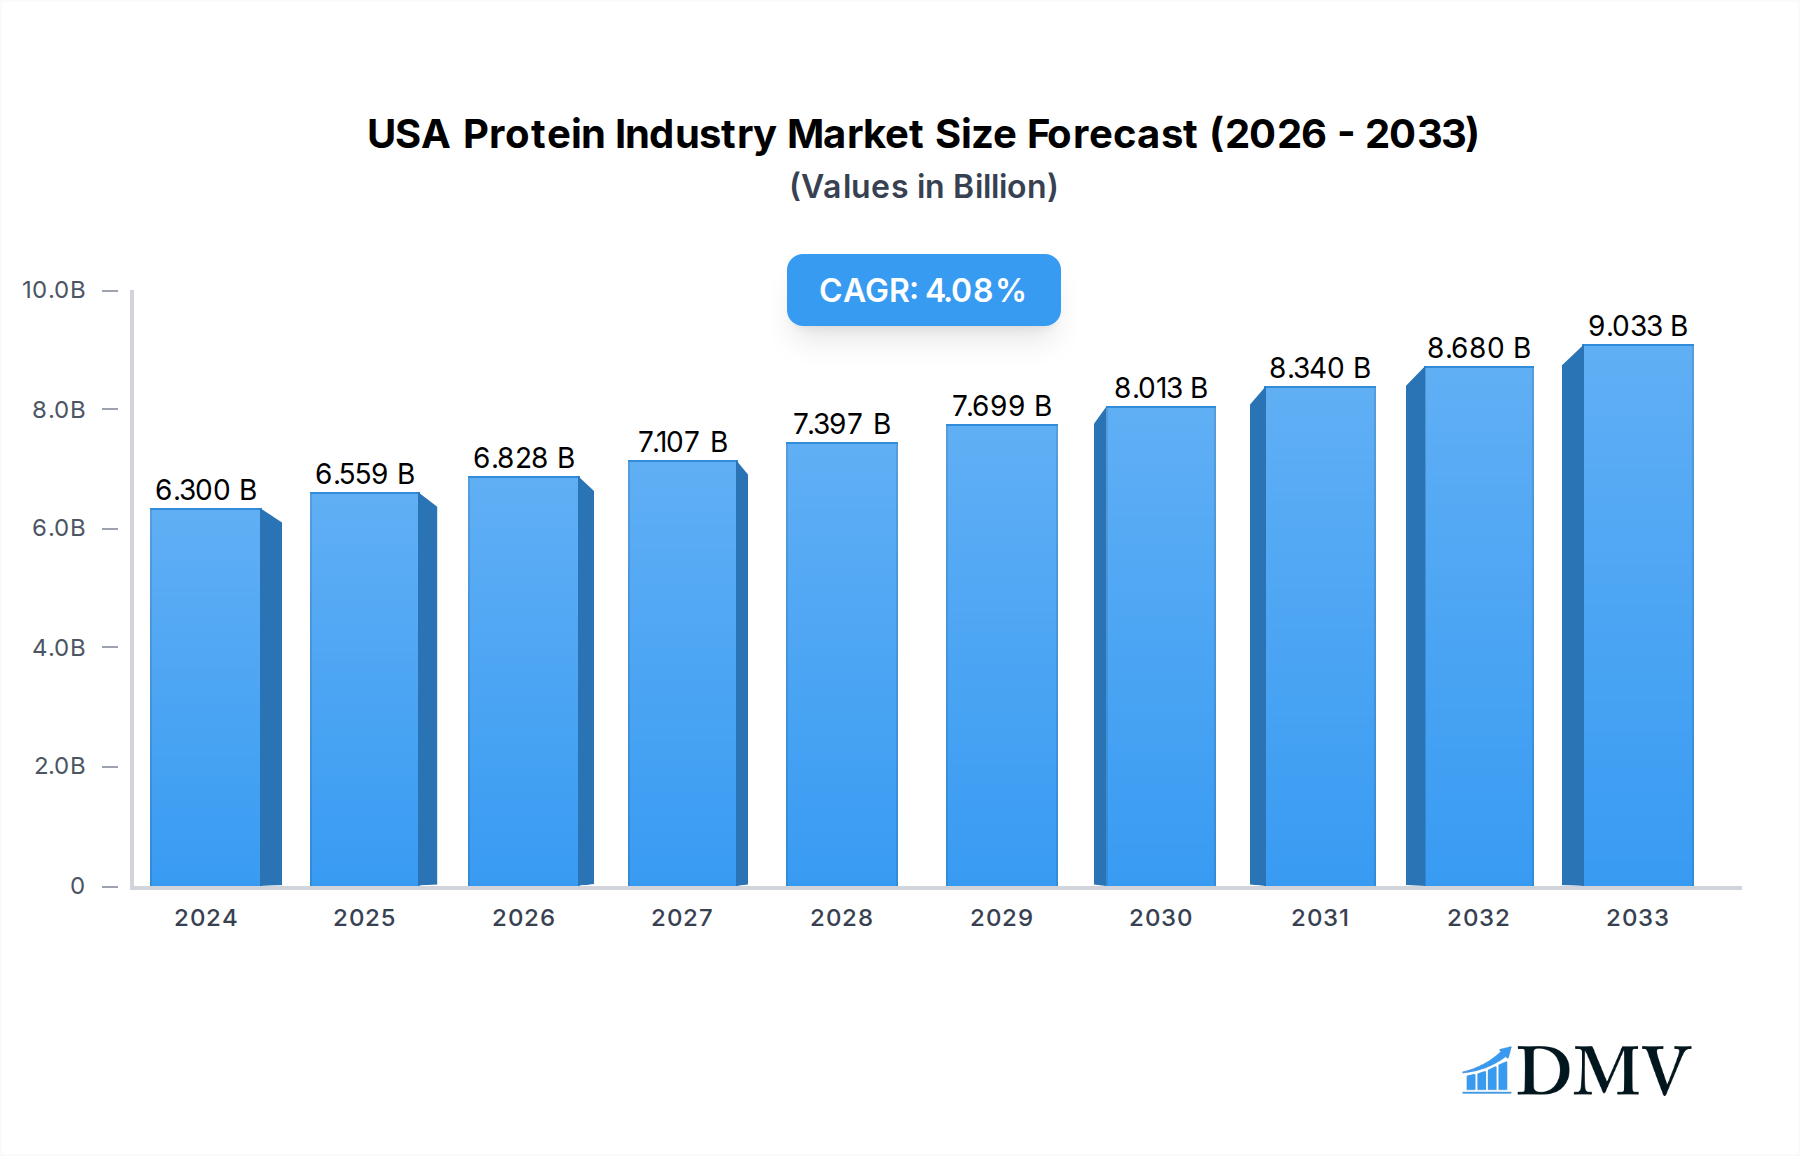
USA Protein Industry Market Size (In Billion)
The market's expansion is further supported by advancements in processing technologies that enable the extraction and formulation of novel protein ingredients. However, certain factors can influence this growth trajectory. Fluctuations in raw material prices, supply chain disruptions, and evolving regulatory landscapes present potential challenges. Nevertheless, the overall outlook remains positive, with significant opportunities arising from the growing elderly population's need for specialized nutrition and the increasing demand for natural and sustainable protein sources in both food and personal care applications. The continued innovation in the development of alternative protein sources, including insect protein and microbial proteins, is set to diversify the market and cater to a wider range of consumer preferences and sustainability goals, further solidifying the industry's upward trend.

USA Protein Industry Company Market Share
USA Protein Industry Market Composition & Trends
The USA protein industry is a dynamic and evolving sector, characterized by a moderate market concentration with several key players holding significant shares. Innovation is a primary catalyst, driven by advancements in food technology, biotechnology, and a growing consumer demand for healthier and more sustainable protein sources. Regulatory landscapes, including food safety standards and labeling requirements, play a crucial role in shaping market access and product development. The emergence of alternative protein sources, such as plant-based and microbial proteins, presents both opportunities and challenges in terms of consumer acceptance and scalability. End-user profiles are increasingly diverse, encompassing the animal feed sector, a robust food and beverage industry with sub-segments like dairy alternatives and meat substitutes, the growing supplements market catering to specific nutritional needs, and a niche in personal care and cosmetics. Mergers and acquisitions (M&A) activity is notable, with significant deal values in the billions of dollars, reflecting consolidation and strategic expansion within the industry. For instance, the recent Darling Ingredients expansion in August 2021, focusing on poultry conversion, signifies an M&A driven effort to bolster protein supply. Market share distribution within the US protein market is influenced by the dominance of animal-derived proteins, particularly whey and casein, though plant-based proteins are rapidly gaining traction. The overall M&A deal value in the USA protein industry is estimated to be in the tens of billions of dollars, with ongoing consolidation and strategic partnerships reshaping the competitive landscape.
USA Protein Industry Industry Evolution
The USA protein industry has witnessed substantial evolution over the historical period of 2019–2024, propelled by a confluence of technological advancements, shifting consumer preferences, and a heightened awareness of health and sustainability. The market has transitioned from a primarily animal-protein-centric landscape to one embracing a more diversified portfolio, with plant-based and microbial proteins gaining significant traction. This evolution is underscored by a projected market growth trajectory, with the base year of 2025 setting the stage for robust expansion through the forecast period of 2025–2033. Technological advancements in extraction, processing, and formulation have been instrumental in enhancing the appeal and functionality of novel protein sources, making them more competitive with traditional options. For example, advancements in pea protein processing have improved its texture and flavor profile, driving its adoption in a wider range of food and beverage applications. Consumer demand has been a pivotal force, with a growing segment of the population actively seeking protein-rich products for health and wellness, sports nutrition, and weight management. This demand is further amplified by a rising awareness of the environmental impact of food production, leading to increased interest in sustainable protein alternatives. The rise of veganism and flexitarianism has directly translated into a surge in the market for plant-based protein ingredients, such as soy, pea, and hemp protein. Adoption metrics for plant-based protein ingredients have shown year-over-year growth exceeding 15%, illustrating this significant shift. The supplement sector, particularly sport and performance nutrition, has seen a consistent annual growth rate of approximately 8–10%, driven by athletes and fitness enthusiasts seeking to optimize their dietary intake. The food and beverage segment, encompassing dairy and dairy alternatives, meat and meat alternatives, and bakery products, has experienced an average growth of 7% annually, with dairy alternatives exhibiting the highest growth within this category. The industry has effectively responded to these evolving demands through product innovation and strategic investments, evidenced by the continuous launch of new protein-fortified products and the expansion of manufacturing capabilities. The market size for protein ingredients in the USA, estimated at approximately $30 billion in the base year of 2025, is projected to reach over $50 billion by 2033, reflecting a Compound Annual Growth Rate (CAGR) of approximately 6.5% during the forecast period. This sustained growth is a testament to the industry's adaptability and its ability to meet the evolving needs of a health-conscious and environmentally aware consumer base.
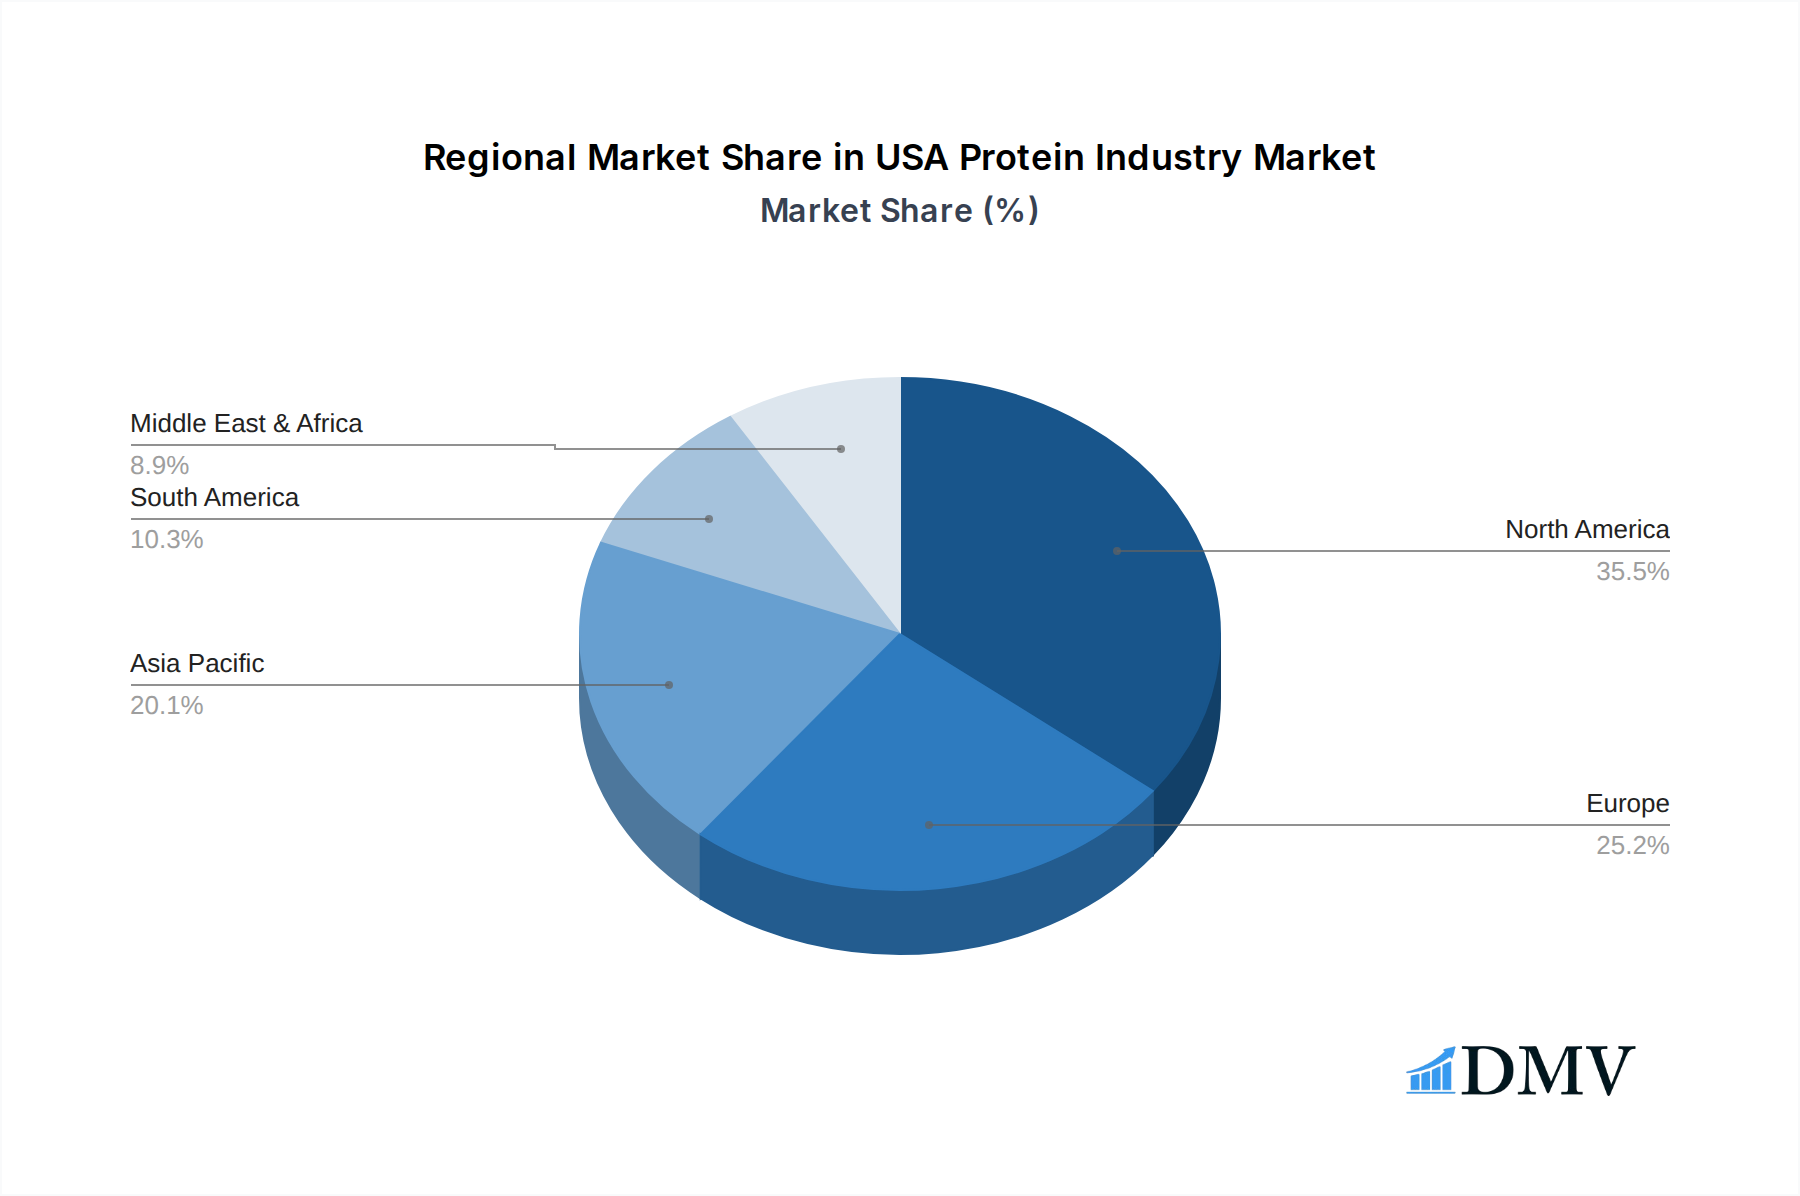
Leading Regions, Countries, or Segments in USA Protein Industry
The USA protein industry exhibits significant regional and segmental dominance, with specific areas and categories leading in market share and growth potential. Within the Source: Plant segment, Pea Protein has emerged as a frontrunner, driven by its favorable nutritional profile, allergen-free status compared to soy, and its versatility in applications ranging from plant-based meat alternatives to sports nutrition supplements. The United States, as a major consumer market, naturally leads in the overall consumption and production of a wide array of protein types.
Dominant Segment: Plant-Based Proteins (Pea Protein):
- Key Drivers:
- Growing Consumer Demand for Sustainable and Ethical Food Choices: A significant portion of the US population is actively seeking plant-based alternatives due to environmental and ethical concerns associated with animal agriculture.
- Allergen-Free Properties: Pea protein offers a viable alternative for individuals with allergies to common proteins like soy or gluten.
- Technological Advancements: Improved processing techniques have enhanced the taste, texture, and solubility of pea protein, making it more appealing for a broader range of food applications.
- Investment in R&D: Substantial investments by companies like Ingredion Incorporated and Archer Daniels Midland Company in developing and scaling up plant-based protein production have fueled its growth.
- Regulatory Support and Labeling Clarity: Clearer labeling regulations for plant-based products have fostered consumer trust and market penetration.
- In-depth Analysis of Dominance: The dominance of pea protein within the plant-based segment is a direct reflection of its ability to meet evolving consumer needs and preferences. Its protein content, comparable to animal sources, coupled with a clean label and perceived health benefits, positions it as a go-to ingredient for manufacturers. The substantial investments by leading food ingredient companies in research and development for pea protein extraction and refinement have also been critical. Furthermore, the increasing availability of pea protein isolates and concentrates with improved functional properties further solidifies its leading position. The market for pea protein in the USA is projected to grow at a CAGR of over 10% during the forecast period, significantly outpacing other protein sources.
- Key Drivers:
Dominant End User Segment: Food and Beverages (Meat/Poultry/Seafood and Meat Alternative Products):
- Key Drivers:
- Flexitarian and Vegan Consumerism: The rise of flexitarian diets (reducing meat consumption) and veganism has created a massive demand for plant-based meat alternatives.
- Innovation in Product Development: Manufacturers are continuously launching innovative meat alternative products that mimic the taste, texture, and cooking experience of traditional meat.
- Health and Wellness Trends: Consumers are seeking protein-rich options that are perceived as healthier, and meat alternatives often position themselves as such.
- Favorable Market Penetration: This sub-segment has witnessed widespread adoption across major grocery retailers and food service providers.
- In-depth Analysis of Dominance: The "Meat/Poultry/Seafood and Meat Alternative Products" sub-segment within the Food and Beverages end-user category is currently the largest and fastest-growing in the USA protein industry. This is largely attributable to the significant shift in dietary habits, with consumers increasingly opting for plant-based alternatives to reduce their meat consumption. The development of sophisticated plant-based burgers, sausages, and other meat analogues that closely replicate the sensory attributes of animal proteins has been a key factor. Companies like Impossible Foods and Beyond Meat, though not explicitly listed in the provided company list, represent the innovation driving this space, and their success has spurred further investment and development from larger players. The projected market size for meat alternatives in the USA is expected to reach upwards of $10 billion by 2030, demonstrating its significant economic impact and dominance within the broader food and beverage sector.
- Key Drivers:
Leading Region: North America (United States):
- Key Drivers:
- High Disposable Income and Consumer Spending: The United States possesses a large consumer base with significant purchasing power, enabling higher spending on premium and specialized food products, including protein supplements and functional foods.
- Established Food and Beverage Industry: A mature and innovative food and beverage manufacturing sector readily incorporates new protein ingredients into diverse product lines.
- Strong Sports Nutrition and Health Consciousness: A culture that emphasizes fitness and wellness drives demand for protein supplements and fortified products.
- Advancements in Biotechnology and Agriculture: The US is at the forefront of research and development in protein extraction, processing, and cultivation, supporting the growth of diverse protein sources.
- In-depth Analysis of Dominance: North America, with the United States at its core, is the leading region for the protein industry due to a combination of robust consumer demand, a highly developed industrial infrastructure, and a proactive approach to innovation. The sheer size of the US market, coupled with a strong emphasis on health, fitness, and dietary innovation, creates a fertile ground for all types of protein products. The presence of major global food and ingredient manufacturers, along with a vibrant startup ecosystem focused on alternative proteins, further solidifies its leadership. The regulatory environment, while stringent, is also conducive to product development and market entry for scientifically sound and safe protein innovations.
- Key Drivers:
USA Protein Industry Product Innovations
The USA protein industry is experiencing a surge in product innovations aimed at enhancing functionality, improving taste and texture, and catering to evolving consumer needs. Recent advancements include the development of novel protein blends for optimized amino acid profiles in supplements, such as Optimum Nutrition's Gold Standard Protein Shake launched in August 2022, offering 24 grams of protein in convenient RTD formats. In the plant-based sector, innovations are focused on creating highly palatable and versatile ingredients derived from sources like fava beans and chickpeas to improve the sensory experience of meat alternatives and dairy-free products. Furthermore, the encapsulation technology for proteins is being refined to enhance stability and controlled release in various applications, from functional foods to cosmetics. The development of allergen-free and non-GMO protein ingredients continues to be a key focus, expanding the market reach and appeal of protein products.
Propelling Factors for USA Protein Industry Growth
Several key factors are propelling the growth of the USA protein industry. Technologically, advancements in processing and extraction methods are enabling the creation of more diverse and functional protein ingredients from both traditional and novel sources. Economically, rising disposable incomes and a growing middle class are driving increased consumer spending on health and wellness products, including protein supplements and fortified foods. Furthermore, the expanding global demand for sustainable and ethical food options is significantly benefiting plant-based and alternative protein sectors. Regulatory influences are also playing a role, with an increasing emphasis on food safety and labeling standards that foster consumer trust and encourage market entry for compliant products. The sustained interest in sports nutrition and the aging population's need for specialized dietary solutions further contribute to market expansion.
Obstacles in the USA Protein Industry Market
Despite its robust growth, the USA protein industry faces several obstacles. Regulatory challenges, particularly concerning novel food approvals and differing labeling standards for alternative proteins, can create market entry barriers. Supply chain disruptions, as witnessed with recent global events impacting agricultural output and logistics, can affect the availability and cost of raw materials for protein production. Competitive pressures are intense, with established players and emerging startups vying for market share, often leading to price volatility. Furthermore, overcoming consumer skepticism and palatability concerns for certain novel protein sources, such as insect protein, remains a significant hurdle. The cost of production for some alternative proteins can also be higher than traditional sources, impacting affordability and wider adoption.
Future Opportunities in USA Protein Industry
The USA protein industry is ripe with future opportunities. The ongoing expansion of the plant-based protein market, driven by consumer demand for sustainable and ethical food choices, presents a significant avenue for growth. Emerging technologies in precision fermentation and cellular agriculture hold the potential to create novel protein sources with reduced environmental impact and enhanced nutritional profiles. The personalized nutrition trend, driven by advancements in genomics and health tracking, opens doors for customized protein formulations catering to specific individual needs. Furthermore, the burgeoning markets for animal feed fortification and medical nutrition for elderly and at-risk populations offer substantial growth prospects. Exploring new applications in the personal care and cosmetics sectors for protein-derived ingredients also represents an untapped potential.
Major Players in the USA Protein Industry Ecosystem
- CHS Inc
- Darling Ingredients Inc
- MGP
- Arla Foods amba
- Gelita AG
- AMCO Proteins
- International Flavors & Fragrances Inc
- Archer Daniels Midland Company
- Glanbia PLC
- Ajinomoto Co Inc
- Bunge Limited
- Roquette Frères
- Agropur Dairy Cooperative
- Kerry Group PLC
- Farbest-Tallman Foods Corporation
- Fonterra Co-operative Group Limited
- Ingredion Incorporated
- Corbion NV
- Südzucker Group
Key Developments in USA Protein Industry Industry
- August 2022: Optimum Nutrition announced the launch of its new Gold Standard Protein Shake. The RTD is available in chocolate and vanilla flavors, and formulated with 24 grams of protein per serving, impacting the ready-to-drink supplement market.
- June 2022: Fonterra JV has entered into a joint venture with Tillamook Country Creamery Association (TCCA) and a three-mile canyon farm in the United States to launch Pro-Optima TM, a grade A functional whey protein concentrate (fWPC), bolstering the supply of high-quality dairy-based protein ingredients.
- August 2021: Darling Ingredients expanded its existing manufacturing facility that includes Nebraska’s first operation dedicated solely to poultry conversion. This expanded manufacturing unit may also facilitate protein conversion, enhancing the availability and processing capabilities for animal-derived proteins.
Strategic USA Protein Industry Market Forecast
The USA protein industry is poised for significant growth in the coming years, driven by a robust combination of escalating consumer demand for healthier and more sustainable food options, continuous technological innovation, and favorable market trends. The increasing adoption of plant-based proteins, fueled by health-conscious consumers and environmental awareness, will remain a primary growth catalyst. Strategic investments in research and development for novel protein sources, coupled with enhanced processing technologies, will unlock new market opportunities and improve the cost-effectiveness of alternative proteins. The expanding sports nutrition and functional food segments, alongside the growing need for specialized nutritional solutions for aging populations, will further propel market expansion. The industry's ability to adapt to evolving consumer preferences and navigate regulatory landscapes will be crucial for realizing its full market potential, with projections indicating a sustained CAGR of approximately 6.5% through 2033.
USA Protein Industry Segmentation
-
1. Source
-
1.1. Animal
-
1.1.1. By Protein Type
- 1.1.1.1. Casein and Caseinates
- 1.1.1.2. Collagen
- 1.1.1.3. Egg Protein
- 1.1.1.4. Gelatin
- 1.1.1.5. Insect Protein
- 1.1.1.6. Milk Protein
- 1.1.1.7. Whey Protein
- 1.1.1.8. Other Animal Protein
-
1.1.1. By Protein Type
-
1.2. Microbial
- 1.2.1. Algae Protein
- 1.2.2. Mycoprotein
-
1.3. Plant
- 1.3.1. Hemp Protein
- 1.3.2. Pea Protein
- 1.3.3. Potato Protein
- 1.3.4. Rice Protein
- 1.3.5. Soy Protein
- 1.3.6. Wheat Protein
- 1.3.7. Other Plant Protein
-
1.1. Animal
-
2. End User
- 2.1. Animal Feed
-
2.2. Food and Beverages
-
2.2.1. By Sub End User
- 2.2.1.1. Bakery
- 2.2.1.2. Breakfast Cereals
- 2.2.1.3. Condiments/Sauces
- 2.2.1.4. Confectionery
- 2.2.1.5. Dairy and Dairy Alternative Products
- 2.2.1.6. Meat/Poultry/Seafood and Meat Alternative Products
- 2.2.1.7. RTE/RTC Food Products
- 2.2.1.8. Snacks
-
2.2.1. By Sub End User
- 2.3. Personal Care and Cosmetics
-
2.4. Supplements
- 2.4.1. Baby Food and Infant Formula
- 2.4.2. Elderly Nutrition and Medical Nutrition
- 2.4.3. Sport/Performance Nutrition
USA Protein Industry Segmentation By Geography
-
1. North America
- 1.1. United States
- 1.2. Canada
- 1.3. Mexico
-
2. South America
- 2.1. Brazil
- 2.2. Argentina
- 2.3. Rest of South America
-
3. Europe
- 3.1. United Kingdom
- 3.2. Germany
- 3.3. France
- 3.4. Italy
- 3.5. Spain
- 3.6. Russia
- 3.7. Benelux
- 3.8. Nordics
- 3.9. Rest of Europe
-
4. Middle East & Africa
- 4.1. Turkey
- 4.2. Israel
- 4.3. GCC
- 4.4. North Africa
- 4.5. South Africa
- 4.6. Rest of Middle East & Africa
-
5. Asia Pacific
- 5.1. China
- 5.2. India
- 5.3. Japan
- 5.4. South Korea
- 5.5. ASEAN
- 5.6. Oceania
- 5.7. Rest of Asia Pacific
USA Protein Industry Regional Market Share
Geographic Coverage of USA Protein Industry
USA Protein Industry REPORT HIGHLIGHTS
| Aspects | Details |
|---|---|
| Study Period | 2020-2034 |
| Base Year | 2025 |
| Estimated Year | 2026 |
| Forecast Period | 2026-2034 |
| Historical Period | 2020-2025 |
| Growth Rate | CAGR of 10.3% from 2020-2034 |
| Segmentation |
|
Table of Contents
- 1. Introduction
- 1.1. Research Scope
- 1.2. Market Segmentation
- 1.3. Research Objective
- 1.4. Definitions and Assumptions
- 2. Executive Summary
- 2.1. Market Snapshot
- 3. Market Dynamics
- 3.1. Market Drivers
- 3.2. Market Restrains
- 3.3. Market Trends
- 3.4. Market Opportunities
- 4. Market Factor Analysis
- 4.1. Porters Five Forces
- 4.1.1. Bargaining Power of Suppliers
- 4.1.2. Bargaining Power of Buyers
- 4.1.3. Threat of New Entrants
- 4.1.4. Threat of Substitutes
- 4.1.5. Competitive Rivalry
- 4.2. PESTEL analysis
- 4.3. BCG Analysis
- 4.3.1. Stars (High Growth, High Market Share)
- 4.3.2. Cash Cows (Low Growth, High Market Share)
- 4.3.3. Question Mark (High Growth, Low Market Share)
- 4.3.4. Dogs (Low Growth, Low Market Share)
- 4.4. Ansoff Matrix Analysis
- 4.5. Supply Chain Analysis
- 4.6. Regulatory Landscape
- 4.7. Current Market Potential and Opportunity Assessment (TAM–SAM–SOM Framework)
- 4.8. DMV Analyst Note
- 4.1. Porters Five Forces
- 5. Market Analysis, Insights and Forecast 2021-2033
- 5.1. Market Analysis, Insights and Forecast - by Source
- 5.1.1. Animal
- 5.1.1.1. By Protein Type
- 5.1.1.1.1. Casein and Caseinates
- 5.1.1.1.2. Collagen
- 5.1.1.1.3. Egg Protein
- 5.1.1.1.4. Gelatin
- 5.1.1.1.5. Insect Protein
- 5.1.1.1.6. Milk Protein
- 5.1.1.1.7. Whey Protein
- 5.1.1.1.8. Other Animal Protein
- 5.1.1.1. By Protein Type
- 5.1.2. Microbial
- 5.1.2.1. Algae Protein
- 5.1.2.2. Mycoprotein
- 5.1.3. Plant
- 5.1.3.1. Hemp Protein
- 5.1.3.2. Pea Protein
- 5.1.3.3. Potato Protein
- 5.1.3.4. Rice Protein
- 5.1.3.5. Soy Protein
- 5.1.3.6. Wheat Protein
- 5.1.3.7. Other Plant Protein
- 5.1.1. Animal
- 5.2. Market Analysis, Insights and Forecast - by End User
- 5.2.1. Animal Feed
- 5.2.2. Food and Beverages
- 5.2.2.1. By Sub End User
- 5.2.2.1.1. Bakery
- 5.2.2.1.2. Breakfast Cereals
- 5.2.2.1.3. Condiments/Sauces
- 5.2.2.1.4. Confectionery
- 5.2.2.1.5. Dairy and Dairy Alternative Products
- 5.2.2.1.6. Meat/Poultry/Seafood and Meat Alternative Products
- 5.2.2.1.7. RTE/RTC Food Products
- 5.2.2.1.8. Snacks
- 5.2.2.1. By Sub End User
- 5.2.3. Personal Care and Cosmetics
- 5.2.4. Supplements
- 5.2.4.1. Baby Food and Infant Formula
- 5.2.4.2. Elderly Nutrition and Medical Nutrition
- 5.2.4.3. Sport/Performance Nutrition
- 5.3. Market Analysis, Insights and Forecast - by Region
- 5.3.1. North America
- 5.3.2. South America
- 5.3.3. Europe
- 5.3.4. Middle East & Africa
- 5.3.5. Asia Pacific
- 5.1. Market Analysis, Insights and Forecast - by Source
- 6. Global USA Protein Industry Analysis, Insights and Forecast, 2021-2033
- 6.1. Market Analysis, Insights and Forecast - by Source
- 6.1.1. Animal
- 6.1.1.1. By Protein Type
- 6.1.1.1.1. Casein and Caseinates
- 6.1.1.1.2. Collagen
- 6.1.1.1.3. Egg Protein
- 6.1.1.1.4. Gelatin
- 6.1.1.1.5. Insect Protein
- 6.1.1.1.6. Milk Protein
- 6.1.1.1.7. Whey Protein
- 6.1.1.1.8. Other Animal Protein
- 6.1.1.1. By Protein Type
- 6.1.2. Microbial
- 6.1.2.1. Algae Protein
- 6.1.2.2. Mycoprotein
- 6.1.3. Plant
- 6.1.3.1. Hemp Protein
- 6.1.3.2. Pea Protein
- 6.1.3.3. Potato Protein
- 6.1.3.4. Rice Protein
- 6.1.3.5. Soy Protein
- 6.1.3.6. Wheat Protein
- 6.1.3.7. Other Plant Protein
- 6.1.1. Animal
- 6.2. Market Analysis, Insights and Forecast - by End User
- 6.2.1. Animal Feed
- 6.2.2. Food and Beverages
- 6.2.2.1. By Sub End User
- 6.2.2.1.1. Bakery
- 6.2.2.1.2. Breakfast Cereals
- 6.2.2.1.3. Condiments/Sauces
- 6.2.2.1.4. Confectionery
- 6.2.2.1.5. Dairy and Dairy Alternative Products
- 6.2.2.1.6. Meat/Poultry/Seafood and Meat Alternative Products
- 6.2.2.1.7. RTE/RTC Food Products
- 6.2.2.1.8. Snacks
- 6.2.2.1. By Sub End User
- 6.2.3. Personal Care and Cosmetics
- 6.2.4. Supplements
- 6.2.4.1. Baby Food and Infant Formula
- 6.2.4.2. Elderly Nutrition and Medical Nutrition
- 6.2.4.3. Sport/Performance Nutrition
- 6.1. Market Analysis, Insights and Forecast - by Source
- 7. North America USA Protein Industry Analysis, Insights and Forecast, 2020-2032
- 7.1. Market Analysis, Insights and Forecast - by Source
- 7.1.1. Animal
- 7.1.1.1. By Protein Type
- 7.1.1.1.1. Casein and Caseinates
- 7.1.1.1.2. Collagen
- 7.1.1.1.3. Egg Protein
- 7.1.1.1.4. Gelatin
- 7.1.1.1.5. Insect Protein
- 7.1.1.1.6. Milk Protein
- 7.1.1.1.7. Whey Protein
- 7.1.1.1.8. Other Animal Protein
- 7.1.1.1. By Protein Type
- 7.1.2. Microbial
- 7.1.2.1. Algae Protein
- 7.1.2.2. Mycoprotein
- 7.1.3. Plant
- 7.1.3.1. Hemp Protein
- 7.1.3.2. Pea Protein
- 7.1.3.3. Potato Protein
- 7.1.3.4. Rice Protein
- 7.1.3.5. Soy Protein
- 7.1.3.6. Wheat Protein
- 7.1.3.7. Other Plant Protein
- 7.1.1. Animal
- 7.2. Market Analysis, Insights and Forecast - by End User
- 7.2.1. Animal Feed
- 7.2.2. Food and Beverages
- 7.2.2.1. By Sub End User
- 7.2.2.1.1. Bakery
- 7.2.2.1.2. Breakfast Cereals
- 7.2.2.1.3. Condiments/Sauces
- 7.2.2.1.4. Confectionery
- 7.2.2.1.5. Dairy and Dairy Alternative Products
- 7.2.2.1.6. Meat/Poultry/Seafood and Meat Alternative Products
- 7.2.2.1.7. RTE/RTC Food Products
- 7.2.2.1.8. Snacks
- 7.2.2.1. By Sub End User
- 7.2.3. Personal Care and Cosmetics
- 7.2.4. Supplements
- 7.2.4.1. Baby Food and Infant Formula
- 7.2.4.2. Elderly Nutrition and Medical Nutrition
- 7.2.4.3. Sport/Performance Nutrition
- 7.1. Market Analysis, Insights and Forecast - by Source
- 8. South America USA Protein Industry Analysis, Insights and Forecast, 2020-2032
- 8.1. Market Analysis, Insights and Forecast - by Source
- 8.1.1. Animal
- 8.1.1.1. By Protein Type
- 8.1.1.1.1. Casein and Caseinates
- 8.1.1.1.2. Collagen
- 8.1.1.1.3. Egg Protein
- 8.1.1.1.4. Gelatin
- 8.1.1.1.5. Insect Protein
- 8.1.1.1.6. Milk Protein
- 8.1.1.1.7. Whey Protein
- 8.1.1.1.8. Other Animal Protein
- 8.1.1.1. By Protein Type
- 8.1.2. Microbial
- 8.1.2.1. Algae Protein
- 8.1.2.2. Mycoprotein
- 8.1.3. Plant
- 8.1.3.1. Hemp Protein
- 8.1.3.2. Pea Protein
- 8.1.3.3. Potato Protein
- 8.1.3.4. Rice Protein
- 8.1.3.5. Soy Protein
- 8.1.3.6. Wheat Protein
- 8.1.3.7. Other Plant Protein
- 8.1.1. Animal
- 8.2. Market Analysis, Insights and Forecast - by End User
- 8.2.1. Animal Feed
- 8.2.2. Food and Beverages
- 8.2.2.1. By Sub End User
- 8.2.2.1.1. Bakery
- 8.2.2.1.2. Breakfast Cereals
- 8.2.2.1.3. Condiments/Sauces
- 8.2.2.1.4. Confectionery
- 8.2.2.1.5. Dairy and Dairy Alternative Products
- 8.2.2.1.6. Meat/Poultry/Seafood and Meat Alternative Products
- 8.2.2.1.7. RTE/RTC Food Products
- 8.2.2.1.8. Snacks
- 8.2.2.1. By Sub End User
- 8.2.3. Personal Care and Cosmetics
- 8.2.4. Supplements
- 8.2.4.1. Baby Food and Infant Formula
- 8.2.4.2. Elderly Nutrition and Medical Nutrition
- 8.2.4.3. Sport/Performance Nutrition
- 8.1. Market Analysis, Insights and Forecast - by Source
- 9. Europe USA Protein Industry Analysis, Insights and Forecast, 2020-2032
- 9.1. Market Analysis, Insights and Forecast - by Source
- 9.1.1. Animal
- 9.1.1.1. By Protein Type
- 9.1.1.1.1. Casein and Caseinates
- 9.1.1.1.2. Collagen
- 9.1.1.1.3. Egg Protein
- 9.1.1.1.4. Gelatin
- 9.1.1.1.5. Insect Protein
- 9.1.1.1.6. Milk Protein
- 9.1.1.1.7. Whey Protein
- 9.1.1.1.8. Other Animal Protein
- 9.1.1.1. By Protein Type
- 9.1.2. Microbial
- 9.1.2.1. Algae Protein
- 9.1.2.2. Mycoprotein
- 9.1.3. Plant
- 9.1.3.1. Hemp Protein
- 9.1.3.2. Pea Protein
- 9.1.3.3. Potato Protein
- 9.1.3.4. Rice Protein
- 9.1.3.5. Soy Protein
- 9.1.3.6. Wheat Protein
- 9.1.3.7. Other Plant Protein
- 9.1.1. Animal
- 9.2. Market Analysis, Insights and Forecast - by End User
- 9.2.1. Animal Feed
- 9.2.2. Food and Beverages
- 9.2.2.1. By Sub End User
- 9.2.2.1.1. Bakery
- 9.2.2.1.2. Breakfast Cereals
- 9.2.2.1.3. Condiments/Sauces
- 9.2.2.1.4. Confectionery
- 9.2.2.1.5. Dairy and Dairy Alternative Products
- 9.2.2.1.6. Meat/Poultry/Seafood and Meat Alternative Products
- 9.2.2.1.7. RTE/RTC Food Products
- 9.2.2.1.8. Snacks
- 9.2.2.1. By Sub End User
- 9.2.3. Personal Care and Cosmetics
- 9.2.4. Supplements
- 9.2.4.1. Baby Food and Infant Formula
- 9.2.4.2. Elderly Nutrition and Medical Nutrition
- 9.2.4.3. Sport/Performance Nutrition
- 9.1. Market Analysis, Insights and Forecast - by Source
- 10. Middle East & Africa USA Protein Industry Analysis, Insights and Forecast, 2020-2032
- 10.1. Market Analysis, Insights and Forecast - by Source
- 10.1.1. Animal
- 10.1.1.1. By Protein Type
- 10.1.1.1.1. Casein and Caseinates
- 10.1.1.1.2. Collagen
- 10.1.1.1.3. Egg Protein
- 10.1.1.1.4. Gelatin
- 10.1.1.1.5. Insect Protein
- 10.1.1.1.6. Milk Protein
- 10.1.1.1.7. Whey Protein
- 10.1.1.1.8. Other Animal Protein
- 10.1.1.1. By Protein Type
- 10.1.2. Microbial
- 10.1.2.1. Algae Protein
- 10.1.2.2. Mycoprotein
- 10.1.3. Plant
- 10.1.3.1. Hemp Protein
- 10.1.3.2. Pea Protein
- 10.1.3.3. Potato Protein
- 10.1.3.4. Rice Protein
- 10.1.3.5. Soy Protein
- 10.1.3.6. Wheat Protein
- 10.1.3.7. Other Plant Protein
- 10.1.1. Animal
- 10.2. Market Analysis, Insights and Forecast - by End User
- 10.2.1. Animal Feed
- 10.2.2. Food and Beverages
- 10.2.2.1. By Sub End User
- 10.2.2.1.1. Bakery
- 10.2.2.1.2. Breakfast Cereals
- 10.2.2.1.3. Condiments/Sauces
- 10.2.2.1.4. Confectionery
- 10.2.2.1.5. Dairy and Dairy Alternative Products
- 10.2.2.1.6. Meat/Poultry/Seafood and Meat Alternative Products
- 10.2.2.1.7. RTE/RTC Food Products
- 10.2.2.1.8. Snacks
- 10.2.2.1. By Sub End User
- 10.2.3. Personal Care and Cosmetics
- 10.2.4. Supplements
- 10.2.4.1. Baby Food and Infant Formula
- 10.2.4.2. Elderly Nutrition and Medical Nutrition
- 10.2.4.3. Sport/Performance Nutrition
- 10.1. Market Analysis, Insights and Forecast - by Source
- 11. Asia Pacific USA Protein Industry Analysis, Insights and Forecast, 2020-2032
- 11.1. Market Analysis, Insights and Forecast - by Source
- 11.1.1. Animal
- 11.1.1.1. By Protein Type
- 11.1.1.1.1. Casein and Caseinates
- 11.1.1.1.2. Collagen
- 11.1.1.1.3. Egg Protein
- 11.1.1.1.4. Gelatin
- 11.1.1.1.5. Insect Protein
- 11.1.1.1.6. Milk Protein
- 11.1.1.1.7. Whey Protein
- 11.1.1.1.8. Other Animal Protein
- 11.1.1.1. By Protein Type
- 11.1.2. Microbial
- 11.1.2.1. Algae Protein
- 11.1.2.2. Mycoprotein
- 11.1.3. Plant
- 11.1.3.1. Hemp Protein
- 11.1.3.2. Pea Protein
- 11.1.3.3. Potato Protein
- 11.1.3.4. Rice Protein
- 11.1.3.5. Soy Protein
- 11.1.3.6. Wheat Protein
- 11.1.3.7. Other Plant Protein
- 11.1.1. Animal
- 11.2. Market Analysis, Insights and Forecast - by End User
- 11.2.1. Animal Feed
- 11.2.2. Food and Beverages
- 11.2.2.1. By Sub End User
- 11.2.2.1.1. Bakery
- 11.2.2.1.2. Breakfast Cereals
- 11.2.2.1.3. Condiments/Sauces
- 11.2.2.1.4. Confectionery
- 11.2.2.1.5. Dairy and Dairy Alternative Products
- 11.2.2.1.6. Meat/Poultry/Seafood and Meat Alternative Products
- 11.2.2.1.7. RTE/RTC Food Products
- 11.2.2.1.8. Snacks
- 11.2.2.1. By Sub End User
- 11.2.3. Personal Care and Cosmetics
- 11.2.4. Supplements
- 11.2.4.1. Baby Food and Infant Formula
- 11.2.4.2. Elderly Nutrition and Medical Nutrition
- 11.2.4.3. Sport/Performance Nutrition
- 11.1. Market Analysis, Insights and Forecast - by Source
- 12. Competitive Analysis
- 12.1. Company Profiles
- 12.1.1 CHS Inc
- 12.1.1.1. Company Overview
- 12.1.1.2. Products
- 12.1.1.3. Company Financials
- 12.1.1.4. SWOT Analysis
- 12.1.2 Darling Ingredients Inc
- 12.1.2.1. Company Overview
- 12.1.2.2. Products
- 12.1.2.3. Company Financials
- 12.1.2.4. SWOT Analysis
- 12.1.3 MGP
- 12.1.3.1. Company Overview
- 12.1.3.2. Products
- 12.1.3.3. Company Financials
- 12.1.3.4. SWOT Analysis
- 12.1.4 Arla Foods amba
- 12.1.4.1. Company Overview
- 12.1.4.2. Products
- 12.1.4.3. Company Financials
- 12.1.4.4. SWOT Analysis
- 12.1.5 Gelita AG
- 12.1.5.1. Company Overview
- 12.1.5.2. Products
- 12.1.5.3. Company Financials
- 12.1.5.4. SWOT Analysis
- 12.1.6 AMCO Proteins
- 12.1.6.1. Company Overview
- 12.1.6.2. Products
- 12.1.6.3. Company Financials
- 12.1.6.4. SWOT Analysis
- 12.1.7 International Flavors & Fragrances Inc
- 12.1.7.1. Company Overview
- 12.1.7.2. Products
- 12.1.7.3. Company Financials
- 12.1.7.4. SWOT Analysis
- 12.1.8 Archer Daniels Midland Company
- 12.1.8.1. Company Overview
- 12.1.8.2. Products
- 12.1.8.3. Company Financials
- 12.1.8.4. SWOT Analysis
- 12.1.9 Glanbia PLC
- 12.1.9.1. Company Overview
- 12.1.9.2. Products
- 12.1.9.3. Company Financials
- 12.1.9.4. SWOT Analysis
- 12.1.10 Ajinomoto Co Inc
- 12.1.10.1. Company Overview
- 12.1.10.2. Products
- 12.1.10.3. Company Financials
- 12.1.10.4. SWOT Analysis
- 12.1.11 Bunge Limited
- 12.1.11.1. Company Overview
- 12.1.11.2. Products
- 12.1.11.3. Company Financials
- 12.1.11.4. SWOT Analysis
- 12.1.12 Roquette Frères
- 12.1.12.1. Company Overview
- 12.1.12.2. Products
- 12.1.12.3. Company Financials
- 12.1.12.4. SWOT Analysis
- 12.1.13 Agropur Dairy Cooperative
- 12.1.13.1. Company Overview
- 12.1.13.2. Products
- 12.1.13.3. Company Financials
- 12.1.13.4. SWOT Analysis
- 12.1.14 Kerry Group PLC
- 12.1.14.1. Company Overview
- 12.1.14.2. Products
- 12.1.14.3. Company Financials
- 12.1.14.4. SWOT Analysis
- 12.1.15 Farbest-Tallman Foods Corporation
- 12.1.15.1. Company Overview
- 12.1.15.2. Products
- 12.1.15.3. Company Financials
- 12.1.15.4. SWOT Analysis
- 12.1.16 Fonterra Co-operative Group Limited
- 12.1.16.1. Company Overview
- 12.1.16.2. Products
- 12.1.16.3. Company Financials
- 12.1.16.4. SWOT Analysis
- 12.1.17 Ingredion Incorporated
- 12.1.17.1. Company Overview
- 12.1.17.2. Products
- 12.1.17.3. Company Financials
- 12.1.17.4. SWOT Analysis
- 12.1.18 Corbion NV
- 12.1.18.1. Company Overview
- 12.1.18.2. Products
- 12.1.18.3. Company Financials
- 12.1.18.4. SWOT Analysis
- 12.1.19 Südzucker Grou
- 12.1.19.1. Company Overview
- 12.1.19.2. Products
- 12.1.19.3. Company Financials
- 12.1.19.4. SWOT Analysis
- 12.1.1 CHS Inc
- 12.2. Market Entropy
- 12.2.1 Company's Key Areas Served
- 12.2.2 Recent Developments
- 12.3. Company Market Share Analysis 2025
- 12.3.1 Top 5 Companies Market Share Analysis
- 12.3.2 Top 3 Companies Market Share Analysis
- 12.4. List of Potential Customers
- 13. Research Methodology
List of Figures
- Figure 1: Global USA Protein Industry Revenue Breakdown (billion, %) by Region 2025 & 2033
- Figure 2: North America USA Protein Industry Revenue (billion), by Source 2025 & 2033
- Figure 3: North America USA Protein Industry Revenue Share (%), by Source 2025 & 2033
- Figure 4: North America USA Protein Industry Revenue (billion), by End User 2025 & 2033
- Figure 5: North America USA Protein Industry Revenue Share (%), by End User 2025 & 2033
- Figure 6: North America USA Protein Industry Revenue (billion), by Country 2025 & 2033
- Figure 7: North America USA Protein Industry Revenue Share (%), by Country 2025 & 2033
- Figure 8: South America USA Protein Industry Revenue (billion), by Source 2025 & 2033
- Figure 9: South America USA Protein Industry Revenue Share (%), by Source 2025 & 2033
- Figure 10: South America USA Protein Industry Revenue (billion), by End User 2025 & 2033
- Figure 11: South America USA Protein Industry Revenue Share (%), by End User 2025 & 2033
- Figure 12: South America USA Protein Industry Revenue (billion), by Country 2025 & 2033
- Figure 13: South America USA Protein Industry Revenue Share (%), by Country 2025 & 2033
- Figure 14: Europe USA Protein Industry Revenue (billion), by Source 2025 & 2033
- Figure 15: Europe USA Protein Industry Revenue Share (%), by Source 2025 & 2033
- Figure 16: Europe USA Protein Industry Revenue (billion), by End User 2025 & 2033
- Figure 17: Europe USA Protein Industry Revenue Share (%), by End User 2025 & 2033
- Figure 18: Europe USA Protein Industry Revenue (billion), by Country 2025 & 2033
- Figure 19: Europe USA Protein Industry Revenue Share (%), by Country 2025 & 2033
- Figure 20: Middle East & Africa USA Protein Industry Revenue (billion), by Source 2025 & 2033
- Figure 21: Middle East & Africa USA Protein Industry Revenue Share (%), by Source 2025 & 2033
- Figure 22: Middle East & Africa USA Protein Industry Revenue (billion), by End User 2025 & 2033
- Figure 23: Middle East & Africa USA Protein Industry Revenue Share (%), by End User 2025 & 2033
- Figure 24: Middle East & Africa USA Protein Industry Revenue (billion), by Country 2025 & 2033
- Figure 25: Middle East & Africa USA Protein Industry Revenue Share (%), by Country 2025 & 2033
- Figure 26: Asia Pacific USA Protein Industry Revenue (billion), by Source 2025 & 2033
- Figure 27: Asia Pacific USA Protein Industry Revenue Share (%), by Source 2025 & 2033
- Figure 28: Asia Pacific USA Protein Industry Revenue (billion), by End User 2025 & 2033
- Figure 29: Asia Pacific USA Protein Industry Revenue Share (%), by End User 2025 & 2033
- Figure 30: Asia Pacific USA Protein Industry Revenue (billion), by Country 2025 & 2033
- Figure 31: Asia Pacific USA Protein Industry Revenue Share (%), by Country 2025 & 2033
List of Tables
- Table 1: Global USA Protein Industry Revenue billion Forecast, by Source 2020 & 2033
- Table 2: Global USA Protein Industry Revenue billion Forecast, by End User 2020 & 2033
- Table 3: Global USA Protein Industry Revenue billion Forecast, by Region 2020 & 2033
- Table 4: Global USA Protein Industry Revenue billion Forecast, by Source 2020 & 2033
- Table 5: Global USA Protein Industry Revenue billion Forecast, by End User 2020 & 2033
- Table 6: Global USA Protein Industry Revenue billion Forecast, by Country 2020 & 2033
- Table 7: United States USA Protein Industry Revenue (billion) Forecast, by Application 2020 & 2033
- Table 8: Canada USA Protein Industry Revenue (billion) Forecast, by Application 2020 & 2033
- Table 9: Mexico USA Protein Industry Revenue (billion) Forecast, by Application 2020 & 2033
- Table 10: Global USA Protein Industry Revenue billion Forecast, by Source 2020 & 2033
- Table 11: Global USA Protein Industry Revenue billion Forecast, by End User 2020 & 2033
- Table 12: Global USA Protein Industry Revenue billion Forecast, by Country 2020 & 2033
- Table 13: Brazil USA Protein Industry Revenue (billion) Forecast, by Application 2020 & 2033
- Table 14: Argentina USA Protein Industry Revenue (billion) Forecast, by Application 2020 & 2033
- Table 15: Rest of South America USA Protein Industry Revenue (billion) Forecast, by Application 2020 & 2033
- Table 16: Global USA Protein Industry Revenue billion Forecast, by Source 2020 & 2033
- Table 17: Global USA Protein Industry Revenue billion Forecast, by End User 2020 & 2033
- Table 18: Global USA Protein Industry Revenue billion Forecast, by Country 2020 & 2033
- Table 19: United Kingdom USA Protein Industry Revenue (billion) Forecast, by Application 2020 & 2033
- Table 20: Germany USA Protein Industry Revenue (billion) Forecast, by Application 2020 & 2033
- Table 21: France USA Protein Industry Revenue (billion) Forecast, by Application 2020 & 2033
- Table 22: Italy USA Protein Industry Revenue (billion) Forecast, by Application 2020 & 2033
- Table 23: Spain USA Protein Industry Revenue (billion) Forecast, by Application 2020 & 2033
- Table 24: Russia USA Protein Industry Revenue (billion) Forecast, by Application 2020 & 2033
- Table 25: Benelux USA Protein Industry Revenue (billion) Forecast, by Application 2020 & 2033
- Table 26: Nordics USA Protein Industry Revenue (billion) Forecast, by Application 2020 & 2033
- Table 27: Rest of Europe USA Protein Industry Revenue (billion) Forecast, by Application 2020 & 2033
- Table 28: Global USA Protein Industry Revenue billion Forecast, by Source 2020 & 2033
- Table 29: Global USA Protein Industry Revenue billion Forecast, by End User 2020 & 2033
- Table 30: Global USA Protein Industry Revenue billion Forecast, by Country 2020 & 2033
- Table 31: Turkey USA Protein Industry Revenue (billion) Forecast, by Application 2020 & 2033
- Table 32: Israel USA Protein Industry Revenue (billion) Forecast, by Application 2020 & 2033
- Table 33: GCC USA Protein Industry Revenue (billion) Forecast, by Application 2020 & 2033
- Table 34: North Africa USA Protein Industry Revenue (billion) Forecast, by Application 2020 & 2033
- Table 35: South Africa USA Protein Industry Revenue (billion) Forecast, by Application 2020 & 2033
- Table 36: Rest of Middle East & Africa USA Protein Industry Revenue (billion) Forecast, by Application 2020 & 2033
- Table 37: Global USA Protein Industry Revenue billion Forecast, by Source 2020 & 2033
- Table 38: Global USA Protein Industry Revenue billion Forecast, by End User 2020 & 2033
- Table 39: Global USA Protein Industry Revenue billion Forecast, by Country 2020 & 2033
- Table 40: China USA Protein Industry Revenue (billion) Forecast, by Application 2020 & 2033
- Table 41: India USA Protein Industry Revenue (billion) Forecast, by Application 2020 & 2033
- Table 42: Japan USA Protein Industry Revenue (billion) Forecast, by Application 2020 & 2033
- Table 43: South Korea USA Protein Industry Revenue (billion) Forecast, by Application 2020 & 2033
- Table 44: ASEAN USA Protein Industry Revenue (billion) Forecast, by Application 2020 & 2033
- Table 45: Oceania USA Protein Industry Revenue (billion) Forecast, by Application 2020 & 2033
- Table 46: Rest of Asia Pacific USA Protein Industry Revenue (billion) Forecast, by Application 2020 & 2033
Frequently Asked Questions
1. What is the projected Compound Annual Growth Rate (CAGR) of the USA Protein Industry?
The projected CAGR is approximately 10.3%.
2. Which companies are prominent players in the USA Protein Industry?
Key companies in the market include CHS Inc, Darling Ingredients Inc, MGP, Arla Foods amba, Gelita AG, AMCO Proteins, International Flavors & Fragrances Inc, Archer Daniels Midland Company, Glanbia PLC, Ajinomoto Co Inc, Bunge Limited, Roquette Frères, Agropur Dairy Cooperative, Kerry Group PLC, Farbest-Tallman Foods Corporation, Fonterra Co-operative Group Limited, Ingredion Incorporated, Corbion NV, Südzucker Grou.
3. What are the main segments of the USA Protein Industry?
The market segments include Source, End User.
4. Can you provide details about the market size?
The market size is estimated to be USD 29.78 billion as of 2022.
5. What are some drivers contributing to market growth?
Increasing Urbanization; Growing Disposable Income.
6. What are the notable trends driving market growth?
OTHER KEY INDUSTRY TRENDS COVERED IN THE REPORT.
7. Are there any restraints impacting market growth?
High-price and additional delivery charges.
8. Can you provide examples of recent developments in the market?
August 2022: Optimum Nutrition announced the launch of its new Gold Standard Protein Shake. The RTD is available in chocolate and vanilla flavors, and formulated with 24 grams of protein per serving.June 2022: Fonterra JV has entered into a joint venture with Tillamook country creamery association(TCCA) and a three-mile canyon farm in the United States to launch Pro-Optima TM, a grade A functional whey protein concentrate (fWPC).August 2021: Darling Ingredients expanded its existing manufacturing facility that includes Nebraska’s first operation dedicated solely to poultry conversion. This expanded manufacturing unit may also facilitate protein conversion.
9. What pricing options are available for accessing the report?
Pricing options include single-user, multi-user, and enterprise licenses priced at USD 3800, USD 4500, and USD 5800 respectively.
10. Is the market size provided in terms of value or volume?
The market size is provided in terms of value, measured in billion.
11. Are there any specific market keywords associated with the report?
Yes, the market keyword associated with the report is "USA Protein Industry," which aids in identifying and referencing the specific market segment covered.
12. How do I determine which pricing option suits my needs best?
The pricing options vary based on user requirements and access needs. Individual users may opt for single-user licenses, while businesses requiring broader access may choose multi-user or enterprise licenses for cost-effective access to the report.
13. Are there any additional resources or data provided in the USA Protein Industry report?
While the report offers comprehensive insights, it's advisable to review the specific contents or supplementary materials provided to ascertain if additional resources or data are available.
14. How can I stay updated on further developments or reports in the USA Protein Industry?
To stay informed about further developments, trends, and reports in the USA Protein Industry, consider subscribing to industry newsletters, following relevant companies and organizations, or regularly checking reputable industry news sources and publications.
Methodology
Step 1 - Identification of Relevant Samples Size from Population Database


Step 2 - Approaches for Defining Global Market Size (Value, Volume* & Price*)

Note*: In applicable scenarios
Step 3 - Data Sources
Primary Research
- Web Analytics
- Survey Reports
- Research Institute
- Latest Research Reports
- Opinion Leaders
Secondary Research
- Annual Reports
- White Paper
- Latest Press Release
- Industry Association
- Paid Database
- Investor Presentations

Step 4 - Data Triangulation
Involves using different sources of information in order to increase the validity of a study
These sources are likely to be stakeholders in a program - participants, other researchers, program staff, other community members, and so on.
Then we put all data in single framework & apply various statistical tools to find out the dynamic on the market.
During the analysis stage, feedback from the stakeholder groups would be compared to determine areas of agreement as well as areas of divergence