

Key Insights
The Ready-to-Drink (RTD) Protein market is poised for significant expansion, projected to reach a $1.68 billion valuation by 2025, with an impressive Compound Annual Growth Rate (CAGR) of 7.72% expected to drive its trajectory through 2033. This robust growth is underpinned by a confluence of factors, primarily the escalating consumer awareness regarding health and wellness, leading to an increased demand for convenient and nutritious beverage options. The rising popularity of fitness culture, coupled with a greater emphasis on protein intake for muscle recovery and satiety, are key demand drivers. Furthermore, busy lifestyles and the need for on-the-go nutritional solutions are accelerating the adoption of RTD protein products. The market segmentation reveals a diverse landscape, with Whey and Soy protein sources dominating the current consumption, catering to a broad spectrum of dietary preferences and needs. In terms of packaging, bottles and cans are the preferred formats due to their convenience and portability, while the distribution channel is increasingly shifting towards online retail and specialist health stores, reflecting evolving consumer purchasing habits.
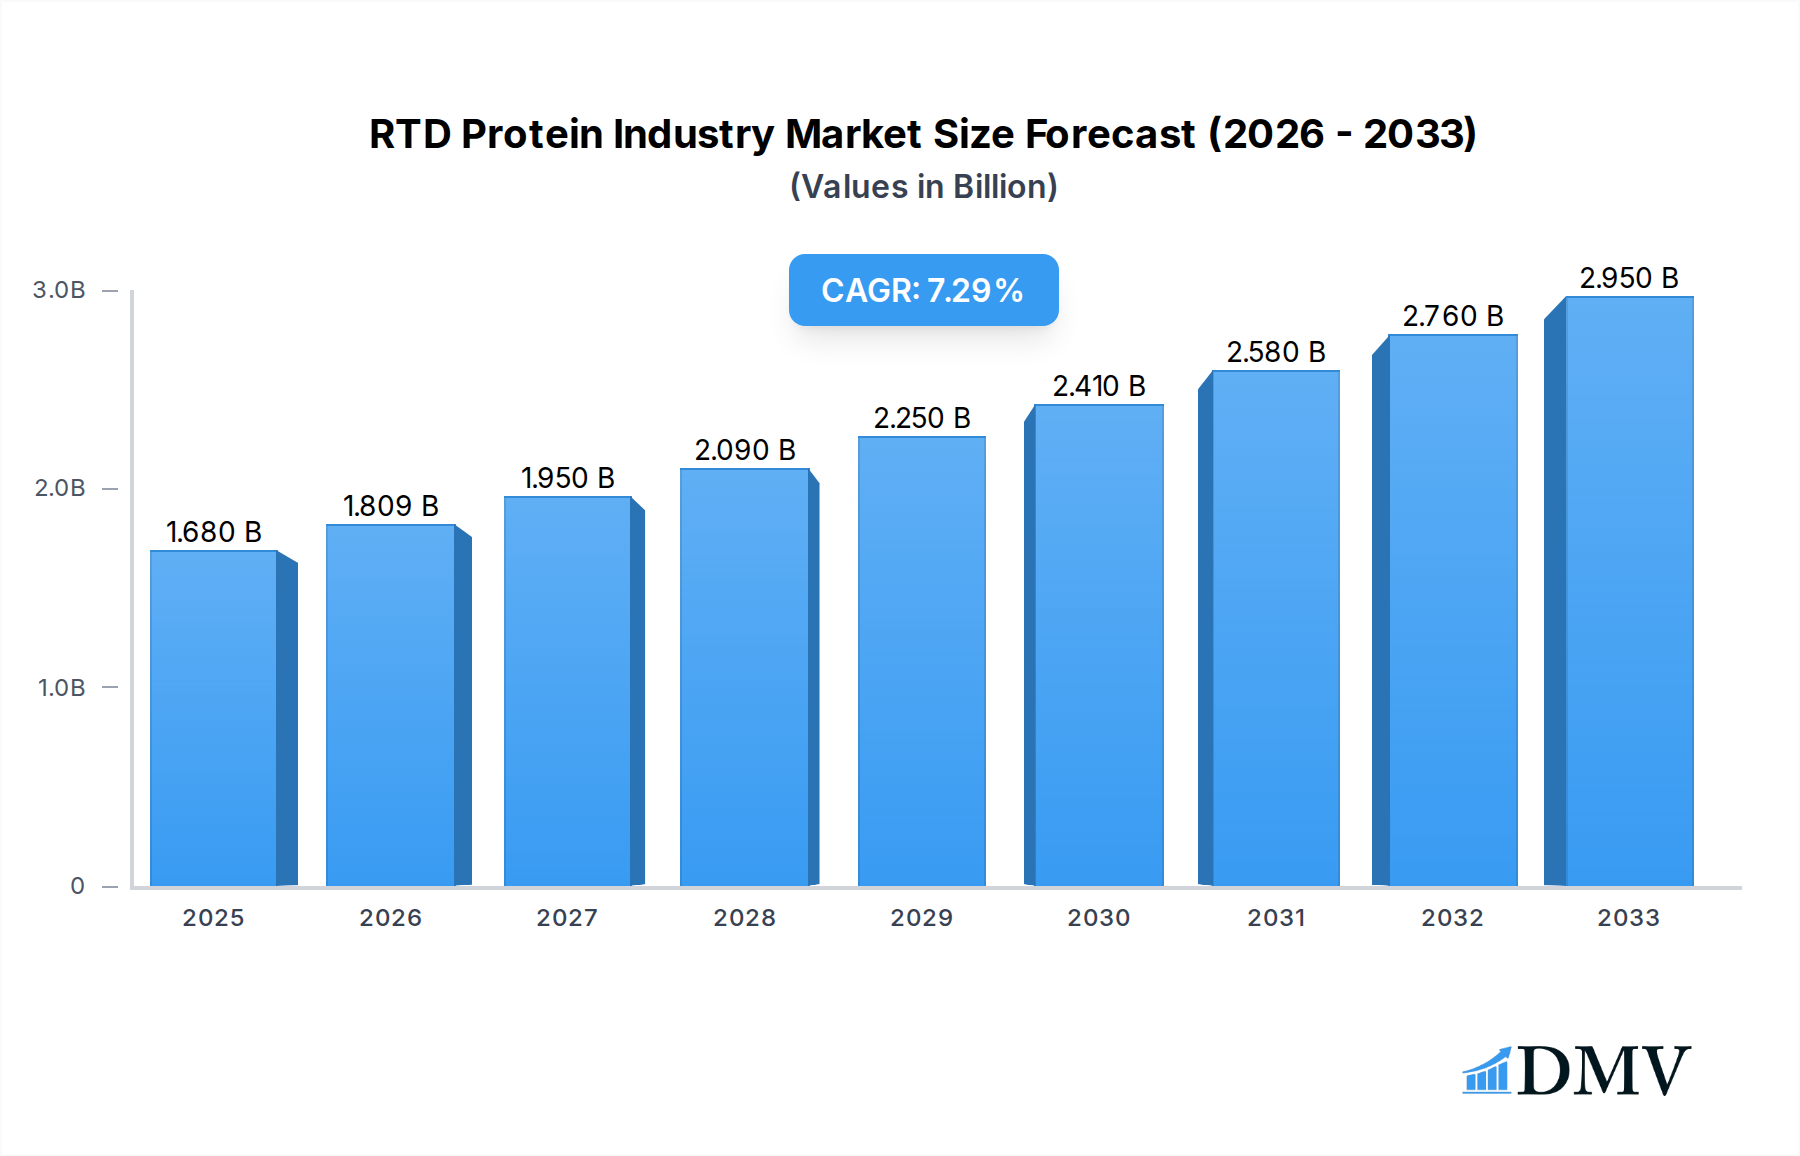
RTD Protein Industry Market Size (In Billion)
The global RTD Protein market's expansion is further fueled by ongoing innovation in product formulations, including the introduction of plant-based alternatives, and the incorporation of functional ingredients. The growing prevalence of lifestyle-related diseases and a proactive approach to health management are also contributing to the sustained demand for protein-enriched beverages. While the market demonstrates a strong growth trajectory, certain restraints such as fluctuating raw material prices and intense competition within the beverage sector need to be navigated. However, the strategic expansion by key players like Glanbia PLC, PepsiCo Inc., and Abbott Nutrition, coupled with a growing presence in emerging markets, indicates a positive outlook. The forecast period is expected to witness a surge in market penetration, driven by targeted marketing campaigns and product diversification, making the RTD protein segment a dynamic and attractive area within the broader functional beverage industry.

RTD Protein Industry Company Market Share
RTD Protein Industry Market Composition & Trends
The global RTD Protein Industry is experiencing robust growth, fueled by increasing health consciousness and the demand for convenient nutritional solutions. Market concentration is moderate, with key players like Kellogg Company, Glanbia PLC, PepsiCo Inc, and Abbott Nutrition holding significant shares. Innovation is a primary catalyst, driven by the development of plant-based protein alternatives and enhanced formulations. The regulatory landscape, while evolving, generally supports the market with clear guidelines for labeling and health claims. Substitute products, such as protein powders and bars, offer alternatives, but the convenience and immediate consumption of RTDs provide a distinct advantage. End-user profiles are diverse, encompassing athletes, fitness enthusiasts, busy professionals, and health-conscious individuals seeking convenient protein intake. Mergers and acquisitions are observed, with M&A deal values in the hundreds of millions. For instance, the acquisition of select brands by larger corporations aims to expand product portfolios and market reach, contributing to market share distribution shifts and a dynamic competitive environment. The market is projected to reach a value exceeding USD 30 Million by 2033, with a Compound Annual Growth Rate (CAGR) of approximately XX% during the forecast period.
RTD Protein Industry Industry Evolution
The RTD Protein Industry has undergone a significant transformation, evolving from niche sports nutrition products to mainstream beverage staples. This evolution is marked by a steady upward trajectory in market growth, consistently outpacing many other segments within the broader beverage and health food sectors. During the historical period of 2019-2024, the industry witnessed a CAGR of roughly XX%, driven by an increased understanding of protein's role in health and wellness. Technological advancements have played a crucial role in this evolution. Innovations in processing, such as advanced pasteurization techniques and aseptic filling, have extended shelf life and maintained product quality, making RTD protein beverages more accessible and appealing. The development of new flavor profiles and ingredient combinations, including the incorporation of superfruits and adaptogens, has also broadened consumer appeal. Shifting consumer demands are perhaps the most significant evolutionary force. There's a marked pivot towards healthier beverage choices, with consumers actively seeking products that offer both nutritional benefits and convenience. The surge in demand for plant-based protein sources, driven by ethical, environmental, and health concerns, has led to the proliferation of soy, pea, and other plant-derived RTD protein options. This dietary shift is reflected in the growth rates of specific segments; for example, the plant-based RTD protein segment is estimated to grow at a CAGR of XX% from 2025 to 2033, significantly higher than the overall market average. Adoption metrics showcase this trend, with online retail channels reporting a XX% increase in RTD protein sales of plant-based varieties between 2021 and 2023. Furthermore, the increasing focus on functional ingredients and personalized nutrition is pushing manufacturers to develop specialized RTD protein products catering to specific needs, such as post-workout recovery, weight management, and immune support. The industry's adaptability to these evolving consumer preferences and its embrace of technological innovation have been instrumental in its sustained expansion and its current market valuation, projected to surpass USD 30 Million by 2025.
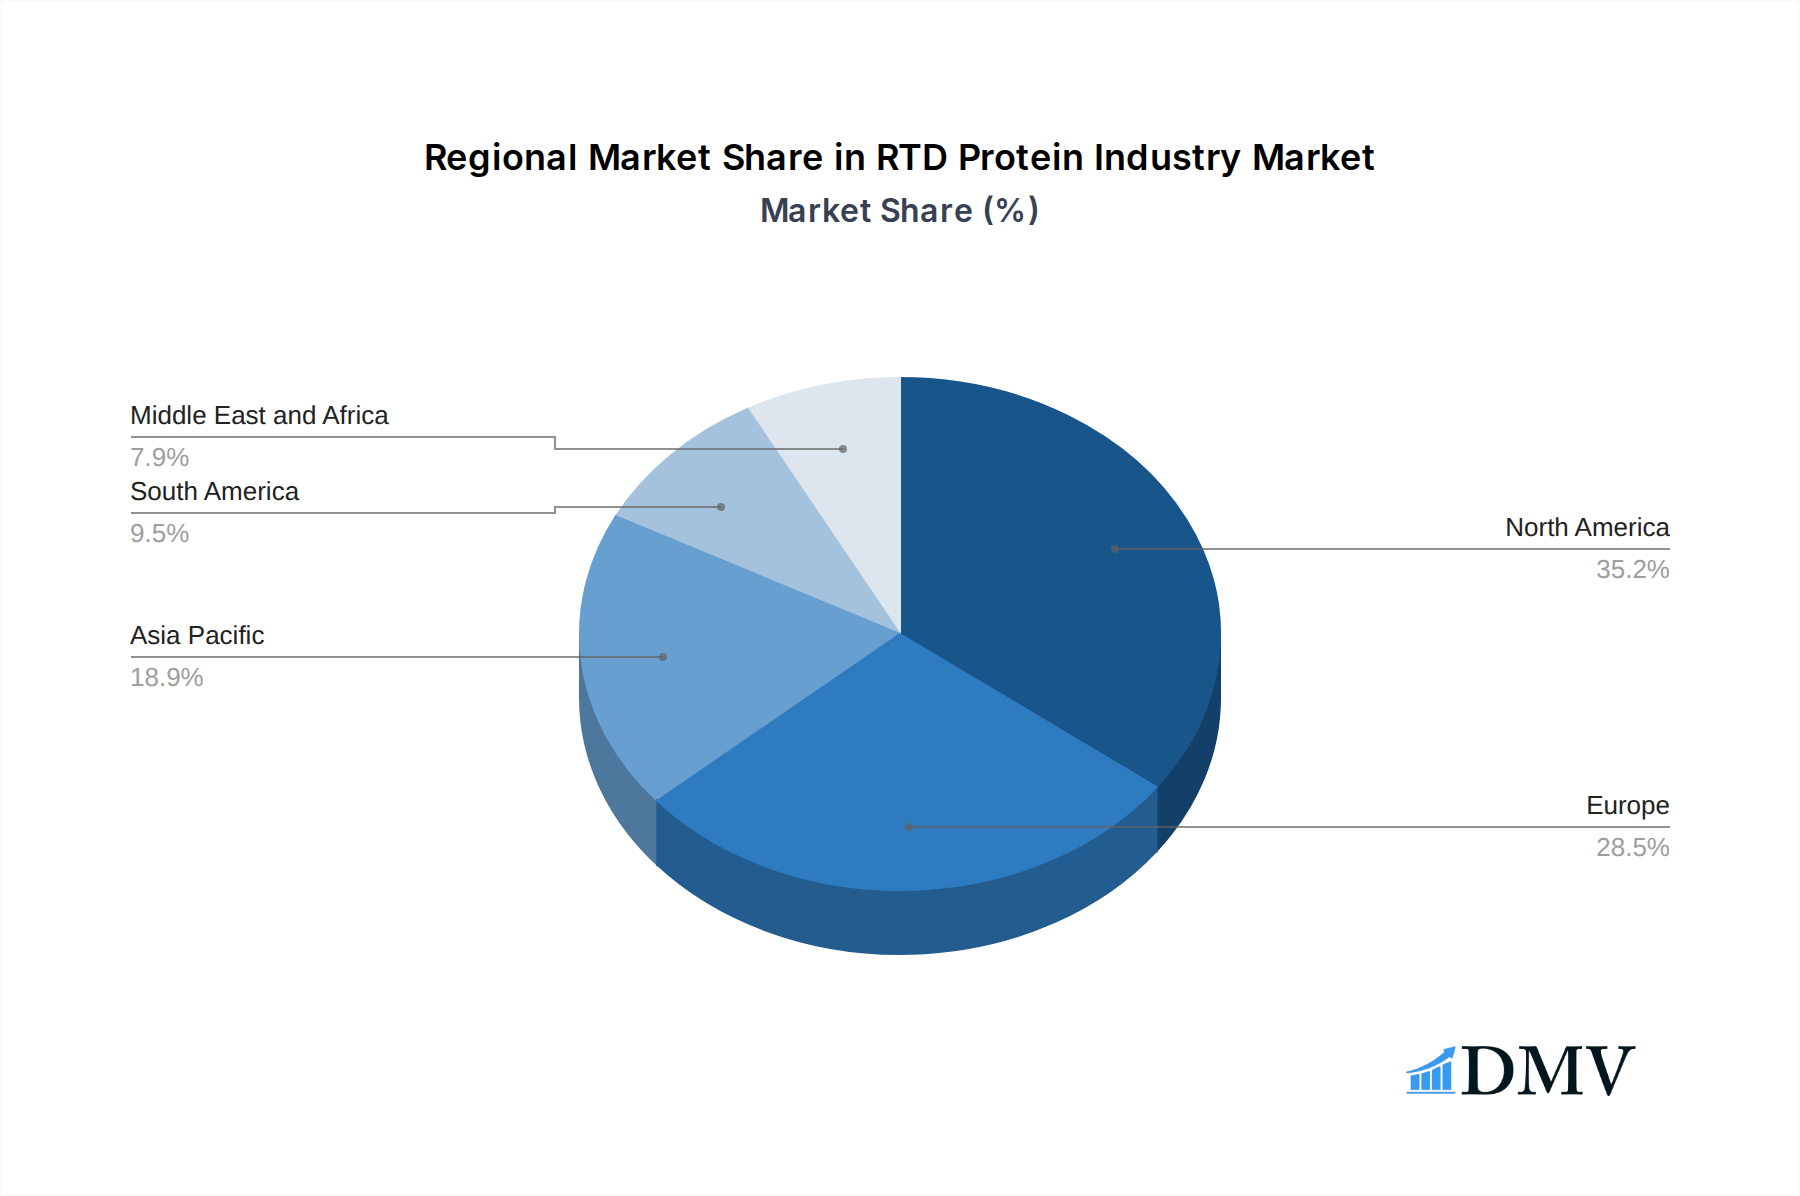
Leading Regions, Countries, or Segments in RTD Protein Industry
The North America region currently dominates the RTD Protein Industry, driven by a combination of high disposable incomes, a deeply ingrained health and fitness culture, and a strong consumer preference for convenient, on-the-go nutritional solutions. The United States, in particular, stands out as a leading country due to its vast consumer base and the early adoption of health-conscious trends. Within North America, the Whey protein source segment holds a commanding lead, accounting for over XX% of the total market share. This dominance is attributed to its well-established reputation for efficacy in muscle building and recovery, coupled with significant investment in product development and marketing by major players. However, the Soy and Other Sources segments, encompassing plant-based alternatives like pea, rice, and almond protein, are exhibiting the fastest growth rates, with a projected CAGR of XX% during the forecast period. This rapid expansion is fueled by growing veganism, vegetarianism, and increasing consumer awareness regarding the environmental impact of animal-derived products.
The Bottles packaging type is the most prevalent, offering convenience and portability that aligns perfectly with the on-the-go lifestyle of target consumers. While cans are also present, their market share is smaller. The Online Retail distribution channel is rapidly gaining traction, experiencing a CAGR of XX%, reflecting the digital shift in consumer purchasing habits. Specialist retailers and supermarkets/hypermarkets remain strong, but online platforms offer greater reach and personalized shopping experiences, particularly for niche and emerging brands.
Key drivers for the dominance of North America and the Whey segment include:
- Investment Trends: Significant R&D investment by companies like Glanbia PLC and Abbott Nutrition in optimizing whey protein formulations and exploring new applications.
- Regulatory Support: Favorable regulatory environments in countries like the US and Canada, which facilitate product innovation and marketing.
- Consumer Awareness: High levels of consumer education regarding the benefits of protein intake, particularly for athletic performance and general well-being.
- Availability of Key Players: The strong presence and marketing prowess of major RTD protein companies such as PepsiCo Inc. and Kellogg Company in the region.
The increasing demand for plant-based options is a pivotal factor driving the growth of the Soy and Other Sources segments, alongside the burgeoning online retail channel. This dynamic interplay between established preferences and emerging trends highlights the continuous evolution within the RTD Protein Industry, with a projected market value exceeding USD 30 Million by the base year 2025.
RTD Protein Industry Product Innovations
Product innovations in the RTD Protein Industry are primarily focused on enhancing nutritional profiles, improving taste and texture, and catering to specific dietary needs. Companies are developing RTDs with added functional ingredients like probiotics, prebiotics, and adaptogens for gut health and stress management. Plant-based protein formulations are continuously being refined for better taste and mouthfeel, challenging the dominance of whey. Unique selling propositions often revolve around "clean label" products with minimal artificial ingredients and added sugars. Technological advancements in encapsulation and flavor masking are crucial for delivering palatable and effective formulations, contributing to a projected market valuation exceeding USD 30 Million by 2025.
Propelling Factors for RTD Protein Industry Growth
The RTD Protein Industry's growth is propelled by several key factors. Technologically, advancements in formulation and processing enable the creation of more palatable and effective products. Economically, rising disposable incomes globally allow consumers to invest more in health and wellness products. Regulatory frameworks, when supportive of nutritional claims and product innovation, further encourage market expansion. The increasing consumer awareness of the health benefits associated with protein intake, coupled with the demand for convenient, on-the-go nutrition, are powerful drivers. For instance, the widespread availability of RTD protein beverages in supermarkets and online retail channels contributes significantly to accessibility and sales volume, pushing the market towards a valuation of over USD 30 Million by 2025.
Obstacles in the RTD Protein Industry Market
Despite its growth, the RTD Protein Industry faces several obstacles. Regulatory challenges, particularly concerning health claims and ingredient sourcing in different regions, can impede market entry and product development. Supply chain disruptions, as evidenced by recent global events, can impact the availability and cost of raw materials, leading to production delays and increased prices. Intense competitive pressures from established brands and emerging players, along with the continued popularity of alternative protein sources like powders and bars, can limit market share gains. Furthermore, the high cost of some specialized ingredients can make premium RTD protein beverages less accessible to a broader consumer base, potentially impacting sales volume and market penetration, with estimated impacts on growth rates in the range of XX%.
Future Opportunities in RTD Protein Industry
The RTD Protein Industry is ripe with future opportunities. Emerging markets in Asia and Latin America present untapped potential due to a growing middle class and increasing health consciousness. Technological advancements in sustainable sourcing and production methods offer opportunities for eco-friendly product lines. The rise of personalized nutrition presents a niche for customized RTD protein formulations tailored to individual genetic profiles and dietary needs. Furthermore, the expansion of distribution channels into untapped areas, such as corporate wellness programs and educational institutions, can drive significant market growth, contributing to the projected market value exceeding USD 30 Million by 2025.
Major Players in the RTD Protein Industry Ecosystem
- Kellogg Company
- Glanbia PLC
- PepsiCo Inc
- Halen Brands
- Post Holdings Inc
- Koia
- Abbott Nutrition
- Labrada Nutrition
- The Coca Cola Company
- Pure Protein
Key Developments in RTD Protein Industry Industry
- March 2022: QNT SA and Qimia Makmal Arad Company entered a partnership. Qimia is authorized in Iran to distribute QNT's functional foods, supplements, and sports nutrition products. This development is crucial for expanding QNT's global reach into a new market.
- February 2022: Optimum Nutrition introduced a new Ready-to-Drink (RTD) protein supplement separate from the company's Gold Standard RTD Protein in the UK. This product launch caters to a specific market segment and diversifies Optimum Nutrition's RTD offerings.
- February 2021: The plant-based beverage company, Koia, announced that its products may now be nationally distributed in 7-Eleven convenience stores in the US. Over 60% of consumers come to 7-Eleven for beverages, making it critical for the company portfolio to match their needs to live healthy lives. This strategic distribution expansion significantly enhances Koia's market accessibility.
- May 2021: PepsiCo's Naked brand launched its latest smoothie innovation, Indulgent Protein, available in two flavors, rich chocolate protein, and velvety vanilla protein. This product launch addresses the growing demand for indulgent yet healthy RTD options, expanding PepsiCo's plant-based beverage portfolio.
Strategic RTD Protein Industry Market Forecast
The strategic RTD Protein Industry market forecast indicates sustained and robust growth, driven by escalating consumer demand for convenient, health-focused beverages. Key growth catalysts include the continuous innovation in plant-based protein formulations, addressing ethical and environmental concerns, and the ongoing expansion of online retail channels, enhancing accessibility. The increasing integration of functional ingredients for added health benefits will further propel market penetration. With a projected market value exceeding USD 30 Million by 2025, strategic investments in product development, supply chain optimization, and targeted marketing campaigns will be crucial for players to capitalize on emerging opportunities and maintain a competitive edge in this dynamic sector.
RTD Protein Industry Segmentation
-
1. Source
- 1.1. Whey
- 1.2. Casein
- 1.3. Soy
- 1.4. Other Sources
-
2. Type of Packaging
- 2.1. Bottles
- 2.2. Cans
- 2.3. Others
-
3. Distribution Channel
- 3.1. Supermarkets/Hypermarkets
- 3.2. Pharmacies/Drugstores
- 3.3. Specialist Retailers
- 3.4. Online Retail
- 3.5. Other Channels
RTD Protein Industry Segmentation By Geography
-
1. North America
- 1.1. United States
- 1.2. Canada
- 1.3. Mexico
- 1.4. Rest of North America
-
2. Europe
- 2.1. Germany
- 2.2. United Kingdom
- 2.3. France
- 2.4. Spain
- 2.5. Italy
- 2.6. Russia
- 2.7. Rest of Europe
-
3. Asia Pacific
- 3.1. China
- 3.2. Japan
- 3.3. India
- 3.4. Australia
- 3.5. Rest of Asia Pacific
-
4. South America
- 4.1. Brazil
- 4.2. Argentina
- 4.3. Rest of South America
-
5. Middle East and Africa
- 5.1. South Africa
- 5.2. United Arab Emirates
- 5.3. Rest of Middle East and Africa
RTD Protein Industry Regional Market Share
Geographic Coverage of RTD Protein Industry
RTD Protein Industry REPORT HIGHLIGHTS
| Aspects | Details |
|---|---|
| Study Period | 2020-2034 |
| Base Year | 2025 |
| Estimated Year | 2026 |
| Forecast Period | 2026-2034 |
| Historical Period | 2020-2025 |
| Growth Rate | CAGR of 7.72% from 2020-2034 |
| Segmentation |
|
Table of Contents
- 1. Introduction
- 1.1. Research Scope
- 1.2. Market Segmentation
- 1.3. Research Objective
- 1.4. Definitions and Assumptions
- 2. Executive Summary
- 2.1. Market Snapshot
- 3. Market Dynamics
- 3.1. Market Drivers
- 3.2. Market Restrains
- 3.3. Market Trends
- 3.4. Market Opportunities
- 4. Market Factor Analysis
- 4.1. Porters Five Forces
- 4.1.1. Bargaining Power of Suppliers
- 4.1.2. Bargaining Power of Buyers
- 4.1.3. Threat of New Entrants
- 4.1.4. Threat of Substitutes
- 4.1.5. Competitive Rivalry
- 4.2. PESTEL analysis
- 4.3. BCG Analysis
- 4.3.1. Stars (High Growth, High Market Share)
- 4.3.2. Cash Cows (Low Growth, High Market Share)
- 4.3.3. Question Mark (High Growth, Low Market Share)
- 4.3.4. Dogs (Low Growth, Low Market Share)
- 4.4. Ansoff Matrix Analysis
- 4.5. Supply Chain Analysis
- 4.6. Regulatory Landscape
- 4.7. Current Market Potential and Opportunity Assessment (TAM–SAM–SOM Framework)
- 4.8. DMV Analyst Note
- 4.1. Porters Five Forces
- 5. Market Analysis, Insights and Forecast 2021-2033
- 5.1. Market Analysis, Insights and Forecast - by Source
- 5.1.1. Whey
- 5.1.2. Casein
- 5.1.3. Soy
- 5.1.4. Other Sources
- 5.2. Market Analysis, Insights and Forecast - by Type of Packaging
- 5.2.1. Bottles
- 5.2.2. Cans
- 5.2.3. Others
- 5.3. Market Analysis, Insights and Forecast - by Distribution Channel
- 5.3.1. Supermarkets/Hypermarkets
- 5.3.2. Pharmacies/Drugstores
- 5.3.3. Specialist Retailers
- 5.3.4. Online Retail
- 5.3.5. Other Channels
- 5.4. Market Analysis, Insights and Forecast - by Region
- 5.4.1. North America
- 5.4.2. Europe
- 5.4.3. Asia Pacific
- 5.4.4. South America
- 5.4.5. Middle East and Africa
- 5.1. Market Analysis, Insights and Forecast - by Source
- 6. Global RTD Protein Industry Analysis, Insights and Forecast, 2021-2033
- 6.1. Market Analysis, Insights and Forecast - by Source
- 6.1.1. Whey
- 6.1.2. Casein
- 6.1.3. Soy
- 6.1.4. Other Sources
- 6.2. Market Analysis, Insights and Forecast - by Type of Packaging
- 6.2.1. Bottles
- 6.2.2. Cans
- 6.2.3. Others
- 6.3. Market Analysis, Insights and Forecast - by Distribution Channel
- 6.3.1. Supermarkets/Hypermarkets
- 6.3.2. Pharmacies/Drugstores
- 6.3.3. Specialist Retailers
- 6.3.4. Online Retail
- 6.3.5. Other Channels
- 6.1. Market Analysis, Insights and Forecast - by Source
- 7. North America RTD Protein Industry Analysis, Insights and Forecast, 2020-2032
- 7.1. Market Analysis, Insights and Forecast - by Source
- 7.1.1. Whey
- 7.1.2. Casein
- 7.1.3. Soy
- 7.1.4. Other Sources
- 7.2. Market Analysis, Insights and Forecast - by Type of Packaging
- 7.2.1. Bottles
- 7.2.2. Cans
- 7.2.3. Others
- 7.3. Market Analysis, Insights and Forecast - by Distribution Channel
- 7.3.1. Supermarkets/Hypermarkets
- 7.3.2. Pharmacies/Drugstores
- 7.3.3. Specialist Retailers
- 7.3.4. Online Retail
- 7.3.5. Other Channels
- 7.1. Market Analysis, Insights and Forecast - by Source
- 8. Europe RTD Protein Industry Analysis, Insights and Forecast, 2020-2032
- 8.1. Market Analysis, Insights and Forecast - by Source
- 8.1.1. Whey
- 8.1.2. Casein
- 8.1.3. Soy
- 8.1.4. Other Sources
- 8.2. Market Analysis, Insights and Forecast - by Type of Packaging
- 8.2.1. Bottles
- 8.2.2. Cans
- 8.2.3. Others
- 8.3. Market Analysis, Insights and Forecast - by Distribution Channel
- 8.3.1. Supermarkets/Hypermarkets
- 8.3.2. Pharmacies/Drugstores
- 8.3.3. Specialist Retailers
- 8.3.4. Online Retail
- 8.3.5. Other Channels
- 8.1. Market Analysis, Insights and Forecast - by Source
- 9. Asia Pacific RTD Protein Industry Analysis, Insights and Forecast, 2020-2032
- 9.1. Market Analysis, Insights and Forecast - by Source
- 9.1.1. Whey
- 9.1.2. Casein
- 9.1.3. Soy
- 9.1.4. Other Sources
- 9.2. Market Analysis, Insights and Forecast - by Type of Packaging
- 9.2.1. Bottles
- 9.2.2. Cans
- 9.2.3. Others
- 9.3. Market Analysis, Insights and Forecast - by Distribution Channel
- 9.3.1. Supermarkets/Hypermarkets
- 9.3.2. Pharmacies/Drugstores
- 9.3.3. Specialist Retailers
- 9.3.4. Online Retail
- 9.3.5. Other Channels
- 9.1. Market Analysis, Insights and Forecast - by Source
- 10. South America RTD Protein Industry Analysis, Insights and Forecast, 2020-2032
- 10.1. Market Analysis, Insights and Forecast - by Source
- 10.1.1. Whey
- 10.1.2. Casein
- 10.1.3. Soy
- 10.1.4. Other Sources
- 10.2. Market Analysis, Insights and Forecast - by Type of Packaging
- 10.2.1. Bottles
- 10.2.2. Cans
- 10.2.3. Others
- 10.3. Market Analysis, Insights and Forecast - by Distribution Channel
- 10.3.1. Supermarkets/Hypermarkets
- 10.3.2. Pharmacies/Drugstores
- 10.3.3. Specialist Retailers
- 10.3.4. Online Retail
- 10.3.5. Other Channels
- 10.1. Market Analysis, Insights and Forecast - by Source
- 11. Middle East and Africa RTD Protein Industry Analysis, Insights and Forecast, 2020-2032
- 11.1. Market Analysis, Insights and Forecast - by Source
- 11.1.1. Whey
- 11.1.2. Casein
- 11.1.3. Soy
- 11.1.4. Other Sources
- 11.2. Market Analysis, Insights and Forecast - by Type of Packaging
- 11.2.1. Bottles
- 11.2.2. Cans
- 11.2.3. Others
- 11.3. Market Analysis, Insights and Forecast - by Distribution Channel
- 11.3.1. Supermarkets/Hypermarkets
- 11.3.2. Pharmacies/Drugstores
- 11.3.3. Specialist Retailers
- 11.3.4. Online Retail
- 11.3.5. Other Channels
- 11.1. Market Analysis, Insights and Forecast - by Source
- 12. Competitive Analysis
- 12.1. Company Profiles
- 12.1.1 Kellogg Company
- 12.1.1.1. Company Overview
- 12.1.1.2. Products
- 12.1.1.3. Company Financials
- 12.1.1.4. SWOT Analysis
- 12.1.2 Glanbia PLC
- 12.1.2.1. Company Overview
- 12.1.2.2. Products
- 12.1.2.3. Company Financials
- 12.1.2.4. SWOT Analysis
- 12.1.3 PepsiCo Inc
- 12.1.3.1. Company Overview
- 12.1.3.2. Products
- 12.1.3.3. Company Financials
- 12.1.3.4. SWOT Analysis
- 12.1.4 Halen Brands
- 12.1.4.1. Company Overview
- 12.1.4.2. Products
- 12.1.4.3. Company Financials
- 12.1.4.4. SWOT Analysis
- 12.1.5 Post Holdings Inc
- 12.1.5.1. Company Overview
- 12.1.5.2. Products
- 12.1.5.3. Company Financials
- 12.1.5.4. SWOT Analysis
- 12.1.6 Koia
- 12.1.6.1. Company Overview
- 12.1.6.2. Products
- 12.1.6.3. Company Financials
- 12.1.6.4. SWOT Analysis
- 12.1.7 Abbott Nutrition
- 12.1.7.1. Company Overview
- 12.1.7.2. Products
- 12.1.7.3. Company Financials
- 12.1.7.4. SWOT Analysis
- 12.1.8 Labrada Nutrition
- 12.1.8.1. Company Overview
- 12.1.8.2. Products
- 12.1.8.3. Company Financials
- 12.1.8.4. SWOT Analysis
- 12.1.9 The Coca Cola Company
- 12.1.9.1. Company Overview
- 12.1.9.2. Products
- 12.1.9.3. Company Financials
- 12.1.9.4. SWOT Analysis
- 12.1.10 Pure Protein*List Not Exhaustive
- 12.1.10.1. Company Overview
- 12.1.10.2. Products
- 12.1.10.3. Company Financials
- 12.1.10.4. SWOT Analysis
- 12.1.1 Kellogg Company
- 12.2. Market Entropy
- 12.2.1 Company's Key Areas Served
- 12.2.2 Recent Developments
- 12.3. Company Market Share Analysis 2025
- 12.3.1 Top 5 Companies Market Share Analysis
- 12.3.2 Top 3 Companies Market Share Analysis
- 12.4. List of Potential Customers
- 13. Research Methodology
List of Figures
- Figure 1: Global RTD Protein Industry Revenue Breakdown (Million, %) by Region 2025 & 2033
- Figure 2: Global RTD Protein Industry Volume Breakdown (Billion, %) by Region 2025 & 2033
- Figure 3: North America RTD Protein Industry Revenue (Million), by Source 2025 & 2033
- Figure 4: North America RTD Protein Industry Volume (Billion), by Source 2025 & 2033
- Figure 5: North America RTD Protein Industry Revenue Share (%), by Source 2025 & 2033
- Figure 6: North America RTD Protein Industry Volume Share (%), by Source 2025 & 2033
- Figure 7: North America RTD Protein Industry Revenue (Million), by Type of Packaging 2025 & 2033
- Figure 8: North America RTD Protein Industry Volume (Billion), by Type of Packaging 2025 & 2033
- Figure 9: North America RTD Protein Industry Revenue Share (%), by Type of Packaging 2025 & 2033
- Figure 10: North America RTD Protein Industry Volume Share (%), by Type of Packaging 2025 & 2033
- Figure 11: North America RTD Protein Industry Revenue (Million), by Distribution Channel 2025 & 2033
- Figure 12: North America RTD Protein Industry Volume (Billion), by Distribution Channel 2025 & 2033
- Figure 13: North America RTD Protein Industry Revenue Share (%), by Distribution Channel 2025 & 2033
- Figure 14: North America RTD Protein Industry Volume Share (%), by Distribution Channel 2025 & 2033
- Figure 15: North America RTD Protein Industry Revenue (Million), by Country 2025 & 2033
- Figure 16: North America RTD Protein Industry Volume (Billion), by Country 2025 & 2033
- Figure 17: North America RTD Protein Industry Revenue Share (%), by Country 2025 & 2033
- Figure 18: North America RTD Protein Industry Volume Share (%), by Country 2025 & 2033
- Figure 19: Europe RTD Protein Industry Revenue (Million), by Source 2025 & 2033
- Figure 20: Europe RTD Protein Industry Volume (Billion), by Source 2025 & 2033
- Figure 21: Europe RTD Protein Industry Revenue Share (%), by Source 2025 & 2033
- Figure 22: Europe RTD Protein Industry Volume Share (%), by Source 2025 & 2033
- Figure 23: Europe RTD Protein Industry Revenue (Million), by Type of Packaging 2025 & 2033
- Figure 24: Europe RTD Protein Industry Volume (Billion), by Type of Packaging 2025 & 2033
- Figure 25: Europe RTD Protein Industry Revenue Share (%), by Type of Packaging 2025 & 2033
- Figure 26: Europe RTD Protein Industry Volume Share (%), by Type of Packaging 2025 & 2033
- Figure 27: Europe RTD Protein Industry Revenue (Million), by Distribution Channel 2025 & 2033
- Figure 28: Europe RTD Protein Industry Volume (Billion), by Distribution Channel 2025 & 2033
- Figure 29: Europe RTD Protein Industry Revenue Share (%), by Distribution Channel 2025 & 2033
- Figure 30: Europe RTD Protein Industry Volume Share (%), by Distribution Channel 2025 & 2033
- Figure 31: Europe RTD Protein Industry Revenue (Million), by Country 2025 & 2033
- Figure 32: Europe RTD Protein Industry Volume (Billion), by Country 2025 & 2033
- Figure 33: Europe RTD Protein Industry Revenue Share (%), by Country 2025 & 2033
- Figure 34: Europe RTD Protein Industry Volume Share (%), by Country 2025 & 2033
- Figure 35: Asia Pacific RTD Protein Industry Revenue (Million), by Source 2025 & 2033
- Figure 36: Asia Pacific RTD Protein Industry Volume (Billion), by Source 2025 & 2033
- Figure 37: Asia Pacific RTD Protein Industry Revenue Share (%), by Source 2025 & 2033
- Figure 38: Asia Pacific RTD Protein Industry Volume Share (%), by Source 2025 & 2033
- Figure 39: Asia Pacific RTD Protein Industry Revenue (Million), by Type of Packaging 2025 & 2033
- Figure 40: Asia Pacific RTD Protein Industry Volume (Billion), by Type of Packaging 2025 & 2033
- Figure 41: Asia Pacific RTD Protein Industry Revenue Share (%), by Type of Packaging 2025 & 2033
- Figure 42: Asia Pacific RTD Protein Industry Volume Share (%), by Type of Packaging 2025 & 2033
- Figure 43: Asia Pacific RTD Protein Industry Revenue (Million), by Distribution Channel 2025 & 2033
- Figure 44: Asia Pacific RTD Protein Industry Volume (Billion), by Distribution Channel 2025 & 2033
- Figure 45: Asia Pacific RTD Protein Industry Revenue Share (%), by Distribution Channel 2025 & 2033
- Figure 46: Asia Pacific RTD Protein Industry Volume Share (%), by Distribution Channel 2025 & 2033
- Figure 47: Asia Pacific RTD Protein Industry Revenue (Million), by Country 2025 & 2033
- Figure 48: Asia Pacific RTD Protein Industry Volume (Billion), by Country 2025 & 2033
- Figure 49: Asia Pacific RTD Protein Industry Revenue Share (%), by Country 2025 & 2033
- Figure 50: Asia Pacific RTD Protein Industry Volume Share (%), by Country 2025 & 2033
- Figure 51: South America RTD Protein Industry Revenue (Million), by Source 2025 & 2033
- Figure 52: South America RTD Protein Industry Volume (Billion), by Source 2025 & 2033
- Figure 53: South America RTD Protein Industry Revenue Share (%), by Source 2025 & 2033
- Figure 54: South America RTD Protein Industry Volume Share (%), by Source 2025 & 2033
- Figure 55: South America RTD Protein Industry Revenue (Million), by Type of Packaging 2025 & 2033
- Figure 56: South America RTD Protein Industry Volume (Billion), by Type of Packaging 2025 & 2033
- Figure 57: South America RTD Protein Industry Revenue Share (%), by Type of Packaging 2025 & 2033
- Figure 58: South America RTD Protein Industry Volume Share (%), by Type of Packaging 2025 & 2033
- Figure 59: South America RTD Protein Industry Revenue (Million), by Distribution Channel 2025 & 2033
- Figure 60: South America RTD Protein Industry Volume (Billion), by Distribution Channel 2025 & 2033
- Figure 61: South America RTD Protein Industry Revenue Share (%), by Distribution Channel 2025 & 2033
- Figure 62: South America RTD Protein Industry Volume Share (%), by Distribution Channel 2025 & 2033
- Figure 63: South America RTD Protein Industry Revenue (Million), by Country 2025 & 2033
- Figure 64: South America RTD Protein Industry Volume (Billion), by Country 2025 & 2033
- Figure 65: South America RTD Protein Industry Revenue Share (%), by Country 2025 & 2033
- Figure 66: South America RTD Protein Industry Volume Share (%), by Country 2025 & 2033
- Figure 67: Middle East and Africa RTD Protein Industry Revenue (Million), by Source 2025 & 2033
- Figure 68: Middle East and Africa RTD Protein Industry Volume (Billion), by Source 2025 & 2033
- Figure 69: Middle East and Africa RTD Protein Industry Revenue Share (%), by Source 2025 & 2033
- Figure 70: Middle East and Africa RTD Protein Industry Volume Share (%), by Source 2025 & 2033
- Figure 71: Middle East and Africa RTD Protein Industry Revenue (Million), by Type of Packaging 2025 & 2033
- Figure 72: Middle East and Africa RTD Protein Industry Volume (Billion), by Type of Packaging 2025 & 2033
- Figure 73: Middle East and Africa RTD Protein Industry Revenue Share (%), by Type of Packaging 2025 & 2033
- Figure 74: Middle East and Africa RTD Protein Industry Volume Share (%), by Type of Packaging 2025 & 2033
- Figure 75: Middle East and Africa RTD Protein Industry Revenue (Million), by Distribution Channel 2025 & 2033
- Figure 76: Middle East and Africa RTD Protein Industry Volume (Billion), by Distribution Channel 2025 & 2033
- Figure 77: Middle East and Africa RTD Protein Industry Revenue Share (%), by Distribution Channel 2025 & 2033
- Figure 78: Middle East and Africa RTD Protein Industry Volume Share (%), by Distribution Channel 2025 & 2033
- Figure 79: Middle East and Africa RTD Protein Industry Revenue (Million), by Country 2025 & 2033
- Figure 80: Middle East and Africa RTD Protein Industry Volume (Billion), by Country 2025 & 2033
- Figure 81: Middle East and Africa RTD Protein Industry Revenue Share (%), by Country 2025 & 2033
- Figure 82: Middle East and Africa RTD Protein Industry Volume Share (%), by Country 2025 & 2033
List of Tables
- Table 1: Global RTD Protein Industry Revenue Million Forecast, by Source 2020 & 2033
- Table 2: Global RTD Protein Industry Volume Billion Forecast, by Source 2020 & 2033
- Table 3: Global RTD Protein Industry Revenue Million Forecast, by Type of Packaging 2020 & 2033
- Table 4: Global RTD Protein Industry Volume Billion Forecast, by Type of Packaging 2020 & 2033
- Table 5: Global RTD Protein Industry Revenue Million Forecast, by Distribution Channel 2020 & 2033
- Table 6: Global RTD Protein Industry Volume Billion Forecast, by Distribution Channel 2020 & 2033
- Table 7: Global RTD Protein Industry Revenue Million Forecast, by Region 2020 & 2033
- Table 8: Global RTD Protein Industry Volume Billion Forecast, by Region 2020 & 2033
- Table 9: Global RTD Protein Industry Revenue Million Forecast, by Source 2020 & 2033
- Table 10: Global RTD Protein Industry Volume Billion Forecast, by Source 2020 & 2033
- Table 11: Global RTD Protein Industry Revenue Million Forecast, by Type of Packaging 2020 & 2033
- Table 12: Global RTD Protein Industry Volume Billion Forecast, by Type of Packaging 2020 & 2033
- Table 13: Global RTD Protein Industry Revenue Million Forecast, by Distribution Channel 2020 & 2033
- Table 14: Global RTD Protein Industry Volume Billion Forecast, by Distribution Channel 2020 & 2033
- Table 15: Global RTD Protein Industry Revenue Million Forecast, by Country 2020 & 2033
- Table 16: Global RTD Protein Industry Volume Billion Forecast, by Country 2020 & 2033
- Table 17: United States RTD Protein Industry Revenue (Million) Forecast, by Application 2020 & 2033
- Table 18: United States RTD Protein Industry Volume (Billion) Forecast, by Application 2020 & 2033
- Table 19: Canada RTD Protein Industry Revenue (Million) Forecast, by Application 2020 & 2033
- Table 20: Canada RTD Protein Industry Volume (Billion) Forecast, by Application 2020 & 2033
- Table 21: Mexico RTD Protein Industry Revenue (Million) Forecast, by Application 2020 & 2033
- Table 22: Mexico RTD Protein Industry Volume (Billion) Forecast, by Application 2020 & 2033
- Table 23: Rest of North America RTD Protein Industry Revenue (Million) Forecast, by Application 2020 & 2033
- Table 24: Rest of North America RTD Protein Industry Volume (Billion) Forecast, by Application 2020 & 2033
- Table 25: Global RTD Protein Industry Revenue Million Forecast, by Source 2020 & 2033
- Table 26: Global RTD Protein Industry Volume Billion Forecast, by Source 2020 & 2033
- Table 27: Global RTD Protein Industry Revenue Million Forecast, by Type of Packaging 2020 & 2033
- Table 28: Global RTD Protein Industry Volume Billion Forecast, by Type of Packaging 2020 & 2033
- Table 29: Global RTD Protein Industry Revenue Million Forecast, by Distribution Channel 2020 & 2033
- Table 30: Global RTD Protein Industry Volume Billion Forecast, by Distribution Channel 2020 & 2033
- Table 31: Global RTD Protein Industry Revenue Million Forecast, by Country 2020 & 2033
- Table 32: Global RTD Protein Industry Volume Billion Forecast, by Country 2020 & 2033
- Table 33: Germany RTD Protein Industry Revenue (Million) Forecast, by Application 2020 & 2033
- Table 34: Germany RTD Protein Industry Volume (Billion) Forecast, by Application 2020 & 2033
- Table 35: United Kingdom RTD Protein Industry Revenue (Million) Forecast, by Application 2020 & 2033
- Table 36: United Kingdom RTD Protein Industry Volume (Billion) Forecast, by Application 2020 & 2033
- Table 37: France RTD Protein Industry Revenue (Million) Forecast, by Application 2020 & 2033
- Table 38: France RTD Protein Industry Volume (Billion) Forecast, by Application 2020 & 2033
- Table 39: Spain RTD Protein Industry Revenue (Million) Forecast, by Application 2020 & 2033
- Table 40: Spain RTD Protein Industry Volume (Billion) Forecast, by Application 2020 & 2033
- Table 41: Italy RTD Protein Industry Revenue (Million) Forecast, by Application 2020 & 2033
- Table 42: Italy RTD Protein Industry Volume (Billion) Forecast, by Application 2020 & 2033
- Table 43: Russia RTD Protein Industry Revenue (Million) Forecast, by Application 2020 & 2033
- Table 44: Russia RTD Protein Industry Volume (Billion) Forecast, by Application 2020 & 2033
- Table 45: Rest of Europe RTD Protein Industry Revenue (Million) Forecast, by Application 2020 & 2033
- Table 46: Rest of Europe RTD Protein Industry Volume (Billion) Forecast, by Application 2020 & 2033
- Table 47: Global RTD Protein Industry Revenue Million Forecast, by Source 2020 & 2033
- Table 48: Global RTD Protein Industry Volume Billion Forecast, by Source 2020 & 2033
- Table 49: Global RTD Protein Industry Revenue Million Forecast, by Type of Packaging 2020 & 2033
- Table 50: Global RTD Protein Industry Volume Billion Forecast, by Type of Packaging 2020 & 2033
- Table 51: Global RTD Protein Industry Revenue Million Forecast, by Distribution Channel 2020 & 2033
- Table 52: Global RTD Protein Industry Volume Billion Forecast, by Distribution Channel 2020 & 2033
- Table 53: Global RTD Protein Industry Revenue Million Forecast, by Country 2020 & 2033
- Table 54: Global RTD Protein Industry Volume Billion Forecast, by Country 2020 & 2033
- Table 55: China RTD Protein Industry Revenue (Million) Forecast, by Application 2020 & 2033
- Table 56: China RTD Protein Industry Volume (Billion) Forecast, by Application 2020 & 2033
- Table 57: Japan RTD Protein Industry Revenue (Million) Forecast, by Application 2020 & 2033
- Table 58: Japan RTD Protein Industry Volume (Billion) Forecast, by Application 2020 & 2033
- Table 59: India RTD Protein Industry Revenue (Million) Forecast, by Application 2020 & 2033
- Table 60: India RTD Protein Industry Volume (Billion) Forecast, by Application 2020 & 2033
- Table 61: Australia RTD Protein Industry Revenue (Million) Forecast, by Application 2020 & 2033
- Table 62: Australia RTD Protein Industry Volume (Billion) Forecast, by Application 2020 & 2033
- Table 63: Rest of Asia Pacific RTD Protein Industry Revenue (Million) Forecast, by Application 2020 & 2033
- Table 64: Rest of Asia Pacific RTD Protein Industry Volume (Billion) Forecast, by Application 2020 & 2033
- Table 65: Global RTD Protein Industry Revenue Million Forecast, by Source 2020 & 2033
- Table 66: Global RTD Protein Industry Volume Billion Forecast, by Source 2020 & 2033
- Table 67: Global RTD Protein Industry Revenue Million Forecast, by Type of Packaging 2020 & 2033
- Table 68: Global RTD Protein Industry Volume Billion Forecast, by Type of Packaging 2020 & 2033
- Table 69: Global RTD Protein Industry Revenue Million Forecast, by Distribution Channel 2020 & 2033
- Table 70: Global RTD Protein Industry Volume Billion Forecast, by Distribution Channel 2020 & 2033
- Table 71: Global RTD Protein Industry Revenue Million Forecast, by Country 2020 & 2033
- Table 72: Global RTD Protein Industry Volume Billion Forecast, by Country 2020 & 2033
- Table 73: Brazil RTD Protein Industry Revenue (Million) Forecast, by Application 2020 & 2033
- Table 74: Brazil RTD Protein Industry Volume (Billion) Forecast, by Application 2020 & 2033
- Table 75: Argentina RTD Protein Industry Revenue (Million) Forecast, by Application 2020 & 2033
- Table 76: Argentina RTD Protein Industry Volume (Billion) Forecast, by Application 2020 & 2033
- Table 77: Rest of South America RTD Protein Industry Revenue (Million) Forecast, by Application 2020 & 2033
- Table 78: Rest of South America RTD Protein Industry Volume (Billion) Forecast, by Application 2020 & 2033
- Table 79: Global RTD Protein Industry Revenue Million Forecast, by Source 2020 & 2033
- Table 80: Global RTD Protein Industry Volume Billion Forecast, by Source 2020 & 2033
- Table 81: Global RTD Protein Industry Revenue Million Forecast, by Type of Packaging 2020 & 2033
- Table 82: Global RTD Protein Industry Volume Billion Forecast, by Type of Packaging 2020 & 2033
- Table 83: Global RTD Protein Industry Revenue Million Forecast, by Distribution Channel 2020 & 2033
- Table 84: Global RTD Protein Industry Volume Billion Forecast, by Distribution Channel 2020 & 2033
- Table 85: Global RTD Protein Industry Revenue Million Forecast, by Country 2020 & 2033
- Table 86: Global RTD Protein Industry Volume Billion Forecast, by Country 2020 & 2033
- Table 87: South Africa RTD Protein Industry Revenue (Million) Forecast, by Application 2020 & 2033
- Table 88: South Africa RTD Protein Industry Volume (Billion) Forecast, by Application 2020 & 2033
- Table 89: United Arab Emirates RTD Protein Industry Revenue (Million) Forecast, by Application 2020 & 2033
- Table 90: United Arab Emirates RTD Protein Industry Volume (Billion) Forecast, by Application 2020 & 2033
- Table 91: Rest of Middle East and Africa RTD Protein Industry Revenue (Million) Forecast, by Application 2020 & 2033
- Table 92: Rest of Middle East and Africa RTD Protein Industry Volume (Billion) Forecast, by Application 2020 & 2033
Frequently Asked Questions
1. What is the projected Compound Annual Growth Rate (CAGR) of the RTD Protein Industry?
The projected CAGR is approximately 7.72%.
2. Which companies are prominent players in the RTD Protein Industry?
Key companies in the market include Kellogg Company, Glanbia PLC, PepsiCo Inc, Halen Brands, Post Holdings Inc, Koia, Abbott Nutrition, Labrada Nutrition, The Coca Cola Company, Pure Protein*List Not Exhaustive.
3. What are the main segments of the RTD Protein Industry?
The market segments include Source, Type of Packaging, Distribution Channel.
4. Can you provide details about the market size?
The market size is estimated to be USD 1.68 Million as of 2022.
5. What are some drivers contributing to market growth?
N/A
6. What are the notable trends driving market growth?
Strong Demand from Health Conscious Consumers.
7. Are there any restraints impacting market growth?
N/A
8. Can you provide examples of recent developments in the market?
March 2022: QNT SA and Qimia Makmal Arad Company entered a partnership. Qimia is authorized in Iran to distribute QNT's functional foods, supplements, and sports nutrition products.
9. What pricing options are available for accessing the report?
Pricing options include single-user, multi-user, and enterprise licenses priced at USD 4750, USD 5250, and USD 8750 respectively.
10. Is the market size provided in terms of value or volume?
The market size is provided in terms of value, measured in Million and volume, measured in Billion.
11. Are there any specific market keywords associated with the report?
Yes, the market keyword associated with the report is "RTD Protein Industry," which aids in identifying and referencing the specific market segment covered.
12. How do I determine which pricing option suits my needs best?
The pricing options vary based on user requirements and access needs. Individual users may opt for single-user licenses, while businesses requiring broader access may choose multi-user or enterprise licenses for cost-effective access to the report.
13. Are there any additional resources or data provided in the RTD Protein Industry report?
While the report offers comprehensive insights, it's advisable to review the specific contents or supplementary materials provided to ascertain if additional resources or data are available.
14. How can I stay updated on further developments or reports in the RTD Protein Industry?
To stay informed about further developments, trends, and reports in the RTD Protein Industry, consider subscribing to industry newsletters, following relevant companies and organizations, or regularly checking reputable industry news sources and publications.
Methodology
Step 1 - Identification of Relevant Samples Size from Population Database


Step 2 - Approaches for Defining Global Market Size (Value, Volume* & Price*)

Note*: In applicable scenarios
Step 3 - Data Sources
Primary Research
- Web Analytics
- Survey Reports
- Research Institute
- Latest Research Reports
- Opinion Leaders
Secondary Research
- Annual Reports
- White Paper
- Latest Press Release
- Industry Association
- Paid Database
- Investor Presentations

Step 4 - Data Triangulation
Involves using different sources of information in order to increase the validity of a study
These sources are likely to be stakeholders in a program - participants, other researchers, program staff, other community members, and so on.
Then we put all data in single framework & apply various statistical tools to find out the dynamic on the market.
During the analysis stage, feedback from the stakeholder groups would be compared to determine areas of agreement as well as areas of divergence