

Key Insights
The US audit industry, a cornerstone of financial accountability, is projected to maintain a steady growth trajectory. With a 2025 market size of $50.24 billion, and a Compound Annual Growth Rate (CAGR) of 3.27% from 2019 to 2033, the industry is expected to reach approximately $70 billion by 2033. This growth is fueled by several factors. Increased regulatory scrutiny following high-profile accounting scandals necessitates robust audit practices, driving demand for experienced professionals. The growing complexity of global business operations, including cross-border transactions and the adoption of new technologies, also contributes to the need for sophisticated audit services. Furthermore, the increasing focus on environmental, social, and governance (ESG) reporting necessitates specialized auditing expertise, creating new market opportunities. Major players like Deloitte, EY, KPMG, PwC, and others dominate the market, leveraging their global networks and established reputations. However, smaller regional firms and niche players also contribute significantly to the landscape, offering specialized services and catering to the needs of smaller businesses.
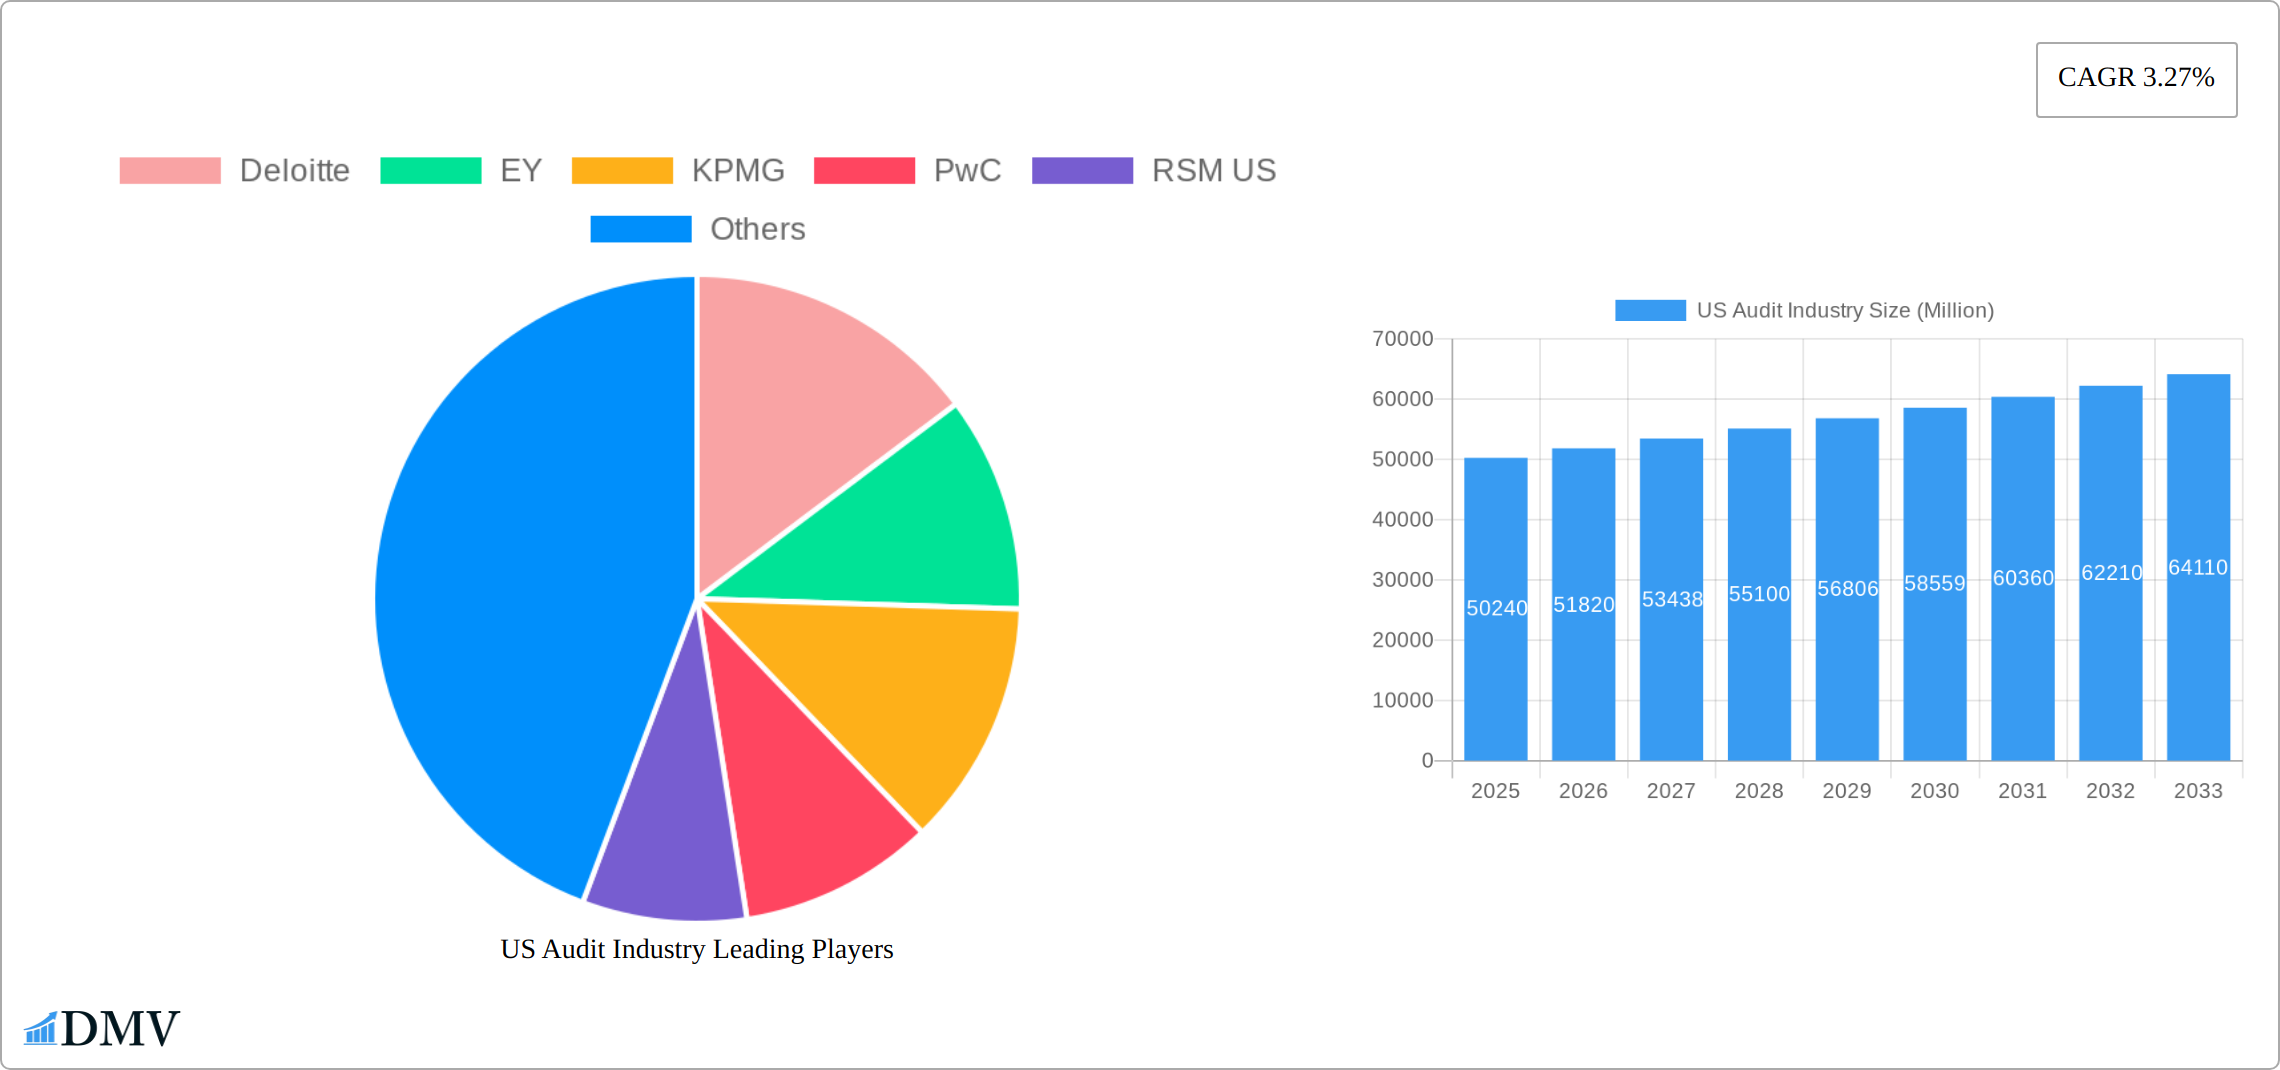
US Audit Industry Market Size (In Billion)
Despite the positive outlook, the industry faces certain challenges. The increasing use of automation and artificial intelligence in audit processes, while boosting efficiency, requires significant investment and skilled professionals capable of managing and interpreting the generated data. The ongoing pressure to reduce audit fees while maintaining high quality standards presents a delicate balancing act for firms. Furthermore, talent acquisition and retention remain crucial concerns for the industry, particularly in attracting and retaining professionals equipped with the technical and analytical skills needed to navigate the ever-evolving business environment. Competition remains fierce amongst the “Big Four” and other national firms, leading to constant innovation and the need for continuous adaptation to remain competitive.
US Audit Industry Company Market Share
US Audit Industry Market Composition & Trends
The US audit industry is characterized by a highly concentrated market, with the "Big Four" – Deloitte, EY, KPMG, and PwC – holding substantial market sway. These giants collectively command a significant portion of the market share, with Deloitte leading at approximately 25%, followed closely by EY, KPMG, and PwC, each securing around 20% of the market. The landscape is continuously shaped by technological innovation, most notably the integration of advanced Artificial Intelligence (AI) and sophisticated data analytics, which are fundamentally transforming traditional audit methodologies. The regulatory environment remains dynamic, with the Public Company Accounting Oversight Board (PCAOB) consistently enforcing rigorous standards that directly impact market operations and firm strategies. Emerging substitute solutions, such as advanced automated audit software, are also gaining prominence, presenting both challenges and opportunities for established auditing practices.
The spectrum of end-users in the US audit industry spans from large, publicly traded corporations with intricate financial structures to burgeoning small and medium-sized businesses, each presenting unique auditing requirements. Mergers and acquisitions (M&A) continue to be a significant force in shaping the industry. Notable transactions include the acquisition of RSM McGladrey by RSM US for USD 500 Million in 2019, underscoring a trend towards consolidation and expanded service capabilities. Further examples of strategic M&A activity include:
- BDO USA's strategic acquisition of a prominent regional firm for USD 100 Million in 2021, bolstering its geographic reach and client base.
- Grant Thornton's calculated purchase of a specialized technology consulting firm for USD 150 Million in 2022, aimed at enhancing its digital transformation and advisory services.
These strategic transactions underscore the industry's ongoing drive towards consolidation, the expansion of diverse service offerings, and the pursuit of synergistic growth opportunities.
US Audit Industry Industry Evolution
The US audit industry has demonstrated consistent and robust growth over the past decade. From 2019 to 2024, the industry experienced a Compound Annual Growth Rate (CAGR) of approximately 4%. Projections indicate a sustained upward trajectory, with an anticipated CAGR of 5% anticipated from 2025 through 2033. A primary catalyst for this evolution is the pervasive integration of technology. Specifically, the adoption of AI and machine learning into audit processes has demonstrably improved efficiency and enhanced accuracy. Evidence of this trend is seen in the escalating adoption rate of AI in audits, which has risen from a modest 10% in 2019 to an estimated 30% by 2025.
Furthermore, evolving client demands are significantly influencing the industry's direction. There is an increasing emphasis on transparency and the provision of real-time financial reporting. Clients are actively seeking auditors who can offer not only stringent compliance assurance but also strategic, forward-looking insights. The demand for specialized audits, particularly in the realm of sustainability and Environmental, Social, and Governance (ESG), has seen a notable surge, with requests for ESG audits increasing by 15% over the last three years. These shifts are compelling audit firms to broaden their service portfolios, incorporating niche and specialized audit services to meet the dynamic needs of the modern business environment.
Leading Regions, Countries, or Segments in US Audit Industry
The New York metropolitan area stands out as the dominant region in the US audit industry, driven by its concentration of financial services firms and large corporations. Key drivers of this dominance include:
- Significant investment in fintech, with over USD 2 Billion invested annually in audit technology startups.
- Robust regulatory support from the New York State Board of Accountancy, fostering a conducive environment for audit firms.
New York's dominance is further reinforced by its status as a global financial hub, attracting top-tier audit firms and talent. The region's economic vibrancy and the presence of major stock exchanges contribute to a high demand for audit services. Additionally, the area's focus on innovation and technology adoption has positioned it at the forefront of the industry's evolution.
- The technology segment within the audit industry is rapidly growing, with a projected CAGR of 6% from 2025 to 2033. This segment's growth is fueled by the increasing reliance on data analytics and AI in audit processes.
- The financial services sector remains a critical segment, accounting for over 40% of the total audit market due to stringent regulatory requirements and the complexity of financial instruments.
US Audit Industry Product Innovations
Innovations in the US audit industry are centered around enhancing audit efficiency and accuracy. The adoption of AI and machine learning has led to the development of predictive analytics tools that can identify anomalies and potential risks in real-time. These tools offer a unique selling proposition by providing auditors with actionable insights, thereby reducing the time and cost associated with traditional audit methods. Additionally, blockchain technology is being explored for its potential to create immutable audit trails, further bolstering the integrity of audit processes.
Propelling Factors for US Audit Industry Growth
Several key factors are driving the sustained growth of the US audit industry. Technological advancements, including the widespread integration of AI and machine learning, are instrumental in boosting audit efficiency and the precision of findings. Economic complexities, such as the increasing sophistication of financial instruments and the ever-present imperative for stringent regulatory compliance, create a sustained demand for high-caliber, specialized audit services. Regulatory mandates, exemplified by the rigorous standards set forth by the PCAOB, continue to shape and direct the industry's growth trajectory. The burgeoning demand for ESG audits, for instance, directly reflects evolving regulatory expectations and a growing awareness among stakeholders and consumers alike.
Obstacles in the US Audit Industry Market
The US audit industry faces several obstacles that could impede its growth. Regulatory challenges, such as evolving compliance standards, require continuous adaptation and investment. Supply chain disruptions, particularly in technology procurement, can delay the implementation of new audit tools. Competitive pressures are intense, with firms vying for market share through aggressive pricing and service differentiation. These obstacles have a quantifiable impact, with an estimated 2% reduction in industry growth due to regulatory compliance costs and a 1% reduction due to supply chain issues.
Future Opportunities in US Audit Industry
The US audit industry is poised for significant future growth, with emerging opportunities in several key areas. The burgeoning demand for specialized services, particularly in the domain of ESG audits, presents a substantial avenue for expansion. Technological innovations, including the integration of cutting-edge technologies like blockchain and advanced AI, offer unparalleled opportunities for service enhancement and the development of novel audit solutions. Furthermore, evolving consumer trends, such as the heightened expectation for real-time financial reporting and enhanced transparency, provide audit firms with a distinct opportunity to differentiate themselves by delivering superior, value-added services that go beyond traditional compliance.
Major Players in the US Audit Industry Ecosystem
- Deloitte
- EY
- KPMG
- PwC
- RSM US
- Grant Thornton LLP
- A.T. Kearney
- BDO USA
- CBIZ & Mayer Hoffman McCann
- Crowe Horwath
**List Not Exhaustive
Key Developments in US Audit Industry Industry
- May 2023: Deloitte and Google Cloud bolstered their decade-long alliance, focusing on deploying Google Cloud's cutting-edge Generative AI capabilities across various industries. This development is set to enhance audit efficiency and introduce new service offerings.
- May 2023: EY, after partnering with Microsoft, unveiled over 20 new Assurance technology capabilities. This marks the end of the first year of a four-year investment exceeding USD 1 billion to deliver the company's next-generation Assurance technology platform, significantly impacting market dynamics by enhancing audit accuracy and client service.
Strategic US Audit Industry Market Forecast
The US audit industry is poised for robust growth, driven by technological advancements, regulatory demands, and shifting consumer expectations. The integration of AI and machine learning will continue to revolutionize audit processes, offering new opportunities for efficiency and accuracy. The demand for ESG audits and real-time reporting presents significant market potential, as firms adapt to meet these evolving needs. The industry's future growth is expected to be fueled by these catalysts, positioning it for sustained expansion through 2033.
US Audit Industry Segmentation
-
1. Type
- 1.1. Internal Audit
- 1.2. External Audit
-
2. Service line
- 2.1. Operational Audits
- 2.2. Financial Audits
- 2.3. Advisory and Consulting
- 2.4. Investigation Audit
- 2.5. Information System Audit
- 2.6. Compliance Audit
- 2.7. Other
US Audit Industry Segmentation By Geography
-
1. North America
- 1.1. United States
- 1.2. Canada
- 1.3. Mexico
-
2. South America
- 2.1. Brazil
- 2.2. Argentina
- 2.3. Rest of South America
-
3. Europe
- 3.1. United Kingdom
- 3.2. Germany
- 3.3. France
- 3.4. Italy
- 3.5. Spain
- 3.6. Russia
- 3.7. Benelux
- 3.8. Nordics
- 3.9. Rest of Europe
-
4. Middle East & Africa
- 4.1. Turkey
- 4.2. Israel
- 4.3. GCC
- 4.4. North Africa
- 4.5. South Africa
- 4.6. Rest of Middle East & Africa
-
5. Asia Pacific
- 5.1. China
- 5.2. India
- 5.3. Japan
- 5.4. South Korea
- 5.5. ASEAN
- 5.6. Oceania
- 5.7. Rest of Asia Pacific
US Audit Industry Regional Market Share
Geographic Coverage of US Audit Industry
US Audit Industry REPORT HIGHLIGHTS
| Aspects | Details |
|---|---|
| Study Period | 2020-2034 |
| Base Year | 2025 |
| Estimated Year | 2026 |
| Forecast Period | 2026-2034 |
| Historical Period | 2020-2025 |
| Growth Rate | CAGR of 3.27% from 2020-2034 |
| Segmentation |
|
Table of Contents
- 1. Introduction
- 1.1. Research Scope
- 1.2. Market Segmentation
- 1.3. Research Objective
- 1.4. Definitions and Assumptions
- 2. Executive Summary
- 2.1. Market Snapshot
- 3. Market Dynamics
- 3.1. Market Drivers
- 3.2. Market Restrains
- 3.3. Market Trends
- 3.4. Market Opportunities
- 4. Market Factor Analysis
- 4.1. Porters Five Forces
- 4.1.1. Bargaining Power of Suppliers
- 4.1.2. Bargaining Power of Buyers
- 4.1.3. Threat of New Entrants
- 4.1.4. Threat of Substitutes
- 4.1.5. Competitive Rivalry
- 4.2. PESTEL analysis
- 4.3. BCG Analysis
- 4.3.1. Stars (High Growth, High Market Share)
- 4.3.2. Cash Cows (Low Growth, High Market Share)
- 4.3.3. Question Mark (High Growth, Low Market Share)
- 4.3.4. Dogs (Low Growth, Low Market Share)
- 4.4. Ansoff Matrix Analysis
- 4.5. Supply Chain Analysis
- 4.6. Regulatory Landscape
- 4.7. Current Market Potential and Opportunity Assessment (TAM–SAM–SOM Framework)
- 4.8. DMV Analyst Note
- 4.1. Porters Five Forces
- 5. Market Analysis, Insights and Forecast 2021-2033
- 5.1. Market Analysis, Insights and Forecast - by Type
- 5.1.1. Internal Audit
- 5.1.2. External Audit
- 5.2. Market Analysis, Insights and Forecast - by Service line
- 5.2.1. Operational Audits
- 5.2.2. Financial Audits
- 5.2.3. Advisory and Consulting
- 5.2.4. Investigation Audit
- 5.2.5. Information System Audit
- 5.2.6. Compliance Audit
- 5.2.7. Other
- 5.3. Market Analysis, Insights and Forecast - by Region
- 5.3.1. North America
- 5.3.2. South America
- 5.3.3. Europe
- 5.3.4. Middle East & Africa
- 5.3.5. Asia Pacific
- 5.1. Market Analysis, Insights and Forecast - by Type
- 6. Global US Audit Industry Analysis, Insights and Forecast, 2021-2033
- 6.1. Market Analysis, Insights and Forecast - by Type
- 6.1.1. Internal Audit
- 6.1.2. External Audit
- 6.2. Market Analysis, Insights and Forecast - by Service line
- 6.2.1. Operational Audits
- 6.2.2. Financial Audits
- 6.2.3. Advisory and Consulting
- 6.2.4. Investigation Audit
- 6.2.5. Information System Audit
- 6.2.6. Compliance Audit
- 6.2.7. Other
- 6.1. Market Analysis, Insights and Forecast - by Type
- 7. North America US Audit Industry Analysis, Insights and Forecast, 2020-2032
- 7.1. Market Analysis, Insights and Forecast - by Type
- 7.1.1. Internal Audit
- 7.1.2. External Audit
- 7.2. Market Analysis, Insights and Forecast - by Service line
- 7.2.1. Operational Audits
- 7.2.2. Financial Audits
- 7.2.3. Advisory and Consulting
- 7.2.4. Investigation Audit
- 7.2.5. Information System Audit
- 7.2.6. Compliance Audit
- 7.2.7. Other
- 7.1. Market Analysis, Insights and Forecast - by Type
- 8. South America US Audit Industry Analysis, Insights and Forecast, 2020-2032
- 8.1. Market Analysis, Insights and Forecast - by Type
- 8.1.1. Internal Audit
- 8.1.2. External Audit
- 8.2. Market Analysis, Insights and Forecast - by Service line
- 8.2.1. Operational Audits
- 8.2.2. Financial Audits
- 8.2.3. Advisory and Consulting
- 8.2.4. Investigation Audit
- 8.2.5. Information System Audit
- 8.2.6. Compliance Audit
- 8.2.7. Other
- 8.1. Market Analysis, Insights and Forecast - by Type
- 9. Europe US Audit Industry Analysis, Insights and Forecast, 2020-2032
- 9.1. Market Analysis, Insights and Forecast - by Type
- 9.1.1. Internal Audit
- 9.1.2. External Audit
- 9.2. Market Analysis, Insights and Forecast - by Service line
- 9.2.1. Operational Audits
- 9.2.2. Financial Audits
- 9.2.3. Advisory and Consulting
- 9.2.4. Investigation Audit
- 9.2.5. Information System Audit
- 9.2.6. Compliance Audit
- 9.2.7. Other
- 9.1. Market Analysis, Insights and Forecast - by Type
- 10. Middle East & Africa US Audit Industry Analysis, Insights and Forecast, 2020-2032
- 10.1. Market Analysis, Insights and Forecast - by Type
- 10.1.1. Internal Audit
- 10.1.2. External Audit
- 10.2. Market Analysis, Insights and Forecast - by Service line
- 10.2.1. Operational Audits
- 10.2.2. Financial Audits
- 10.2.3. Advisory and Consulting
- 10.2.4. Investigation Audit
- 10.2.5. Information System Audit
- 10.2.6. Compliance Audit
- 10.2.7. Other
- 10.1. Market Analysis, Insights and Forecast - by Type
- 11. Asia Pacific US Audit Industry Analysis, Insights and Forecast, 2020-2032
- 11.1. Market Analysis, Insights and Forecast - by Type
- 11.1.1. Internal Audit
- 11.1.2. External Audit
- 11.2. Market Analysis, Insights and Forecast - by Service line
- 11.2.1. Operational Audits
- 11.2.2. Financial Audits
- 11.2.3. Advisory and Consulting
- 11.2.4. Investigation Audit
- 11.2.5. Information System Audit
- 11.2.6. Compliance Audit
- 11.2.7. Other
- 11.1. Market Analysis, Insights and Forecast - by Type
- 12. Competitive Analysis
- 12.1. Company Profiles
- 12.1.1 Deloitte
- 12.1.1.1. Company Overview
- 12.1.1.2. Products
- 12.1.1.3. Company Financials
- 12.1.1.4. SWOT Analysis
- 12.1.2 EY
- 12.1.2.1. Company Overview
- 12.1.2.2. Products
- 12.1.2.3. Company Financials
- 12.1.2.4. SWOT Analysis
- 12.1.3 KPMG
- 12.1.3.1. Company Overview
- 12.1.3.2. Products
- 12.1.3.3. Company Financials
- 12.1.3.4. SWOT Analysis
- 12.1.4 PwC
- 12.1.4.1. Company Overview
- 12.1.4.2. Products
- 12.1.4.3. Company Financials
- 12.1.4.4. SWOT Analysis
- 12.1.5 RSM US
- 12.1.5.1. Company Overview
- 12.1.5.2. Products
- 12.1.5.3. Company Financials
- 12.1.5.4. SWOT Analysis
- 12.1.6 Grant Thornton LLP
- 12.1.6.1. Company Overview
- 12.1.6.2. Products
- 12.1.6.3. Company Financials
- 12.1.6.4. SWOT Analysis
- 12.1.7 A T Kearney
- 12.1.7.1. Company Overview
- 12.1.7.2. Products
- 12.1.7.3. Company Financials
- 12.1.7.4. SWOT Analysis
- 12.1.8 BDO USA
- 12.1.8.1. Company Overview
- 12.1.8.2. Products
- 12.1.8.3. Company Financials
- 12.1.8.4. SWOT Analysis
- 12.1.9 CBIZ & Mayer Hoffman McCann
- 12.1.9.1. Company Overview
- 12.1.9.2. Products
- 12.1.9.3. Company Financials
- 12.1.9.4. SWOT Analysis
- 12.1.10 Crowe Horwath**List Not Exhaustive
- 12.1.10.1. Company Overview
- 12.1.10.2. Products
- 12.1.10.3. Company Financials
- 12.1.10.4. SWOT Analysis
- 12.1.1 Deloitte
- 12.2. Market Entropy
- 12.2.1 Company's Key Areas Served
- 12.2.2 Recent Developments
- 12.3. Company Market Share Analysis 2025
- 12.3.1 Top 5 Companies Market Share Analysis
- 12.3.2 Top 3 Companies Market Share Analysis
- 12.4. List of Potential Customers
- 13. Research Methodology
List of Figures
- Figure 1: Global US Audit Industry Revenue Breakdown (Million, %) by Region 2025 & 2033
- Figure 2: Global US Audit Industry Volume Breakdown (Billion, %) by Region 2025 & 2033
- Figure 3: North America US Audit Industry Revenue (Million), by Type 2025 & 2033
- Figure 4: North America US Audit Industry Volume (Billion), by Type 2025 & 2033
- Figure 5: North America US Audit Industry Revenue Share (%), by Type 2025 & 2033
- Figure 6: North America US Audit Industry Volume Share (%), by Type 2025 & 2033
- Figure 7: North America US Audit Industry Revenue (Million), by Service line 2025 & 2033
- Figure 8: North America US Audit Industry Volume (Billion), by Service line 2025 & 2033
- Figure 9: North America US Audit Industry Revenue Share (%), by Service line 2025 & 2033
- Figure 10: North America US Audit Industry Volume Share (%), by Service line 2025 & 2033
- Figure 11: North America US Audit Industry Revenue (Million), by Country 2025 & 2033
- Figure 12: North America US Audit Industry Volume (Billion), by Country 2025 & 2033
- Figure 13: North America US Audit Industry Revenue Share (%), by Country 2025 & 2033
- Figure 14: North America US Audit Industry Volume Share (%), by Country 2025 & 2033
- Figure 15: South America US Audit Industry Revenue (Million), by Type 2025 & 2033
- Figure 16: South America US Audit Industry Volume (Billion), by Type 2025 & 2033
- Figure 17: South America US Audit Industry Revenue Share (%), by Type 2025 & 2033
- Figure 18: South America US Audit Industry Volume Share (%), by Type 2025 & 2033
- Figure 19: South America US Audit Industry Revenue (Million), by Service line 2025 & 2033
- Figure 20: South America US Audit Industry Volume (Billion), by Service line 2025 & 2033
- Figure 21: South America US Audit Industry Revenue Share (%), by Service line 2025 & 2033
- Figure 22: South America US Audit Industry Volume Share (%), by Service line 2025 & 2033
- Figure 23: South America US Audit Industry Revenue (Million), by Country 2025 & 2033
- Figure 24: South America US Audit Industry Volume (Billion), by Country 2025 & 2033
- Figure 25: South America US Audit Industry Revenue Share (%), by Country 2025 & 2033
- Figure 26: South America US Audit Industry Volume Share (%), by Country 2025 & 2033
- Figure 27: Europe US Audit Industry Revenue (Million), by Type 2025 & 2033
- Figure 28: Europe US Audit Industry Volume (Billion), by Type 2025 & 2033
- Figure 29: Europe US Audit Industry Revenue Share (%), by Type 2025 & 2033
- Figure 30: Europe US Audit Industry Volume Share (%), by Type 2025 & 2033
- Figure 31: Europe US Audit Industry Revenue (Million), by Service line 2025 & 2033
- Figure 32: Europe US Audit Industry Volume (Billion), by Service line 2025 & 2033
- Figure 33: Europe US Audit Industry Revenue Share (%), by Service line 2025 & 2033
- Figure 34: Europe US Audit Industry Volume Share (%), by Service line 2025 & 2033
- Figure 35: Europe US Audit Industry Revenue (Million), by Country 2025 & 2033
- Figure 36: Europe US Audit Industry Volume (Billion), by Country 2025 & 2033
- Figure 37: Europe US Audit Industry Revenue Share (%), by Country 2025 & 2033
- Figure 38: Europe US Audit Industry Volume Share (%), by Country 2025 & 2033
- Figure 39: Middle East & Africa US Audit Industry Revenue (Million), by Type 2025 & 2033
- Figure 40: Middle East & Africa US Audit Industry Volume (Billion), by Type 2025 & 2033
- Figure 41: Middle East & Africa US Audit Industry Revenue Share (%), by Type 2025 & 2033
- Figure 42: Middle East & Africa US Audit Industry Volume Share (%), by Type 2025 & 2033
- Figure 43: Middle East & Africa US Audit Industry Revenue (Million), by Service line 2025 & 2033
- Figure 44: Middle East & Africa US Audit Industry Volume (Billion), by Service line 2025 & 2033
- Figure 45: Middle East & Africa US Audit Industry Revenue Share (%), by Service line 2025 & 2033
- Figure 46: Middle East & Africa US Audit Industry Volume Share (%), by Service line 2025 & 2033
- Figure 47: Middle East & Africa US Audit Industry Revenue (Million), by Country 2025 & 2033
- Figure 48: Middle East & Africa US Audit Industry Volume (Billion), by Country 2025 & 2033
- Figure 49: Middle East & Africa US Audit Industry Revenue Share (%), by Country 2025 & 2033
- Figure 50: Middle East & Africa US Audit Industry Volume Share (%), by Country 2025 & 2033
- Figure 51: Asia Pacific US Audit Industry Revenue (Million), by Type 2025 & 2033
- Figure 52: Asia Pacific US Audit Industry Volume (Billion), by Type 2025 & 2033
- Figure 53: Asia Pacific US Audit Industry Revenue Share (%), by Type 2025 & 2033
- Figure 54: Asia Pacific US Audit Industry Volume Share (%), by Type 2025 & 2033
- Figure 55: Asia Pacific US Audit Industry Revenue (Million), by Service line 2025 & 2033
- Figure 56: Asia Pacific US Audit Industry Volume (Billion), by Service line 2025 & 2033
- Figure 57: Asia Pacific US Audit Industry Revenue Share (%), by Service line 2025 & 2033
- Figure 58: Asia Pacific US Audit Industry Volume Share (%), by Service line 2025 & 2033
- Figure 59: Asia Pacific US Audit Industry Revenue (Million), by Country 2025 & 2033
- Figure 60: Asia Pacific US Audit Industry Volume (Billion), by Country 2025 & 2033
- Figure 61: Asia Pacific US Audit Industry Revenue Share (%), by Country 2025 & 2033
- Figure 62: Asia Pacific US Audit Industry Volume Share (%), by Country 2025 & 2033
List of Tables
- Table 1: Global US Audit Industry Revenue Million Forecast, by Type 2020 & 2033
- Table 2: Global US Audit Industry Volume Billion Forecast, by Type 2020 & 2033
- Table 3: Global US Audit Industry Revenue Million Forecast, by Service line 2020 & 2033
- Table 4: Global US Audit Industry Volume Billion Forecast, by Service line 2020 & 2033
- Table 5: Global US Audit Industry Revenue Million Forecast, by Region 2020 & 2033
- Table 6: Global US Audit Industry Volume Billion Forecast, by Region 2020 & 2033
- Table 7: Global US Audit Industry Revenue Million Forecast, by Type 2020 & 2033
- Table 8: Global US Audit Industry Volume Billion Forecast, by Type 2020 & 2033
- Table 9: Global US Audit Industry Revenue Million Forecast, by Service line 2020 & 2033
- Table 10: Global US Audit Industry Volume Billion Forecast, by Service line 2020 & 2033
- Table 11: Global US Audit Industry Revenue Million Forecast, by Country 2020 & 2033
- Table 12: Global US Audit Industry Volume Billion Forecast, by Country 2020 & 2033
- Table 13: United States US Audit Industry Revenue (Million) Forecast, by Application 2020 & 2033
- Table 14: United States US Audit Industry Volume (Billion) Forecast, by Application 2020 & 2033
- Table 15: Canada US Audit Industry Revenue (Million) Forecast, by Application 2020 & 2033
- Table 16: Canada US Audit Industry Volume (Billion) Forecast, by Application 2020 & 2033
- Table 17: Mexico US Audit Industry Revenue (Million) Forecast, by Application 2020 & 2033
- Table 18: Mexico US Audit Industry Volume (Billion) Forecast, by Application 2020 & 2033
- Table 19: Global US Audit Industry Revenue Million Forecast, by Type 2020 & 2033
- Table 20: Global US Audit Industry Volume Billion Forecast, by Type 2020 & 2033
- Table 21: Global US Audit Industry Revenue Million Forecast, by Service line 2020 & 2033
- Table 22: Global US Audit Industry Volume Billion Forecast, by Service line 2020 & 2033
- Table 23: Global US Audit Industry Revenue Million Forecast, by Country 2020 & 2033
- Table 24: Global US Audit Industry Volume Billion Forecast, by Country 2020 & 2033
- Table 25: Brazil US Audit Industry Revenue (Million) Forecast, by Application 2020 & 2033
- Table 26: Brazil US Audit Industry Volume (Billion) Forecast, by Application 2020 & 2033
- Table 27: Argentina US Audit Industry Revenue (Million) Forecast, by Application 2020 & 2033
- Table 28: Argentina US Audit Industry Volume (Billion) Forecast, by Application 2020 & 2033
- Table 29: Rest of South America US Audit Industry Revenue (Million) Forecast, by Application 2020 & 2033
- Table 30: Rest of South America US Audit Industry Volume (Billion) Forecast, by Application 2020 & 2033
- Table 31: Global US Audit Industry Revenue Million Forecast, by Type 2020 & 2033
- Table 32: Global US Audit Industry Volume Billion Forecast, by Type 2020 & 2033
- Table 33: Global US Audit Industry Revenue Million Forecast, by Service line 2020 & 2033
- Table 34: Global US Audit Industry Volume Billion Forecast, by Service line 2020 & 2033
- Table 35: Global US Audit Industry Revenue Million Forecast, by Country 2020 & 2033
- Table 36: Global US Audit Industry Volume Billion Forecast, by Country 2020 & 2033
- Table 37: United Kingdom US Audit Industry Revenue (Million) Forecast, by Application 2020 & 2033
- Table 38: United Kingdom US Audit Industry Volume (Billion) Forecast, by Application 2020 & 2033
- Table 39: Germany US Audit Industry Revenue (Million) Forecast, by Application 2020 & 2033
- Table 40: Germany US Audit Industry Volume (Billion) Forecast, by Application 2020 & 2033
- Table 41: France US Audit Industry Revenue (Million) Forecast, by Application 2020 & 2033
- Table 42: France US Audit Industry Volume (Billion) Forecast, by Application 2020 & 2033
- Table 43: Italy US Audit Industry Revenue (Million) Forecast, by Application 2020 & 2033
- Table 44: Italy US Audit Industry Volume (Billion) Forecast, by Application 2020 & 2033
- Table 45: Spain US Audit Industry Revenue (Million) Forecast, by Application 2020 & 2033
- Table 46: Spain US Audit Industry Volume (Billion) Forecast, by Application 2020 & 2033
- Table 47: Russia US Audit Industry Revenue (Million) Forecast, by Application 2020 & 2033
- Table 48: Russia US Audit Industry Volume (Billion) Forecast, by Application 2020 & 2033
- Table 49: Benelux US Audit Industry Revenue (Million) Forecast, by Application 2020 & 2033
- Table 50: Benelux US Audit Industry Volume (Billion) Forecast, by Application 2020 & 2033
- Table 51: Nordics US Audit Industry Revenue (Million) Forecast, by Application 2020 & 2033
- Table 52: Nordics US Audit Industry Volume (Billion) Forecast, by Application 2020 & 2033
- Table 53: Rest of Europe US Audit Industry Revenue (Million) Forecast, by Application 2020 & 2033
- Table 54: Rest of Europe US Audit Industry Volume (Billion) Forecast, by Application 2020 & 2033
- Table 55: Global US Audit Industry Revenue Million Forecast, by Type 2020 & 2033
- Table 56: Global US Audit Industry Volume Billion Forecast, by Type 2020 & 2033
- Table 57: Global US Audit Industry Revenue Million Forecast, by Service line 2020 & 2033
- Table 58: Global US Audit Industry Volume Billion Forecast, by Service line 2020 & 2033
- Table 59: Global US Audit Industry Revenue Million Forecast, by Country 2020 & 2033
- Table 60: Global US Audit Industry Volume Billion Forecast, by Country 2020 & 2033
- Table 61: Turkey US Audit Industry Revenue (Million) Forecast, by Application 2020 & 2033
- Table 62: Turkey US Audit Industry Volume (Billion) Forecast, by Application 2020 & 2033
- Table 63: Israel US Audit Industry Revenue (Million) Forecast, by Application 2020 & 2033
- Table 64: Israel US Audit Industry Volume (Billion) Forecast, by Application 2020 & 2033
- Table 65: GCC US Audit Industry Revenue (Million) Forecast, by Application 2020 & 2033
- Table 66: GCC US Audit Industry Volume (Billion) Forecast, by Application 2020 & 2033
- Table 67: North Africa US Audit Industry Revenue (Million) Forecast, by Application 2020 & 2033
- Table 68: North Africa US Audit Industry Volume (Billion) Forecast, by Application 2020 & 2033
- Table 69: South Africa US Audit Industry Revenue (Million) Forecast, by Application 2020 & 2033
- Table 70: South Africa US Audit Industry Volume (Billion) Forecast, by Application 2020 & 2033
- Table 71: Rest of Middle East & Africa US Audit Industry Revenue (Million) Forecast, by Application 2020 & 2033
- Table 72: Rest of Middle East & Africa US Audit Industry Volume (Billion) Forecast, by Application 2020 & 2033
- Table 73: Global US Audit Industry Revenue Million Forecast, by Type 2020 & 2033
- Table 74: Global US Audit Industry Volume Billion Forecast, by Type 2020 & 2033
- Table 75: Global US Audit Industry Revenue Million Forecast, by Service line 2020 & 2033
- Table 76: Global US Audit Industry Volume Billion Forecast, by Service line 2020 & 2033
- Table 77: Global US Audit Industry Revenue Million Forecast, by Country 2020 & 2033
- Table 78: Global US Audit Industry Volume Billion Forecast, by Country 2020 & 2033
- Table 79: China US Audit Industry Revenue (Million) Forecast, by Application 2020 & 2033
- Table 80: China US Audit Industry Volume (Billion) Forecast, by Application 2020 & 2033
- Table 81: India US Audit Industry Revenue (Million) Forecast, by Application 2020 & 2033
- Table 82: India US Audit Industry Volume (Billion) Forecast, by Application 2020 & 2033
- Table 83: Japan US Audit Industry Revenue (Million) Forecast, by Application 2020 & 2033
- Table 84: Japan US Audit Industry Volume (Billion) Forecast, by Application 2020 & 2033
- Table 85: South Korea US Audit Industry Revenue (Million) Forecast, by Application 2020 & 2033
- Table 86: South Korea US Audit Industry Volume (Billion) Forecast, by Application 2020 & 2033
- Table 87: ASEAN US Audit Industry Revenue (Million) Forecast, by Application 2020 & 2033
- Table 88: ASEAN US Audit Industry Volume (Billion) Forecast, by Application 2020 & 2033
- Table 89: Oceania US Audit Industry Revenue (Million) Forecast, by Application 2020 & 2033
- Table 90: Oceania US Audit Industry Volume (Billion) Forecast, by Application 2020 & 2033
- Table 91: Rest of Asia Pacific US Audit Industry Revenue (Million) Forecast, by Application 2020 & 2033
- Table 92: Rest of Asia Pacific US Audit Industry Volume (Billion) Forecast, by Application 2020 & 2033
Frequently Asked Questions
1. What is the projected Compound Annual Growth Rate (CAGR) of the US Audit Industry?
The projected CAGR is approximately 3.27%.
2. Which companies are prominent players in the US Audit Industry?
Key companies in the market include Deloitte, EY, KPMG, PwC, RSM US, Grant Thornton LLP, A T Kearney, BDO USA, CBIZ & Mayer Hoffman McCann, Crowe Horwath**List Not Exhaustive.
3. What are the main segments of the US Audit Industry?
The market segments include Type, Service line.
4. Can you provide details about the market size?
The market size is estimated to be USD 50.24 Million as of 2022.
5. What are some drivers contributing to market growth?
N/A
6. What are the notable trends driving market growth?
Declining Quality of Auditing from the Big 4.
7. Are there any restraints impacting market growth?
N/A
8. Can you provide examples of recent developments in the market?
In May 2023, Deloitte and Google Cloud have recently bolstered their decade-long alliance, with a specific focus on deploying Google Cloud's cutting-edge Generative AI capabilities across various industries.
9. What pricing options are available for accessing the report?
Pricing options include single-user, multi-user, and enterprise licenses priced at USD 3800, USD 4500, and USD 5800 respectively.
10. Is the market size provided in terms of value or volume?
The market size is provided in terms of value, measured in Million and volume, measured in Billion.
11. Are there any specific market keywords associated with the report?
Yes, the market keyword associated with the report is "US Audit Industry," which aids in identifying and referencing the specific market segment covered.
12. How do I determine which pricing option suits my needs best?
The pricing options vary based on user requirements and access needs. Individual users may opt for single-user licenses, while businesses requiring broader access may choose multi-user or enterprise licenses for cost-effective access to the report.
13. Are there any additional resources or data provided in the US Audit Industry report?
While the report offers comprehensive insights, it's advisable to review the specific contents or supplementary materials provided to ascertain if additional resources or data are available.
14. How can I stay updated on further developments or reports in the US Audit Industry?
To stay informed about further developments, trends, and reports in the US Audit Industry, consider subscribing to industry newsletters, following relevant companies and organizations, or regularly checking reputable industry news sources and publications.
Methodology
Step 1 - Identification of Relevant Samples Size from Population Database


Step 2 - Approaches for Defining Global Market Size (Value, Volume* & Price*)

Note*: In applicable scenarios
Step 3 - Data Sources
Primary Research
- Web Analytics
- Survey Reports
- Research Institute
- Latest Research Reports
- Opinion Leaders
Secondary Research
- Annual Reports
- White Paper
- Latest Press Release
- Industry Association
- Paid Database
- Investor Presentations

Step 4 - Data Triangulation
Involves using different sources of information in order to increase the validity of a study
These sources are likely to be stakeholders in a program - participants, other researchers, program staff, other community members, and so on.
Then we put all data in single framework & apply various statistical tools to find out the dynamic on the market.
During the analysis stage, feedback from the stakeholder groups would be compared to determine areas of agreement as well as areas of divergence