

Key Insights
The global market for Ultra-narrow LCD Splicing Display Units is poised for significant expansion, with a projected market size of USD 2641 million and an estimated Compound Annual Growth Rate (CAGR) of 5.5%. This robust growth is fueled by an increasing demand for immersive and high-impact visual experiences across various sectors. The primary drivers for this market surge include the escalating adoption of large-scale video walls in commercial applications such as retail advertising, corporate lobbies, command and control centers, and entertainment venues. These displays offer unparalleled visual clarity, seamless integration, and the ability to present dynamic content, making them a preferred choice for businesses seeking to enhance brand visibility and customer engagement. Furthermore, the continuous technological advancements in LCD panel technology, particularly in reducing bezel width and improving picture quality, are instrumental in driving market penetration. The trend towards more sophisticated digital signage solutions and the growing preference for modular and scalable display systems will further propel the market forward.
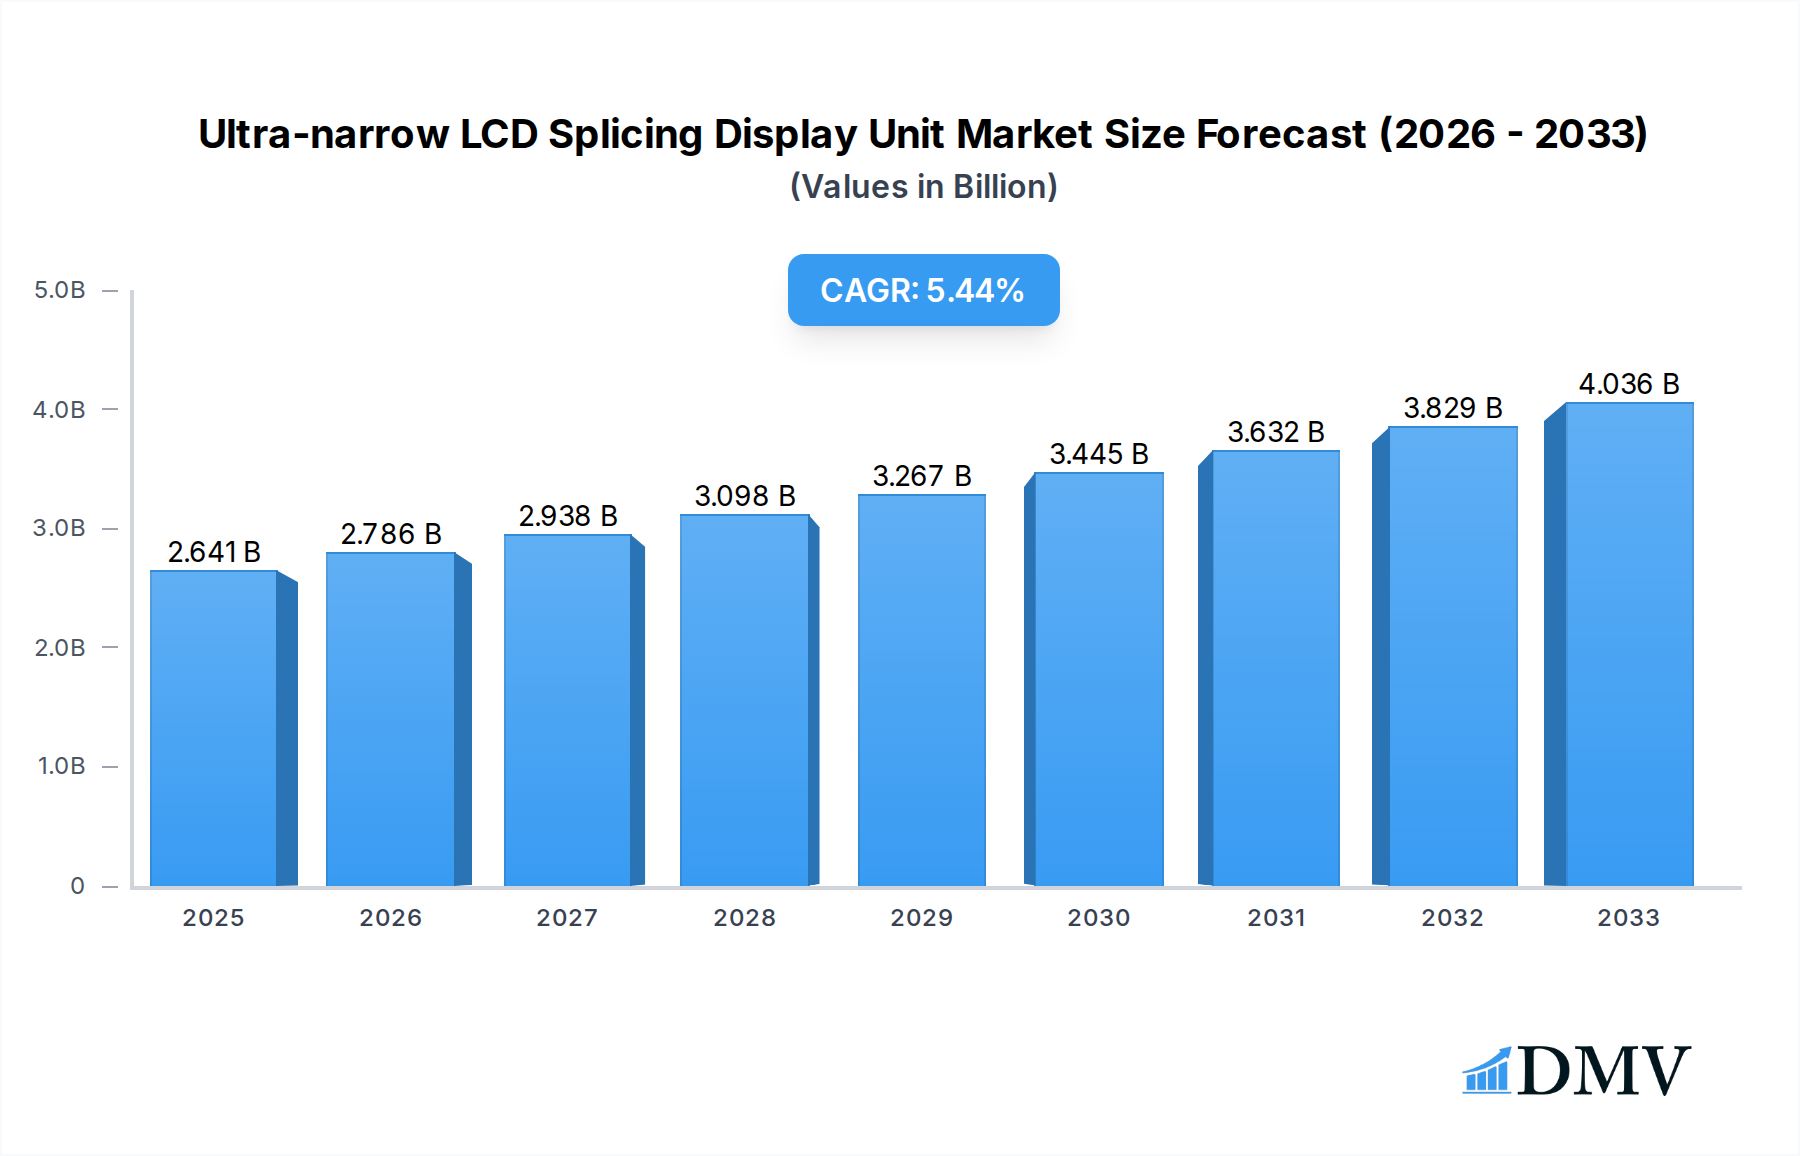
Ultra-narrow LCD Splicing Display Unit Market Size (In Billion)
The market segmentation reveals a strong inclination towards applications in both Commercial Display and Home Display, indicating a dual-pronged demand. Within the "Types" segment, both Screen Gap: 1-1.5 Mm and Screen Gap: Less Than 1 Mm are expected to witness healthy growth, reflecting the industry's pursuit of increasingly seamless visual integration. While the market is propelled by innovation and demand, it also faces certain restraints, such as the initial high cost of implementation for large-scale deployments and the ongoing competition from alternative display technologies like LED and OLED. However, the superior cost-effectiveness of LCD splicing units for certain applications, coupled with their established reliability and durability, continues to secure their market position. Key players like Samsung, BOE, Innolux, TCL, and LG are at the forefront of this market, investing heavily in research and development to deliver advanced solutions and capture a larger market share. Regional analysis indicates a strong presence and growth potential in Asia Pacific, driven by rapid urbanization and technological adoption, followed by North America and Europe.

Ultra-narrow LCD Splicing Display Unit Company Market Share
Ultra-narrow LCD Splicing Display Unit Market Composition & Trends
This comprehensive report delves into the intricate market dynamics of ultra-narrow LCD splicing display units, a rapidly evolving segment within the visual display industry. The market exhibits a moderate concentration, with key players like Samsung, BOE, Innolux, TCL, LG, Leyard Optoelectronic, Sichuan Changhong, Vtron Group, Uniview, Zhejiang Dahua, Tiandy, Shenzhen Yesing, SALI, and Qunmao actively shaping its trajectory. Innovation catalysts, including advancements in panel technology and reduced bezel sizes, are driving significant product development. The regulatory landscape, while generally supportive of technological integration, may present nuances across different geographical markets. Substitute products, such as microLED and OLED splicing displays, pose a competitive challenge, though ultra-narrow LCD splicing units maintain a strong foothold due to their cost-effectiveness and established performance. End-user profiles are diverse, spanning commercial display applications like retail, corporate signage, and command centers, as well as emerging home display solutions. Mergers and acquisition (M&A) activities, with estimated deal values reaching hundreds of millions, indicate a strategic consolidation phase aimed at expanding market reach and technological portfolios.
- Market Concentration: Moderate, with significant contributions from established display manufacturers.
- Innovation Catalysts: Reduced bezel technology, enhanced image processing, and increased brightness levels.
- Regulatory Landscape: Generally favorable, with a focus on energy efficiency and display quality standards.
- Substitute Products: MicroLED, OLED splicing displays.
- End-User Segments: Commercial Displays (Retail, Corporate, Broadcast), Home Entertainment.
- M&A Activity: Indicative of strategic partnerships and market consolidation, with deal values in the millions.
Ultra-narrow LCD Splicing Display Unit Industry Evolution
The ultra-narrow LCD splicing display unit industry has witnessed remarkable evolution and sustained growth throughout the historical period of 2019–2024, with projections indicating continued upward momentum through 2033. The market's growth trajectory has been significantly influenced by a confluence of technological advancements and evolving consumer and commercial demands. During the historical period, market expansion was driven by the increasing adoption of large-scale video walls in retail environments for dynamic advertising, in corporate settings for enhanced collaboration and presentations, and in control rooms for critical monitoring. The demand for seamless visual experiences, where the individual display units blend into a single, immersive canvas, has been a primary impetus for the development and adoption of ultra-narrow bezel technologies.
Technological advancements have been at the forefront of this evolution. The continuous reduction in screen gap, from 1-1.5 mm in earlier iterations to less than 1 mm in current premium offerings, has dramatically improved the perceived image continuity and reduced the distraction of bezels. Innovations in LED backlighting technology have led to higher brightness levels, superior contrast ratios, and improved color accuracy, making these displays suitable for a wider range of ambient lighting conditions. Furthermore, advancements in signal processing and content management systems have enabled the seamless integration of multiple displays, supporting high-resolution content and complex video wall configurations. The base year of 2025 marks a pivotal point, with the market well-positioned for continued expansion. The estimated year of 2025 reflects the current state of robust demand, driven by ongoing digital transformation initiatives across industries.
Shifting consumer demands, particularly in the commercial sector, have also played a crucial role. Businesses are increasingly recognizing the power of visual communication and are investing in high-impact display solutions to engage their audiences. This has translated into a higher uptake of ultra-narrow LCD splicing displays for applications such as interactive retail displays, digital out-of-home (DOOH) advertising, and immersive simulation environments. The forecast period of 2025–2033 anticipates sustained market growth, fueled by the continued technological refinement of these displays and the expansion of their application into new verticals. Emerging markets, particularly in developing economies, are expected to contribute significantly to this growth as infrastructure improves and adoption rates rise. The industry's ability to deliver cost-effective, scalable, and high-performance visual solutions will remain a key determinant of its long-term success. The study period of 2019–2033 encapsulates this dynamic evolution, highlighting the industry's resilience and its capacity to adapt to technological shifts and market needs.
Leading Regions, Countries, or Segments in Ultra-narrow LCD Splicing Display Unit
The ultra-narrow LCD splicing display unit market exhibits distinct regional and segment leadership, with Asia Pacific emerging as a dominant force due to a confluence of manufacturing prowess, robust market demand, and supportive government policies. Within the Application segment, Commercial Display overwhelmingly leads, driven by significant investments in digital signage, retail modernization, and corporate infrastructure upgrades across key Asian economies. The region's extensive manufacturing base, comprising major players like BOE, Innolux, TCL, and Sichuan Changhong, provides a competitive advantage in terms of production capacity and cost efficiency, contributing to a substantial market share.
Key drivers for Asia Pacific's dominance include:
- Manufacturing Hub: Presence of leading panel manufacturers and assembly facilities, enabling economies of scale and competitive pricing.
- Rapid Urbanization & Retail Growth: Increasing demand for engaging in-store advertising and digital signage in rapidly growing urban centers.
- Government Initiatives: Support for digitalization and smart city projects, which often incorporate large-scale display solutions.
- Technological Adoption: High receptiveness to new technologies, including advanced display solutions, for both commercial and public infrastructure.
In terms of Types, the market is witnessing a significant shift towards Ultra-narrow LCD Splicing Display Units with a Screen Gap: Less Than 1 Mm. This segment is experiencing faster growth and greater adoption due to the enhanced visual experience it offers, minimizing the perceptible seams between individual panels. While Screen Gap: 1-1.5 Mm units still hold a considerable market share, particularly in cost-sensitive applications, the demand for a truly seamless display is increasingly favoring the <1mm category. This trend is propelled by advancements in manufacturing precision and pixel density, allowing for finer bezel construction without compromising image quality or durability. The increasing sophistication of visual content, demanding higher fidelity and immersion, further fuels the demand for these near-seamless displays.
The dominance of Commercial Display applications within this segment is a testament to the transformative impact of ultra-narrow LCD splicing units on business operations and customer engagement. From creating captivating retail window displays and interactive information kiosks to powering sophisticated command and control centers and immersive corporate meeting rooms, these displays provide unparalleled visual impact and information dissemination capabilities. The ability to scale these displays to virtually any size and configuration makes them highly adaptable to diverse commercial needs. For instance, large retail chains are deploying extensive video walls for brand storytelling and product showcases, while financial institutions and transportation hubs utilize them for real-time data visualization and public information. The forecast period of 2025–2033 is expected to see this dominance intensify as businesses across all sectors continue to embrace digital transformation and recognize the ROI of high-impact visual communication solutions. The synergy between advanced manufacturing in Asia Pacific and the escalating demand for seamless commercial displays positions this region and this specific product type for sustained market leadership.
Ultra-narrow LCD Splicing Display Unit Product Innovations
Product innovation in ultra-narrow LCD splicing display units is characterized by a relentless pursuit of seamless visual experiences and enhanced performance. Key advancements include the development of panels with screen gaps of less than 1 mm, virtually eliminating visible bezels for a truly immersive display. Innovations in LED backlight technology have led to higher brightness levels, reaching hundreds of nits, and superior color accuracy, ensuring vibrant and lifelike visuals. Furthermore, advanced image processing algorithms are being integrated to optimize content across multiple screens, delivering a unified and coherent viewing experience. These product innovations are crucial for applications requiring high fidelity, such as digital out-of-home advertising and sophisticated command center operations, driving adoption and market expansion.
Propelling Factors for Ultra-narrow LCD Splicing Display Unit Growth
Several key factors are propelling the growth of the ultra-narrow LCD splicing display unit market. Technological advancements, particularly the reduction of screen gaps to less than 1 mm and improvements in LED backlighting, are creating more visually appealing and integrated solutions. The increasing demand for immersive visual experiences in commercial applications, such as retail, advertising, and corporate environments, is a significant driver. Economic growth, leading to increased disposable income and business investment in display technologies, further fuels adoption. Regulatory support for digital signage and public information systems in various regions also contributes positively. Moreover, the cost-effectiveness and scalability of LCD splicing technology compared to some alternatives make it an attractive choice for a broad range of applications.
- Technological Advancements: Ultra-narrow bezels (<1mm), enhanced LED backlighting, improved color reproduction.
- Commercial Application Demand: Growing need for impactful digital signage, retail advertising, and corporate communication.
- Economic Growth & Investment: Increased business spending on visual merchandising and information dissemination.
- Regulatory Support: Favorable policies for digital infrastructure and public display systems.
- Cost-Effectiveness & Scalability: Competitive pricing and flexible deployment options for large video walls.
Obstacles in the Ultra-narrow LCD Splicing Display Unit Market
Despite robust growth, the ultra-narrow LCD splicing display unit market faces several obstacles. Intense competition, particularly from emerging technologies like MicroLED and OLED splicing, can exert downward pressure on pricing and market share. Supply chain disruptions, as experienced globally in recent years, can lead to material shortages and increased manufacturing costs, impacting production timelines and profitability. While regulatory landscapes are generally supportive, variations in standards and certification requirements across different regions can create market entry challenges. Furthermore, the initial investment cost for high-resolution, ultra-narrow splicing displays can be a barrier for smaller businesses or price-sensitive markets, limiting adoption despite long-term benefits.
- Competitive Landscape: Emergence of alternative technologies like MicroLED and OLED.
- Supply Chain Vulnerabilities: Risk of material shortages and price volatility.
- Regional Regulatory Variations: Divergent standards and certification processes.
- Initial Investment Cost: High upfront expenditure for advanced units.
Future Opportunities in Ultra-narrow LCD Splicing Display Unit
The future of the ultra-narrow LCD splicing display unit market is rife with opportunities. The expansion into new application verticals, such as smart city infrastructure, digital art installations, and immersive entertainment venues, presents significant growth potential. Continued technological innovation, focusing on even thinner bezels, higher refresh rates, and integrated smart functionalities, will create next-generation products. The growing demand for personalized and interactive visual experiences in retail and hospitality sectors opens avenues for tailored display solutions. Furthermore, the increasing adoption of these displays in emerging economies, as digital transformation initiatives gain momentum, will drive market penetration and revenue growth.
- New Market Verticals: Smart cities, immersive entertainment, digital art.
- Technological Advancements: Further bezel reduction, enhanced interactivity, AI integration.
- Personalized Experiences: Tailored solutions for retail and hospitality.
- Emerging Economies: Expansion into developing markets with increasing digitalization.
Major Players in the Ultra-narrow LCD Splicing Display Unit Ecosystem
- Samsung
- BOE
- Innolux
- TCL
- LG
- Leyard Optoelectronic
- Sichuan Changhong
- Vtron Group
- Uniview
- Zhejiang Dahua
- Tiandy
- Shenzhen Yesing
- SALI
- Qunmao
Key Developments in Ultra-narrow LCD Splicing Display Unit Industry
- 2019: Introduction of displays with sub-millimeter bezels, significantly enhancing visual continuity.
- 2020: Increased adoption of AI-powered image processing for optimized content across video walls.
- 2021: Supply chain challenges impact production of key components, leading to price fluctuations.
- 2022: Launch of higher brightness and color-accurate panels, catering to demanding outdoor and broadcast applications.
- 2023: Focus on energy efficiency and sustainable manufacturing practices gains momentum.
- 2024: Strategic partnerships and M&A activities intensify as companies aim to consolidate market positions and technological expertise.
Strategic Ultra-narrow LCD Splicing Display Unit Market Forecast
The strategic forecast for the ultra-narrow LCD splicing display unit market is exceptionally positive, driven by sustained innovation and expanding application landscapes. The continued reduction in screen gaps, pushing towards truly seamless displays, will remain a primary growth catalyst. The increasing integration of smart technologies, such as IoT connectivity and AI-driven content management, will unlock new functionalities and enhance user experiences, further stimulating demand. As global economies recover and digital transformation initiatives accelerate, the adoption of these sophisticated visual solutions in commercial, public, and potentially even high-end residential sectors is projected to surge. The market is poised for robust growth, with key players strategically investing in R&D and market penetration to capitalize on these emerging opportunities through 2033.
Ultra-narrow LCD Splicing Display Unit Segmentation
-
1. Application
- 1.1. Commercial Display
- 1.2. Home Display
-
2. Types
- 2.1. Screen Gap: 1-1.5 Mm
- 2.2. Screen Gap: Less Than 1 Mm
Ultra-narrow LCD Splicing Display Unit Segmentation By Geography
-
1. North America
- 1.1. United States
- 1.2. Canada
- 1.3. Mexico
-
2. South America
- 2.1. Brazil
- 2.2. Argentina
- 2.3. Rest of South America
-
3. Europe
- 3.1. United Kingdom
- 3.2. Germany
- 3.3. France
- 3.4. Italy
- 3.5. Spain
- 3.6. Russia
- 3.7. Benelux
- 3.8. Nordics
- 3.9. Rest of Europe
-
4. Middle East & Africa
- 4.1. Turkey
- 4.2. Israel
- 4.3. GCC
- 4.4. North Africa
- 4.5. South Africa
- 4.6. Rest of Middle East & Africa
-
5. Asia Pacific
- 5.1. China
- 5.2. India
- 5.3. Japan
- 5.4. South Korea
- 5.5. ASEAN
- 5.6. Oceania
- 5.7. Rest of Asia Pacific
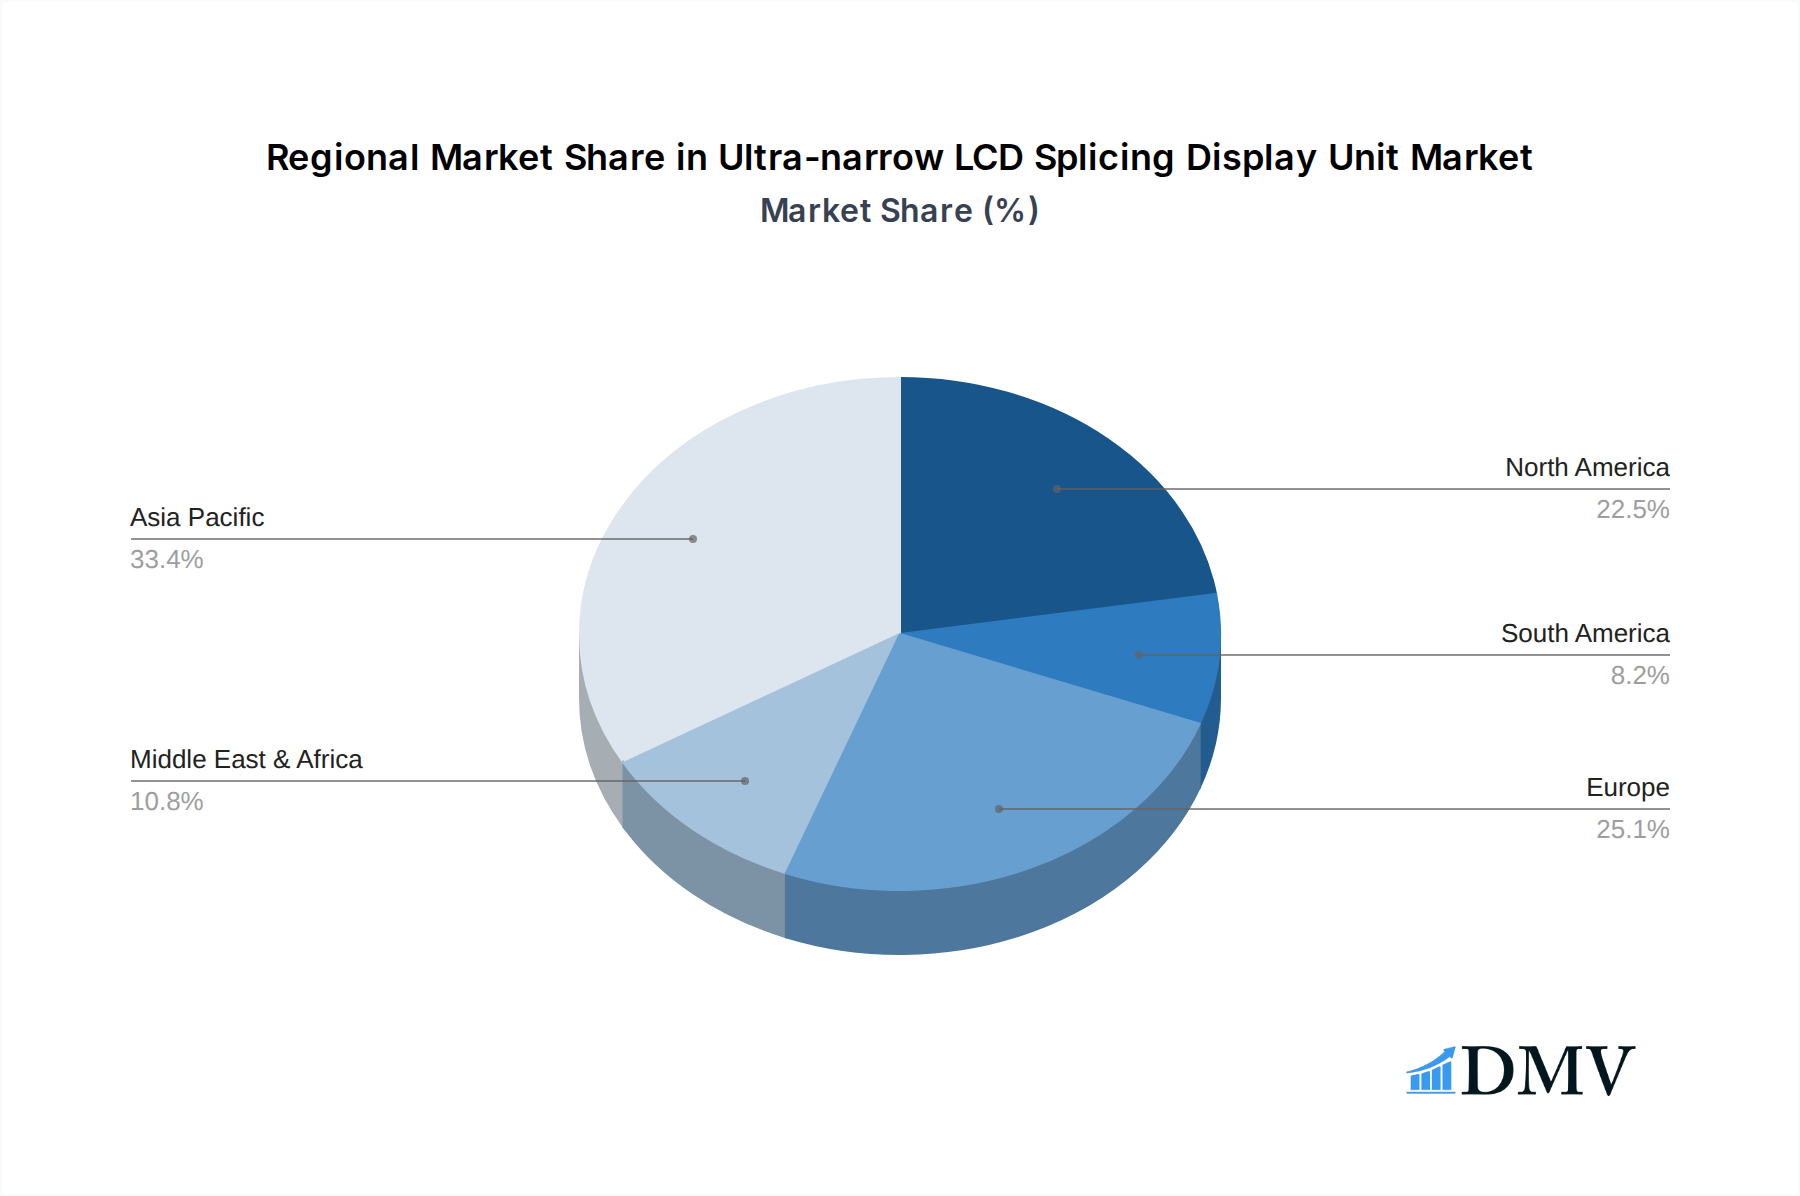
Ultra-narrow LCD Splicing Display Unit Regional Market Share
Geographic Coverage of Ultra-narrow LCD Splicing Display Unit
Ultra-narrow LCD Splicing Display Unit REPORT HIGHLIGHTS
| Aspects | Details |
|---|---|
| Study Period | 2020-2034 |
| Base Year | 2025 |
| Estimated Year | 2026 |
| Forecast Period | 2026-2034 |
| Historical Period | 2020-2025 |
| Growth Rate | CAGR of 5.5% from 2020-2034 |
| Segmentation |
|
Table of Contents
- 1. Introduction
- 1.1. Research Scope
- 1.2. Market Segmentation
- 1.3. Research Objective
- 1.4. Definitions and Assumptions
- 2. Executive Summary
- 2.1. Market Snapshot
- 3. Market Dynamics
- 3.1. Market Drivers
- 3.2. Market Restrains
- 3.3. Market Trends
- 3.4. Market Opportunities
- 4. Market Factor Analysis
- 4.1. Porters Five Forces
- 4.1.1. Bargaining Power of Suppliers
- 4.1.2. Bargaining Power of Buyers
- 4.1.3. Threat of New Entrants
- 4.1.4. Threat of Substitutes
- 4.1.5. Competitive Rivalry
- 4.2. PESTEL analysis
- 4.3. BCG Analysis
- 4.3.1. Stars (High Growth, High Market Share)
- 4.3.2. Cash Cows (Low Growth, High Market Share)
- 4.3.3. Question Mark (High Growth, Low Market Share)
- 4.3.4. Dogs (Low Growth, Low Market Share)
- 4.4. Ansoff Matrix Analysis
- 4.5. Supply Chain Analysis
- 4.6. Regulatory Landscape
- 4.7. Current Market Potential and Opportunity Assessment (TAM–SAM–SOM Framework)
- 4.8. DMV Analyst Note
- 4.1. Porters Five Forces
- 5. Market Analysis, Insights and Forecast 2021-2033
- 5.1. Market Analysis, Insights and Forecast - by Application
- 5.1.1. Commercial Display
- 5.1.2. Home Display
- 5.2. Market Analysis, Insights and Forecast - by Types
- 5.2.1. Screen Gap: 1-1.5 Mm
- 5.2.2. Screen Gap: Less Than 1 Mm
- 5.3. Market Analysis, Insights and Forecast - by Region
- 5.3.1. North America
- 5.3.2. South America
- 5.3.3. Europe
- 5.3.4. Middle East & Africa
- 5.3.5. Asia Pacific
- 5.1. Market Analysis, Insights and Forecast - by Application
- 6. Global Ultra-narrow LCD Splicing Display Unit Analysis, Insights and Forecast, 2021-2033
- 6.1. Market Analysis, Insights and Forecast - by Application
- 6.1.1. Commercial Display
- 6.1.2. Home Display
- 6.2. Market Analysis, Insights and Forecast - by Types
- 6.2.1. Screen Gap: 1-1.5 Mm
- 6.2.2. Screen Gap: Less Than 1 Mm
- 6.1. Market Analysis, Insights and Forecast - by Application
- 7. North America Ultra-narrow LCD Splicing Display Unit Analysis, Insights and Forecast, 2020-2032
- 7.1. Market Analysis, Insights and Forecast - by Application
- 7.1.1. Commercial Display
- 7.1.2. Home Display
- 7.2. Market Analysis, Insights and Forecast - by Types
- 7.2.1. Screen Gap: 1-1.5 Mm
- 7.2.2. Screen Gap: Less Than 1 Mm
- 7.1. Market Analysis, Insights and Forecast - by Application
- 8. South America Ultra-narrow LCD Splicing Display Unit Analysis, Insights and Forecast, 2020-2032
- 8.1. Market Analysis, Insights and Forecast - by Application
- 8.1.1. Commercial Display
- 8.1.2. Home Display
- 8.2. Market Analysis, Insights and Forecast - by Types
- 8.2.1. Screen Gap: 1-1.5 Mm
- 8.2.2. Screen Gap: Less Than 1 Mm
- 8.1. Market Analysis, Insights and Forecast - by Application
- 9. Europe Ultra-narrow LCD Splicing Display Unit Analysis, Insights and Forecast, 2020-2032
- 9.1. Market Analysis, Insights and Forecast - by Application
- 9.1.1. Commercial Display
- 9.1.2. Home Display
- 9.2. Market Analysis, Insights and Forecast - by Types
- 9.2.1. Screen Gap: 1-1.5 Mm
- 9.2.2. Screen Gap: Less Than 1 Mm
- 9.1. Market Analysis, Insights and Forecast - by Application
- 10. Middle East & Africa Ultra-narrow LCD Splicing Display Unit Analysis, Insights and Forecast, 2020-2032
- 10.1. Market Analysis, Insights and Forecast - by Application
- 10.1.1. Commercial Display
- 10.1.2. Home Display
- 10.2. Market Analysis, Insights and Forecast - by Types
- 10.2.1. Screen Gap: 1-1.5 Mm
- 10.2.2. Screen Gap: Less Than 1 Mm
- 10.1. Market Analysis, Insights and Forecast - by Application
- 11. Asia Pacific Ultra-narrow LCD Splicing Display Unit Analysis, Insights and Forecast, 2020-2032
- 11.1. Market Analysis, Insights and Forecast - by Application
- 11.1.1. Commercial Display
- 11.1.2. Home Display
- 11.2. Market Analysis, Insights and Forecast - by Types
- 11.2.1. Screen Gap: 1-1.5 Mm
- 11.2.2. Screen Gap: Less Than 1 Mm
- 11.1. Market Analysis, Insights and Forecast - by Application
- 12. Competitive Analysis
- 12.1. Company Profiles
- 12.1.1 Samsung
- 12.1.1.1. Company Overview
- 12.1.1.2. Products
- 12.1.1.3. Company Financials
- 12.1.1.4. SWOT Analysis
- 12.1.2 BOE
- 12.1.2.1. Company Overview
- 12.1.2.2. Products
- 12.1.2.3. Company Financials
- 12.1.2.4. SWOT Analysis
- 12.1.3 Innolux
- 12.1.3.1. Company Overview
- 12.1.3.2. Products
- 12.1.3.3. Company Financials
- 12.1.3.4. SWOT Analysis
- 12.1.4 TCL
- 12.1.4.1. Company Overview
- 12.1.4.2. Products
- 12.1.4.3. Company Financials
- 12.1.4.4. SWOT Analysis
- 12.1.5 LG
- 12.1.5.1. Company Overview
- 12.1.5.2. Products
- 12.1.5.3. Company Financials
- 12.1.5.4. SWOT Analysis
- 12.1.6 Leyard Optoelectronic
- 12.1.6.1. Company Overview
- 12.1.6.2. Products
- 12.1.6.3. Company Financials
- 12.1.6.4. SWOT Analysis
- 12.1.7 Sichuan Changhong
- 12.1.7.1. Company Overview
- 12.1.7.2. Products
- 12.1.7.3. Company Financials
- 12.1.7.4. SWOT Analysis
- 12.1.8 Vtron Group
- 12.1.8.1. Company Overview
- 12.1.8.2. Products
- 12.1.8.3. Company Financials
- 12.1.8.4. SWOT Analysis
- 12.1.9 Uniview
- 12.1.9.1. Company Overview
- 12.1.9.2. Products
- 12.1.9.3. Company Financials
- 12.1.9.4. SWOT Analysis
- 12.1.10 Zhejiang Dahua
- 12.1.10.1. Company Overview
- 12.1.10.2. Products
- 12.1.10.3. Company Financials
- 12.1.10.4. SWOT Analysis
- 12.1.11 Tiandy
- 12.1.11.1. Company Overview
- 12.1.11.2. Products
- 12.1.11.3. Company Financials
- 12.1.11.4. SWOT Analysis
- 12.1.12 Shenzhen Yesing
- 12.1.12.1. Company Overview
- 12.1.12.2. Products
- 12.1.12.3. Company Financials
- 12.1.12.4. SWOT Analysis
- 12.1.13 SALI
- 12.1.13.1. Company Overview
- 12.1.13.2. Products
- 12.1.13.3. Company Financials
- 12.1.13.4. SWOT Analysis
- 12.1.14 Qunmao
- 12.1.14.1. Company Overview
- 12.1.14.2. Products
- 12.1.14.3. Company Financials
- 12.1.14.4. SWOT Analysis
- 12.1.1 Samsung
- 12.2. Market Entropy
- 12.2.1 Company's Key Areas Served
- 12.2.2 Recent Developments
- 12.3. Company Market Share Analysis 2025
- 12.3.1 Top 5 Companies Market Share Analysis
- 12.3.2 Top 3 Companies Market Share Analysis
- 12.4. List of Potential Customers
- 13. Research Methodology
List of Figures
- Figure 1: Global Ultra-narrow LCD Splicing Display Unit Revenue Breakdown (million, %) by Region 2025 & 2033
- Figure 2: North America Ultra-narrow LCD Splicing Display Unit Revenue (million), by Application 2025 & 2033
- Figure 3: North America Ultra-narrow LCD Splicing Display Unit Revenue Share (%), by Application 2025 & 2033
- Figure 4: North America Ultra-narrow LCD Splicing Display Unit Revenue (million), by Types 2025 & 2033
- Figure 5: North America Ultra-narrow LCD Splicing Display Unit Revenue Share (%), by Types 2025 & 2033
- Figure 6: North America Ultra-narrow LCD Splicing Display Unit Revenue (million), by Country 2025 & 2033
- Figure 7: North America Ultra-narrow LCD Splicing Display Unit Revenue Share (%), by Country 2025 & 2033
- Figure 8: South America Ultra-narrow LCD Splicing Display Unit Revenue (million), by Application 2025 & 2033
- Figure 9: South America Ultra-narrow LCD Splicing Display Unit Revenue Share (%), by Application 2025 & 2033
- Figure 10: South America Ultra-narrow LCD Splicing Display Unit Revenue (million), by Types 2025 & 2033
- Figure 11: South America Ultra-narrow LCD Splicing Display Unit Revenue Share (%), by Types 2025 & 2033
- Figure 12: South America Ultra-narrow LCD Splicing Display Unit Revenue (million), by Country 2025 & 2033
- Figure 13: South America Ultra-narrow LCD Splicing Display Unit Revenue Share (%), by Country 2025 & 2033
- Figure 14: Europe Ultra-narrow LCD Splicing Display Unit Revenue (million), by Application 2025 & 2033
- Figure 15: Europe Ultra-narrow LCD Splicing Display Unit Revenue Share (%), by Application 2025 & 2033
- Figure 16: Europe Ultra-narrow LCD Splicing Display Unit Revenue (million), by Types 2025 & 2033
- Figure 17: Europe Ultra-narrow LCD Splicing Display Unit Revenue Share (%), by Types 2025 & 2033
- Figure 18: Europe Ultra-narrow LCD Splicing Display Unit Revenue (million), by Country 2025 & 2033
- Figure 19: Europe Ultra-narrow LCD Splicing Display Unit Revenue Share (%), by Country 2025 & 2033
- Figure 20: Middle East & Africa Ultra-narrow LCD Splicing Display Unit Revenue (million), by Application 2025 & 2033
- Figure 21: Middle East & Africa Ultra-narrow LCD Splicing Display Unit Revenue Share (%), by Application 2025 & 2033
- Figure 22: Middle East & Africa Ultra-narrow LCD Splicing Display Unit Revenue (million), by Types 2025 & 2033
- Figure 23: Middle East & Africa Ultra-narrow LCD Splicing Display Unit Revenue Share (%), by Types 2025 & 2033
- Figure 24: Middle East & Africa Ultra-narrow LCD Splicing Display Unit Revenue (million), by Country 2025 & 2033
- Figure 25: Middle East & Africa Ultra-narrow LCD Splicing Display Unit Revenue Share (%), by Country 2025 & 2033
- Figure 26: Asia Pacific Ultra-narrow LCD Splicing Display Unit Revenue (million), by Application 2025 & 2033
- Figure 27: Asia Pacific Ultra-narrow LCD Splicing Display Unit Revenue Share (%), by Application 2025 & 2033
- Figure 28: Asia Pacific Ultra-narrow LCD Splicing Display Unit Revenue (million), by Types 2025 & 2033
- Figure 29: Asia Pacific Ultra-narrow LCD Splicing Display Unit Revenue Share (%), by Types 2025 & 2033
- Figure 30: Asia Pacific Ultra-narrow LCD Splicing Display Unit Revenue (million), by Country 2025 & 2033
- Figure 31: Asia Pacific Ultra-narrow LCD Splicing Display Unit Revenue Share (%), by Country 2025 & 2033
List of Tables
- Table 1: Global Ultra-narrow LCD Splicing Display Unit Revenue million Forecast, by Application 2020 & 2033
- Table 2: Global Ultra-narrow LCD Splicing Display Unit Revenue million Forecast, by Types 2020 & 2033
- Table 3: Global Ultra-narrow LCD Splicing Display Unit Revenue million Forecast, by Region 2020 & 2033
- Table 4: Global Ultra-narrow LCD Splicing Display Unit Revenue million Forecast, by Application 2020 & 2033
- Table 5: Global Ultra-narrow LCD Splicing Display Unit Revenue million Forecast, by Types 2020 & 2033
- Table 6: Global Ultra-narrow LCD Splicing Display Unit Revenue million Forecast, by Country 2020 & 2033
- Table 7: United States Ultra-narrow LCD Splicing Display Unit Revenue (million) Forecast, by Application 2020 & 2033
- Table 8: Canada Ultra-narrow LCD Splicing Display Unit Revenue (million) Forecast, by Application 2020 & 2033
- Table 9: Mexico Ultra-narrow LCD Splicing Display Unit Revenue (million) Forecast, by Application 2020 & 2033
- Table 10: Global Ultra-narrow LCD Splicing Display Unit Revenue million Forecast, by Application 2020 & 2033
- Table 11: Global Ultra-narrow LCD Splicing Display Unit Revenue million Forecast, by Types 2020 & 2033
- Table 12: Global Ultra-narrow LCD Splicing Display Unit Revenue million Forecast, by Country 2020 & 2033
- Table 13: Brazil Ultra-narrow LCD Splicing Display Unit Revenue (million) Forecast, by Application 2020 & 2033
- Table 14: Argentina Ultra-narrow LCD Splicing Display Unit Revenue (million) Forecast, by Application 2020 & 2033
- Table 15: Rest of South America Ultra-narrow LCD Splicing Display Unit Revenue (million) Forecast, by Application 2020 & 2033
- Table 16: Global Ultra-narrow LCD Splicing Display Unit Revenue million Forecast, by Application 2020 & 2033
- Table 17: Global Ultra-narrow LCD Splicing Display Unit Revenue million Forecast, by Types 2020 & 2033
- Table 18: Global Ultra-narrow LCD Splicing Display Unit Revenue million Forecast, by Country 2020 & 2033
- Table 19: United Kingdom Ultra-narrow LCD Splicing Display Unit Revenue (million) Forecast, by Application 2020 & 2033
- Table 20: Germany Ultra-narrow LCD Splicing Display Unit Revenue (million) Forecast, by Application 2020 & 2033
- Table 21: France Ultra-narrow LCD Splicing Display Unit Revenue (million) Forecast, by Application 2020 & 2033
- Table 22: Italy Ultra-narrow LCD Splicing Display Unit Revenue (million) Forecast, by Application 2020 & 2033
- Table 23: Spain Ultra-narrow LCD Splicing Display Unit Revenue (million) Forecast, by Application 2020 & 2033
- Table 24: Russia Ultra-narrow LCD Splicing Display Unit Revenue (million) Forecast, by Application 2020 & 2033
- Table 25: Benelux Ultra-narrow LCD Splicing Display Unit Revenue (million) Forecast, by Application 2020 & 2033
- Table 26: Nordics Ultra-narrow LCD Splicing Display Unit Revenue (million) Forecast, by Application 2020 & 2033
- Table 27: Rest of Europe Ultra-narrow LCD Splicing Display Unit Revenue (million) Forecast, by Application 2020 & 2033
- Table 28: Global Ultra-narrow LCD Splicing Display Unit Revenue million Forecast, by Application 2020 & 2033
- Table 29: Global Ultra-narrow LCD Splicing Display Unit Revenue million Forecast, by Types 2020 & 2033
- Table 30: Global Ultra-narrow LCD Splicing Display Unit Revenue million Forecast, by Country 2020 & 2033
- Table 31: Turkey Ultra-narrow LCD Splicing Display Unit Revenue (million) Forecast, by Application 2020 & 2033
- Table 32: Israel Ultra-narrow LCD Splicing Display Unit Revenue (million) Forecast, by Application 2020 & 2033
- Table 33: GCC Ultra-narrow LCD Splicing Display Unit Revenue (million) Forecast, by Application 2020 & 2033
- Table 34: North Africa Ultra-narrow LCD Splicing Display Unit Revenue (million) Forecast, by Application 2020 & 2033
- Table 35: South Africa Ultra-narrow LCD Splicing Display Unit Revenue (million) Forecast, by Application 2020 & 2033
- Table 36: Rest of Middle East & Africa Ultra-narrow LCD Splicing Display Unit Revenue (million) Forecast, by Application 2020 & 2033
- Table 37: Global Ultra-narrow LCD Splicing Display Unit Revenue million Forecast, by Application 2020 & 2033
- Table 38: Global Ultra-narrow LCD Splicing Display Unit Revenue million Forecast, by Types 2020 & 2033
- Table 39: Global Ultra-narrow LCD Splicing Display Unit Revenue million Forecast, by Country 2020 & 2033
- Table 40: China Ultra-narrow LCD Splicing Display Unit Revenue (million) Forecast, by Application 2020 & 2033
- Table 41: India Ultra-narrow LCD Splicing Display Unit Revenue (million) Forecast, by Application 2020 & 2033
- Table 42: Japan Ultra-narrow LCD Splicing Display Unit Revenue (million) Forecast, by Application 2020 & 2033
- Table 43: South Korea Ultra-narrow LCD Splicing Display Unit Revenue (million) Forecast, by Application 2020 & 2033
- Table 44: ASEAN Ultra-narrow LCD Splicing Display Unit Revenue (million) Forecast, by Application 2020 & 2033
- Table 45: Oceania Ultra-narrow LCD Splicing Display Unit Revenue (million) Forecast, by Application 2020 & 2033
- Table 46: Rest of Asia Pacific Ultra-narrow LCD Splicing Display Unit Revenue (million) Forecast, by Application 2020 & 2033
Frequently Asked Questions
1. What is the projected Compound Annual Growth Rate (CAGR) of the Ultra-narrow LCD Splicing Display Unit?
The projected CAGR is approximately 5.5%.
2. Which companies are prominent players in the Ultra-narrow LCD Splicing Display Unit?
Key companies in the market include Samsung, BOE, Innolux, TCL, LG, Leyard Optoelectronic, Sichuan Changhong, Vtron Group, Uniview, Zhejiang Dahua, Tiandy, Shenzhen Yesing, SALI, Qunmao.
3. What are the main segments of the Ultra-narrow LCD Splicing Display Unit?
The market segments include Application, Types.
4. Can you provide details about the market size?
The market size is estimated to be USD 2641 million as of 2022.
5. What are some drivers contributing to market growth?
N/A
6. What are the notable trends driving market growth?
N/A
7. Are there any restraints impacting market growth?
N/A
8. Can you provide examples of recent developments in the market?
N/A
9. What pricing options are available for accessing the report?
Pricing options include single-user, multi-user, and enterprise licenses priced at USD 4900.00, USD 7350.00, and USD 9800.00 respectively.
10. Is the market size provided in terms of value or volume?
The market size is provided in terms of value, measured in million.
11. Are there any specific market keywords associated with the report?
Yes, the market keyword associated with the report is "Ultra-narrow LCD Splicing Display Unit," which aids in identifying and referencing the specific market segment covered.
12. How do I determine which pricing option suits my needs best?
The pricing options vary based on user requirements and access needs. Individual users may opt for single-user licenses, while businesses requiring broader access may choose multi-user or enterprise licenses for cost-effective access to the report.
13. Are there any additional resources or data provided in the Ultra-narrow LCD Splicing Display Unit report?
While the report offers comprehensive insights, it's advisable to review the specific contents or supplementary materials provided to ascertain if additional resources or data are available.
14. How can I stay updated on further developments or reports in the Ultra-narrow LCD Splicing Display Unit?
To stay informed about further developments, trends, and reports in the Ultra-narrow LCD Splicing Display Unit, consider subscribing to industry newsletters, following relevant companies and organizations, or regularly checking reputable industry news sources and publications.
Methodology
Step 1 - Identification of Relevant Samples Size from Population Database


Step 2 - Approaches for Defining Global Market Size (Value, Volume* & Price*)

Note*: In applicable scenarios
Step 3 - Data Sources
Primary Research
- Web Analytics
- Survey Reports
- Research Institute
- Latest Research Reports
- Opinion Leaders
Secondary Research
- Annual Reports
- White Paper
- Latest Press Release
- Industry Association
- Paid Database
- Investor Presentations

Step 4 - Data Triangulation
Involves using different sources of information in order to increase the validity of a study
These sources are likely to be stakeholders in a program - participants, other researchers, program staff, other community members, and so on.
Then we put all data in single framework & apply various statistical tools to find out the dynamic on the market.
During the analysis stage, feedback from the stakeholder groups would be compared to determine areas of agreement as well as areas of divergence