

Key Insights
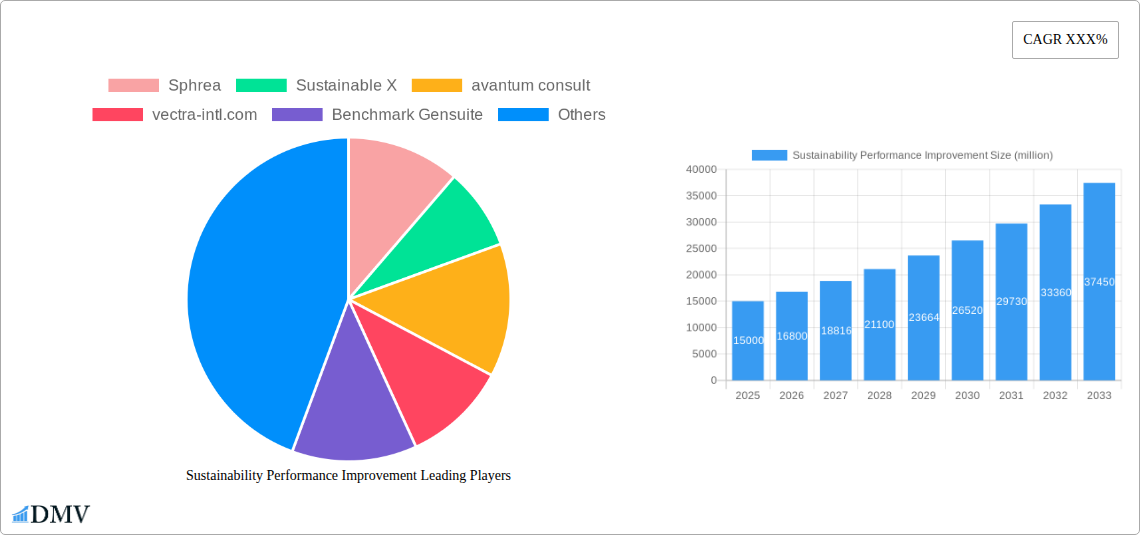
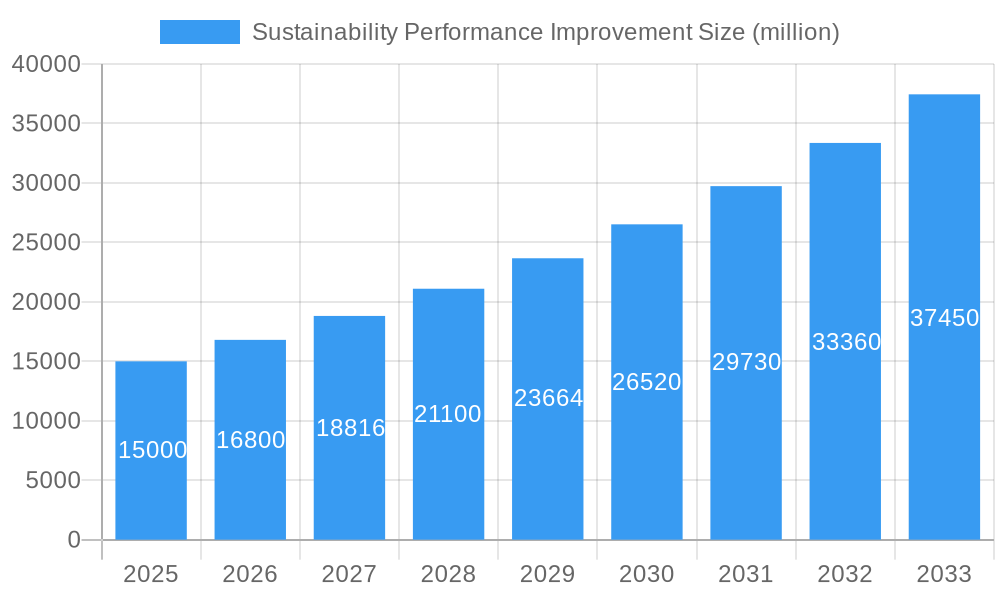
The Sustainability Performance Improvement (SPI) market is experiencing robust growth, driven by increasing regulatory pressure, heightened consumer awareness of environmental and social issues, and the growing adoption of ESG (Environmental, Social, and Governance) investing principles. The market, estimated at $15 billion in 2025, is projected to exhibit a Compound Annual Growth Rate (CAGR) of 12% from 2025 to 2033, reaching approximately $45 billion by 2033. This expansion is fueled by several key trends, including the increasing demand for data-driven sustainability solutions, the rise of technology-enabled sustainability management platforms, and a growing need for robust sustainability reporting and assurance services. Key market drivers also include corporate social responsibility initiatives, supply chain transparency demands, and the integration of sustainability into core business strategies. Companies are increasingly investing in SPI solutions to mitigate risks, enhance brand reputation, improve operational efficiency, and unlock new business opportunities. The competitive landscape is characterized by a mix of established consulting firms (Deloitte, EY, L.E.K. Consulting), specialized sustainability consultancies (Sphera, Ecovadis), and technology providers offering software solutions.
Sustainability Performance Improvement Market Size (In Billion)
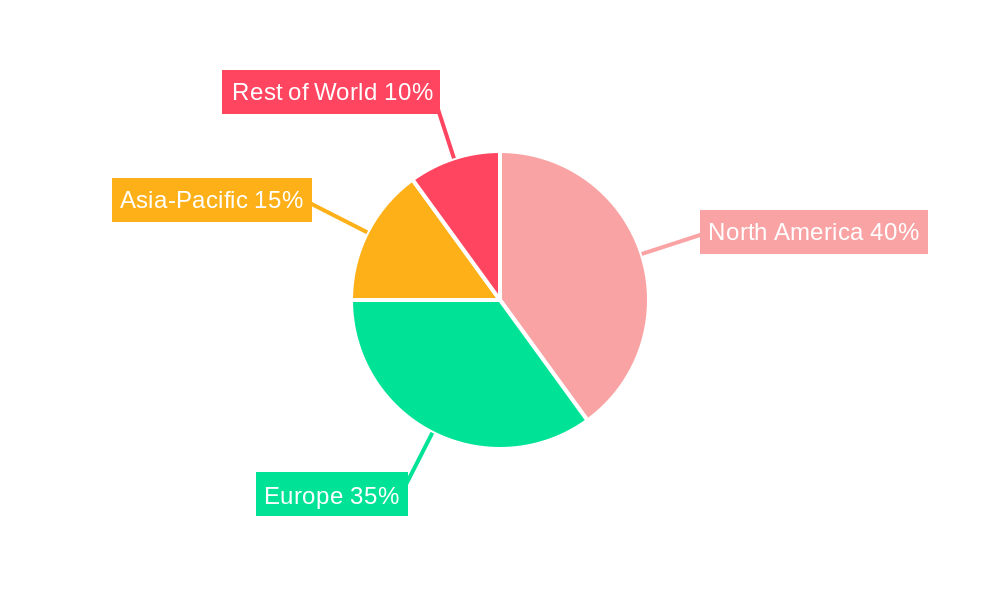
While the market presents significant opportunities, certain restraints exist. These include the high initial investment costs associated with implementing SPI programs, the complexity of measuring and reporting sustainability performance, and the lack of standardized metrics and reporting frameworks across industries. Despite these challenges, the long-term outlook for the SPI market remains highly positive. The continuous evolution of sustainability standards, coupled with growing investor and stakeholder pressure, will necessitate the adoption of sophisticated SPI solutions across various sectors, thus driving market growth well into the future. Segmentation within the market includes services (consulting, auditing, software), industry (manufacturing, energy, finance), and size of the organization (large enterprise, SME). The geographic distribution of the market is expected to be skewed towards developed economies initially, with North America and Europe holding the largest market share in the forecast period. However, increasing awareness and regulatory mandates in developing economies will contribute to considerable growth in these regions over the long term.
Sustainability Performance Improvement Company Market Share
Sustainability Performance Improvement Market Report: 2019-2033
This comprehensive report provides an in-depth analysis of the global Sustainability Performance Improvement market, projecting a market value exceeding $XX million by 2033. The study covers the historical period (2019-2024), base year (2025), and forecast period (2025-2033), offering invaluable insights for stakeholders across various industries. We delve into market dynamics, competitive landscapes, technological advancements, and emerging trends to help businesses strategize effectively for sustainable growth.
Sustainability Performance Improvement Market Composition & Trends
This section evaluates the market concentration, innovation catalysts, regulatory landscapes, substitute products, end-user profiles, and M&A activities within the Sustainability Performance Improvement market. The market is characterized by a moderately concentrated landscape, with a few major players holding significant market share. However, the emergence of innovative technologies and a growing focus on sustainability is fostering competition and driving market expansion.
Market Share Distribution (2025):
M&A Activities (2019-2024): A total of XX M&A deals were recorded, with a cumulative value exceeding $XX million, signifying considerable consolidation and strategic expansion within the sector. Key drivers include the acquisition of specialized expertise and expansion into new geographical markets. Specific examples include [insert specific M&A examples if available, otherwise leave blank].
Sustainability Performance Improvement Industry Evolution
The Sustainability Performance Improvement market has experienced substantial growth over the past decade, driven by increasing regulatory pressures, heightened consumer awareness of environmental and social issues, and the emergence of innovative technologies. From 2019 to 2024, the market witnessed a CAGR of XX%, reaching $XX million in 2024. This growth trajectory is projected to continue, with a projected CAGR of XX% during the forecast period (2025-2033), reaching a market value exceeding $XX million by 2033. Technological advancements, such as AI-powered analytics and blockchain solutions, are significantly improving the efficiency and effectiveness of sustainability initiatives, further propelling market expansion. The rising adoption of ESG (Environmental, Social, and Governance) frameworks across diverse industries also plays a crucial role. Consumer preferences for sustainable products and services are further driving the demand for improved sustainability performance, creating lucrative opportunities for market players.
Leading Regions, Countries, or Segments in Sustainability Performance Improvement
North America currently dominates the global Sustainability Performance Improvement market, driven by stringent environmental regulations, robust technological infrastructure, and high corporate social responsibility (CSR) initiatives.
Key Drivers of North American Dominance:
- Stringent environmental regulations and compliance requirements.
- Significant investments in research and development of sustainable technologies.
- High consumer awareness and demand for sustainable products and services.
- Presence of major players and established ecosystem.
Other regions like Europe and Asia-Pacific are also witnessing significant growth, driven by increasing government support for sustainability initiatives and growing environmental consciousness among consumers and businesses.
Sustainability Performance Improvement Product Innovations
Recent innovations in the Sustainability Performance Improvement market include AI-driven analytics platforms for better data management and reporting, blockchain solutions for enhanced supply chain traceability, and advanced software tools for streamlining sustainability performance assessments. These innovations offer unique selling propositions such as improved accuracy, reduced costs, and enhanced transparency, enabling businesses to effectively monitor and manage their sustainability performance.
Propelling Factors for Sustainability Performance Improvement Growth
Several factors are driving the growth of the Sustainability Performance Improvement market. Stringent environmental regulations, such as carbon emission reduction targets, are pushing companies to adopt better sustainability practices. Growing consumer awareness and demand for sustainable products and services are further driving market expansion. Advancements in technology, such as AI and machine learning, are improving the efficiency and accuracy of sustainability assessments and reporting. Finally, increased corporate social responsibility initiatives are encouraging companies to invest in sustainability improvements.
Obstacles in the Sustainability Performance Improvement Market
The Sustainability Performance Improvement market faces several challenges. High implementation costs of sustainable technologies can hinder adoption, especially for smaller businesses. Data collection and management for comprehensive sustainability assessments can also be complex and costly. Supply chain disruptions can impact the availability of sustainable materials and components. Finally, competition among providers can put downward pressure on pricing.
Future Opportunities in Sustainability Performance Improvement
The Sustainability Performance Improvement market presents numerous opportunities. The increasing adoption of circular economy principles creates opportunities for innovative waste management and resource efficiency solutions. The development of new technologies, such as carbon capture and storage, can address the climate crisis. Emerging economies present new markets for sustainable solutions. Finally, the increasing emphasis on ESG investing is creating new opportunities for companies focused on sustainability.
Major Players in the Sustainability Performance Improvement Ecosystem
- Sphrea
- Sustainable X
- avantum consult
- vectra-intl.com
- Benchmark Gensuite
- Efficio Consulting
- Good.Lab
- SAE Behavioral Health Consulting
- Ecovadis
- Business Performance Improvement
- EY
- Deloitte
- Sustainable Performance Institute
- L.E.K. Consulting
Key Developments in Sustainability Performance Improvement Industry
- 2022 Q4: Launch of a new AI-powered sustainability platform by [Company Name, if available].
- 2023 Q1: Partnership between [Company Name] and [Company Name] to develop a new sustainable supply chain solution.
- 2023 Q2: [Insert other relevant development, with date and brief description of impact].
Strategic Sustainability Performance Improvement Market Forecast
The Sustainability Performance Improvement market is poised for robust growth, driven by escalating environmental concerns, stringent regulations, and technological advancements. The increasing adoption of sustainable practices across various industries, coupled with rising consumer demand for environmentally responsible products and services, presents significant opportunities for market expansion. The integration of cutting-edge technologies, such as AI and machine learning, will further enhance efficiency and accuracy in sustainability assessments and reporting, creating a robust market outlook for the coming years.
Sustainability Performance Improvement Segmentation
-
1. Application
- 1.1. SMEs
- 1.2. Large Enterprise
-
2. Type
- 2.1. Cloud-based
- 2.2. On-premise
Sustainability Performance Improvement Segmentation By Geography
-
1. North America
- 1.1. United States
- 1.2. Canada
- 1.3. Mexico
-
2. South America
- 2.1. Brazil
- 2.2. Argentina
- 2.3. Rest of South America
-
3. Europe
- 3.1. United Kingdom
- 3.2. Germany
- 3.3. France
- 3.4. Italy
- 3.5. Spain
- 3.6. Russia
- 3.7. Benelux
- 3.8. Nordics
- 3.9. Rest of Europe
-
4. Middle East & Africa
- 4.1. Turkey
- 4.2. Israel
- 4.3. GCC
- 4.4. North Africa
- 4.5. South Africa
- 4.6. Rest of Middle East & Africa
-
5. Asia Pacific
- 5.1. China
- 5.2. India
- 5.3. Japan
- 5.4. South Korea
- 5.5. ASEAN
- 5.6. Oceania
- 5.7. Rest of Asia Pacific
Sustainability Performance Improvement Regional Market Share
Geographic Coverage of Sustainability Performance Improvement
Sustainability Performance Improvement REPORT HIGHLIGHTS
| Aspects | Details |
|---|---|
| Study Period | 2020-2034 |
| Base Year | 2025 |
| Estimated Year | 2026 |
| Forecast Period | 2026-2034 |
| Historical Period | 2020-2025 |
| Growth Rate | CAGR of XXX% from 2020-2034 |
| Segmentation |
|
Table of Contents
- 1. Introduction
- 1.1. Research Scope
- 1.2. Market Segmentation
- 1.3. Research Methodology
- 1.4. Definitions and Assumptions
- 2. Executive Summary
- 2.1. Introduction
- 3. Market Dynamics
- 3.1. Introduction
- 3.2. Market Drivers
- 3.3. Market Restrains
- 3.4. Market Trends
- 4. Market Factor Analysis
- 4.1. Porters Five Forces
- 4.2. Supply/Value Chain
- 4.3. PESTEL analysis
- 4.4. Market Entropy
- 4.5. Patent/Trademark Analysis
- 5. Global Sustainability Performance Improvement Analysis, Insights and Forecast, 2020-2032
- 5.1. Market Analysis, Insights and Forecast - by Application
- 5.1.1. SMEs
- 5.1.2. Large Enterprise
- 5.2. Market Analysis, Insights and Forecast - by Type
- 5.2.1. Cloud-based
- 5.2.2. On-premise
- 5.3. Market Analysis, Insights and Forecast - by Region
- 5.3.1. North America
- 5.3.2. South America
- 5.3.3. Europe
- 5.3.4. Middle East & Africa
- 5.3.5. Asia Pacific
- 5.1. Market Analysis, Insights and Forecast - by Application
- 6. North America Sustainability Performance Improvement Analysis, Insights and Forecast, 2020-2032
- 6.1. Market Analysis, Insights and Forecast - by Application
- 6.1.1. SMEs
- 6.1.2. Large Enterprise
- 6.2. Market Analysis, Insights and Forecast - by Type
- 6.2.1. Cloud-based
- 6.2.2. On-premise
- 6.1. Market Analysis, Insights and Forecast - by Application
- 7. South America Sustainability Performance Improvement Analysis, Insights and Forecast, 2020-2032
- 7.1. Market Analysis, Insights and Forecast - by Application
- 7.1.1. SMEs
- 7.1.2. Large Enterprise
- 7.2. Market Analysis, Insights and Forecast - by Type
- 7.2.1. Cloud-based
- 7.2.2. On-premise
- 7.1. Market Analysis, Insights and Forecast - by Application
- 8. Europe Sustainability Performance Improvement Analysis, Insights and Forecast, 2020-2032
- 8.1. Market Analysis, Insights and Forecast - by Application
- 8.1.1. SMEs
- 8.1.2. Large Enterprise
- 8.2. Market Analysis, Insights and Forecast - by Type
- 8.2.1. Cloud-based
- 8.2.2. On-premise
- 8.1. Market Analysis, Insights and Forecast - by Application
- 9. Middle East & Africa Sustainability Performance Improvement Analysis, Insights and Forecast, 2020-2032
- 9.1. Market Analysis, Insights and Forecast - by Application
- 9.1.1. SMEs
- 9.1.2. Large Enterprise
- 9.2. Market Analysis, Insights and Forecast - by Type
- 9.2.1. Cloud-based
- 9.2.2. On-premise
- 9.1. Market Analysis, Insights and Forecast - by Application
- 10. Asia Pacific Sustainability Performance Improvement Analysis, Insights and Forecast, 2020-2032
- 10.1. Market Analysis, Insights and Forecast - by Application
- 10.1.1. SMEs
- 10.1.2. Large Enterprise
- 10.2. Market Analysis, Insights and Forecast - by Type
- 10.2.1. Cloud-based
- 10.2.2. On-premise
- 10.1. Market Analysis, Insights and Forecast - by Application
- 11. Competitive Analysis
- 11.1. Global Market Share Analysis 2025
- 11.2. Company Profiles
- 11.2.1 Sphrea
- 11.2.1.1. Overview
- 11.2.1.2. Products
- 11.2.1.3. SWOT Analysis
- 11.2.1.4. Recent Developments
- 11.2.1.5. Financials (Based on Availability)
- 11.2.2 Sustainable X
- 11.2.2.1. Overview
- 11.2.2.2. Products
- 11.2.2.3. SWOT Analysis
- 11.2.2.4. Recent Developments
- 11.2.2.5. Financials (Based on Availability)
- 11.2.3 avantum consult
- 11.2.3.1. Overview
- 11.2.3.2. Products
- 11.2.3.3. SWOT Analysis
- 11.2.3.4. Recent Developments
- 11.2.3.5. Financials (Based on Availability)
- 11.2.4 vectra-intl.com
- 11.2.4.1. Overview
- 11.2.4.2. Products
- 11.2.4.3. SWOT Analysis
- 11.2.4.4. Recent Developments
- 11.2.4.5. Financials (Based on Availability)
- 11.2.5 Benchmark Gensuite
- 11.2.5.1. Overview
- 11.2.5.2. Products
- 11.2.5.3. SWOT Analysis
- 11.2.5.4. Recent Developments
- 11.2.5.5. Financials (Based on Availability)
- 11.2.6 Efficio Consulting
- 11.2.6.1. Overview
- 11.2.6.2. Products
- 11.2.6.3. SWOT Analysis
- 11.2.6.4. Recent Developments
- 11.2.6.5. Financials (Based on Availability)
- 11.2.7 Good.Lab
- 11.2.7.1. Overview
- 11.2.7.2. Products
- 11.2.7.3. SWOT Analysis
- 11.2.7.4. Recent Developments
- 11.2.7.5. Financials (Based on Availability)
- 11.2.8 SAE Behavioral Health Consulting
- 11.2.8.1. Overview
- 11.2.8.2. Products
- 11.2.8.3. SWOT Analysis
- 11.2.8.4. Recent Developments
- 11.2.8.5. Financials (Based on Availability)
- 11.2.9 Ecovadis
- 11.2.9.1. Overview
- 11.2.9.2. Products
- 11.2.9.3. SWOT Analysis
- 11.2.9.4. Recent Developments
- 11.2.9.5. Financials (Based on Availability)
- 11.2.10 Business Performance lmprovement
- 11.2.10.1. Overview
- 11.2.10.2. Products
- 11.2.10.3. SWOT Analysis
- 11.2.10.4. Recent Developments
- 11.2.10.5. Financials (Based on Availability)
- 11.2.11 EY
- 11.2.11.1. Overview
- 11.2.11.2. Products
- 11.2.11.3. SWOT Analysis
- 11.2.11.4. Recent Developments
- 11.2.11.5. Financials (Based on Availability)
- 11.2.12 Deloitte
- 11.2.12.1. Overview
- 11.2.12.2. Products
- 11.2.12.3. SWOT Analysis
- 11.2.12.4. Recent Developments
- 11.2.12.5. Financials (Based on Availability)
- 11.2.13 Sustainable Performance Institute
- 11.2.13.1. Overview
- 11.2.13.2. Products
- 11.2.13.3. SWOT Analysis
- 11.2.13.4. Recent Developments
- 11.2.13.5. Financials (Based on Availability)
- 11.2.14 L.E.K.Consulting
- 11.2.14.1. Overview
- 11.2.14.2. Products
- 11.2.14.3. SWOT Analysis
- 11.2.14.4. Recent Developments
- 11.2.14.5. Financials (Based on Availability)
- 11.2.1 Sphrea
List of Figures
- Figure 1: Global Sustainability Performance Improvement Revenue Breakdown (million, %) by Region 2025 & 2033
- Figure 2: North America Sustainability Performance Improvement Revenue (million), by Application 2025 & 2033
- Figure 3: North America Sustainability Performance Improvement Revenue Share (%), by Application 2025 & 2033
- Figure 4: North America Sustainability Performance Improvement Revenue (million), by Type 2025 & 2033
- Figure 5: North America Sustainability Performance Improvement Revenue Share (%), by Type 2025 & 2033
- Figure 6: North America Sustainability Performance Improvement Revenue (million), by Country 2025 & 2033
- Figure 7: North America Sustainability Performance Improvement Revenue Share (%), by Country 2025 & 2033
- Figure 8: South America Sustainability Performance Improvement Revenue (million), by Application 2025 & 2033
- Figure 9: South America Sustainability Performance Improvement Revenue Share (%), by Application 2025 & 2033
- Figure 10: South America Sustainability Performance Improvement Revenue (million), by Type 2025 & 2033
- Figure 11: South America Sustainability Performance Improvement Revenue Share (%), by Type 2025 & 2033
- Figure 12: South America Sustainability Performance Improvement Revenue (million), by Country 2025 & 2033
- Figure 13: South America Sustainability Performance Improvement Revenue Share (%), by Country 2025 & 2033
- Figure 14: Europe Sustainability Performance Improvement Revenue (million), by Application 2025 & 2033
- Figure 15: Europe Sustainability Performance Improvement Revenue Share (%), by Application 2025 & 2033
- Figure 16: Europe Sustainability Performance Improvement Revenue (million), by Type 2025 & 2033
- Figure 17: Europe Sustainability Performance Improvement Revenue Share (%), by Type 2025 & 2033
- Figure 18: Europe Sustainability Performance Improvement Revenue (million), by Country 2025 & 2033
- Figure 19: Europe Sustainability Performance Improvement Revenue Share (%), by Country 2025 & 2033
- Figure 20: Middle East & Africa Sustainability Performance Improvement Revenue (million), by Application 2025 & 2033
- Figure 21: Middle East & Africa Sustainability Performance Improvement Revenue Share (%), by Application 2025 & 2033
- Figure 22: Middle East & Africa Sustainability Performance Improvement Revenue (million), by Type 2025 & 2033
- Figure 23: Middle East & Africa Sustainability Performance Improvement Revenue Share (%), by Type 2025 & 2033
- Figure 24: Middle East & Africa Sustainability Performance Improvement Revenue (million), by Country 2025 & 2033
- Figure 25: Middle East & Africa Sustainability Performance Improvement Revenue Share (%), by Country 2025 & 2033
- Figure 26: Asia Pacific Sustainability Performance Improvement Revenue (million), by Application 2025 & 2033
- Figure 27: Asia Pacific Sustainability Performance Improvement Revenue Share (%), by Application 2025 & 2033
- Figure 28: Asia Pacific Sustainability Performance Improvement Revenue (million), by Type 2025 & 2033
- Figure 29: Asia Pacific Sustainability Performance Improvement Revenue Share (%), by Type 2025 & 2033
- Figure 30: Asia Pacific Sustainability Performance Improvement Revenue (million), by Country 2025 & 2033
- Figure 31: Asia Pacific Sustainability Performance Improvement Revenue Share (%), by Country 2025 & 2033
List of Tables
- Table 1: Global Sustainability Performance Improvement Revenue million Forecast, by Application 2020 & 2033
- Table 2: Global Sustainability Performance Improvement Revenue million Forecast, by Type 2020 & 2033
- Table 3: Global Sustainability Performance Improvement Revenue million Forecast, by Region 2020 & 2033
- Table 4: Global Sustainability Performance Improvement Revenue million Forecast, by Application 2020 & 2033
- Table 5: Global Sustainability Performance Improvement Revenue million Forecast, by Type 2020 & 2033
- Table 6: Global Sustainability Performance Improvement Revenue million Forecast, by Country 2020 & 2033
- Table 7: United States Sustainability Performance Improvement Revenue (million) Forecast, by Application 2020 & 2033
- Table 8: Canada Sustainability Performance Improvement Revenue (million) Forecast, by Application 2020 & 2033
- Table 9: Mexico Sustainability Performance Improvement Revenue (million) Forecast, by Application 2020 & 2033
- Table 10: Global Sustainability Performance Improvement Revenue million Forecast, by Application 2020 & 2033
- Table 11: Global Sustainability Performance Improvement Revenue million Forecast, by Type 2020 & 2033
- Table 12: Global Sustainability Performance Improvement Revenue million Forecast, by Country 2020 & 2033
- Table 13: Brazil Sustainability Performance Improvement Revenue (million) Forecast, by Application 2020 & 2033
- Table 14: Argentina Sustainability Performance Improvement Revenue (million) Forecast, by Application 2020 & 2033
- Table 15: Rest of South America Sustainability Performance Improvement Revenue (million) Forecast, by Application 2020 & 2033
- Table 16: Global Sustainability Performance Improvement Revenue million Forecast, by Application 2020 & 2033
- Table 17: Global Sustainability Performance Improvement Revenue million Forecast, by Type 2020 & 2033
- Table 18: Global Sustainability Performance Improvement Revenue million Forecast, by Country 2020 & 2033
- Table 19: United Kingdom Sustainability Performance Improvement Revenue (million) Forecast, by Application 2020 & 2033
- Table 20: Germany Sustainability Performance Improvement Revenue (million) Forecast, by Application 2020 & 2033
- Table 21: France Sustainability Performance Improvement Revenue (million) Forecast, by Application 2020 & 2033
- Table 22: Italy Sustainability Performance Improvement Revenue (million) Forecast, by Application 2020 & 2033
- Table 23: Spain Sustainability Performance Improvement Revenue (million) Forecast, by Application 2020 & 2033
- Table 24: Russia Sustainability Performance Improvement Revenue (million) Forecast, by Application 2020 & 2033
- Table 25: Benelux Sustainability Performance Improvement Revenue (million) Forecast, by Application 2020 & 2033
- Table 26: Nordics Sustainability Performance Improvement Revenue (million) Forecast, by Application 2020 & 2033
- Table 27: Rest of Europe Sustainability Performance Improvement Revenue (million) Forecast, by Application 2020 & 2033
- Table 28: Global Sustainability Performance Improvement Revenue million Forecast, by Application 2020 & 2033
- Table 29: Global Sustainability Performance Improvement Revenue million Forecast, by Type 2020 & 2033
- Table 30: Global Sustainability Performance Improvement Revenue million Forecast, by Country 2020 & 2033
- Table 31: Turkey Sustainability Performance Improvement Revenue (million) Forecast, by Application 2020 & 2033
- Table 32: Israel Sustainability Performance Improvement Revenue (million) Forecast, by Application 2020 & 2033
- Table 33: GCC Sustainability Performance Improvement Revenue (million) Forecast, by Application 2020 & 2033
- Table 34: North Africa Sustainability Performance Improvement Revenue (million) Forecast, by Application 2020 & 2033
- Table 35: South Africa Sustainability Performance Improvement Revenue (million) Forecast, by Application 2020 & 2033
- Table 36: Rest of Middle East & Africa Sustainability Performance Improvement Revenue (million) Forecast, by Application 2020 & 2033
- Table 37: Global Sustainability Performance Improvement Revenue million Forecast, by Application 2020 & 2033
- Table 38: Global Sustainability Performance Improvement Revenue million Forecast, by Type 2020 & 2033
- Table 39: Global Sustainability Performance Improvement Revenue million Forecast, by Country 2020 & 2033
- Table 40: China Sustainability Performance Improvement Revenue (million) Forecast, by Application 2020 & 2033
- Table 41: India Sustainability Performance Improvement Revenue (million) Forecast, by Application 2020 & 2033
- Table 42: Japan Sustainability Performance Improvement Revenue (million) Forecast, by Application 2020 & 2033
- Table 43: South Korea Sustainability Performance Improvement Revenue (million) Forecast, by Application 2020 & 2033
- Table 44: ASEAN Sustainability Performance Improvement Revenue (million) Forecast, by Application 2020 & 2033
- Table 45: Oceania Sustainability Performance Improvement Revenue (million) Forecast, by Application 2020 & 2033
- Table 46: Rest of Asia Pacific Sustainability Performance Improvement Revenue (million) Forecast, by Application 2020 & 2033
Frequently Asked Questions
1. What is the projected Compound Annual Growth Rate (CAGR) of the Sustainability Performance Improvement?
The projected CAGR is approximately XXX%.
2. Which companies are prominent players in the Sustainability Performance Improvement?
Key companies in the market include Sphrea, Sustainable X, avantum consult, vectra-intl.com, Benchmark Gensuite, Efficio Consulting, Good.Lab, SAE Behavioral Health Consulting, Ecovadis, Business Performance lmprovement, EY, Deloitte, Sustainable Performance Institute, L.E.K.Consulting.
3. What are the main segments of the Sustainability Performance Improvement?
The market segments include Application, Type.
4. Can you provide details about the market size?
The market size is estimated to be USD XXX million as of 2022.
5. What are some drivers contributing to market growth?
N/A
6. What are the notable trends driving market growth?
N/A
7. Are there any restraints impacting market growth?
N/A
8. Can you provide examples of recent developments in the market?
N/A
9. What pricing options are available for accessing the report?
Pricing options include single-user, multi-user, and enterprise licenses priced at USD 3950.00, USD 5925.00, and USD 7900.00 respectively.
10. Is the market size provided in terms of value or volume?
The market size is provided in terms of value, measured in million.
11. Are there any specific market keywords associated with the report?
Yes, the market keyword associated with the report is "Sustainability Performance Improvement," which aids in identifying and referencing the specific market segment covered.
12. How do I determine which pricing option suits my needs best?
The pricing options vary based on user requirements and access needs. Individual users may opt for single-user licenses, while businesses requiring broader access may choose multi-user or enterprise licenses for cost-effective access to the report.
13. Are there any additional resources or data provided in the Sustainability Performance Improvement report?
While the report offers comprehensive insights, it's advisable to review the specific contents or supplementary materials provided to ascertain if additional resources or data are available.
14. How can I stay updated on further developments or reports in the Sustainability Performance Improvement?
To stay informed about further developments, trends, and reports in the Sustainability Performance Improvement, consider subscribing to industry newsletters, following relevant companies and organizations, or regularly checking reputable industry news sources and publications.
Methodology
Step 1 - Identification of Relevant Samples Size from Population Database


Step 2 - Approaches for Defining Global Market Size (Value, Volume* & Price*)

Note*: In applicable scenarios
Step 3 - Data Sources
Primary Research
- Web Analytics
- Survey Reports
- Research Institute
- Latest Research Reports
- Opinion Leaders
Secondary Research
- Annual Reports
- White Paper
- Latest Press Release
- Industry Association
- Paid Database
- Investor Presentations

Step 4 - Data Triangulation
Involves using different sources of information in order to increase the validity of a study
These sources are likely to be stakeholders in a program - participants, other researchers, program staff, other community members, and so on.
Then we put all data in single framework & apply various statistical tools to find out the dynamic on the market.
During the analysis stage, feedback from the stakeholder groups would be compared to determine areas of agreement as well as areas of divergence